Multivariate model optimisation during the implementation of flexible interconnection projects for MV distribution networks
, , , , e
17 mar 2025

INFORMAZIONI SU QUESTO ARTICOLO
Pubblicato online: 17 mar 2025
Ricevuto: 05 nov 2024
Accettato: 17 feb 2025
DOI: https://doi.org/10.2478/amns-2025-0186
Parole chiave
© 2025 Xing Su et al., published by Sciendo
This work is licensed under the Creative Commons Attribution 4.0 International License.
Figure 1.

Figure 2.
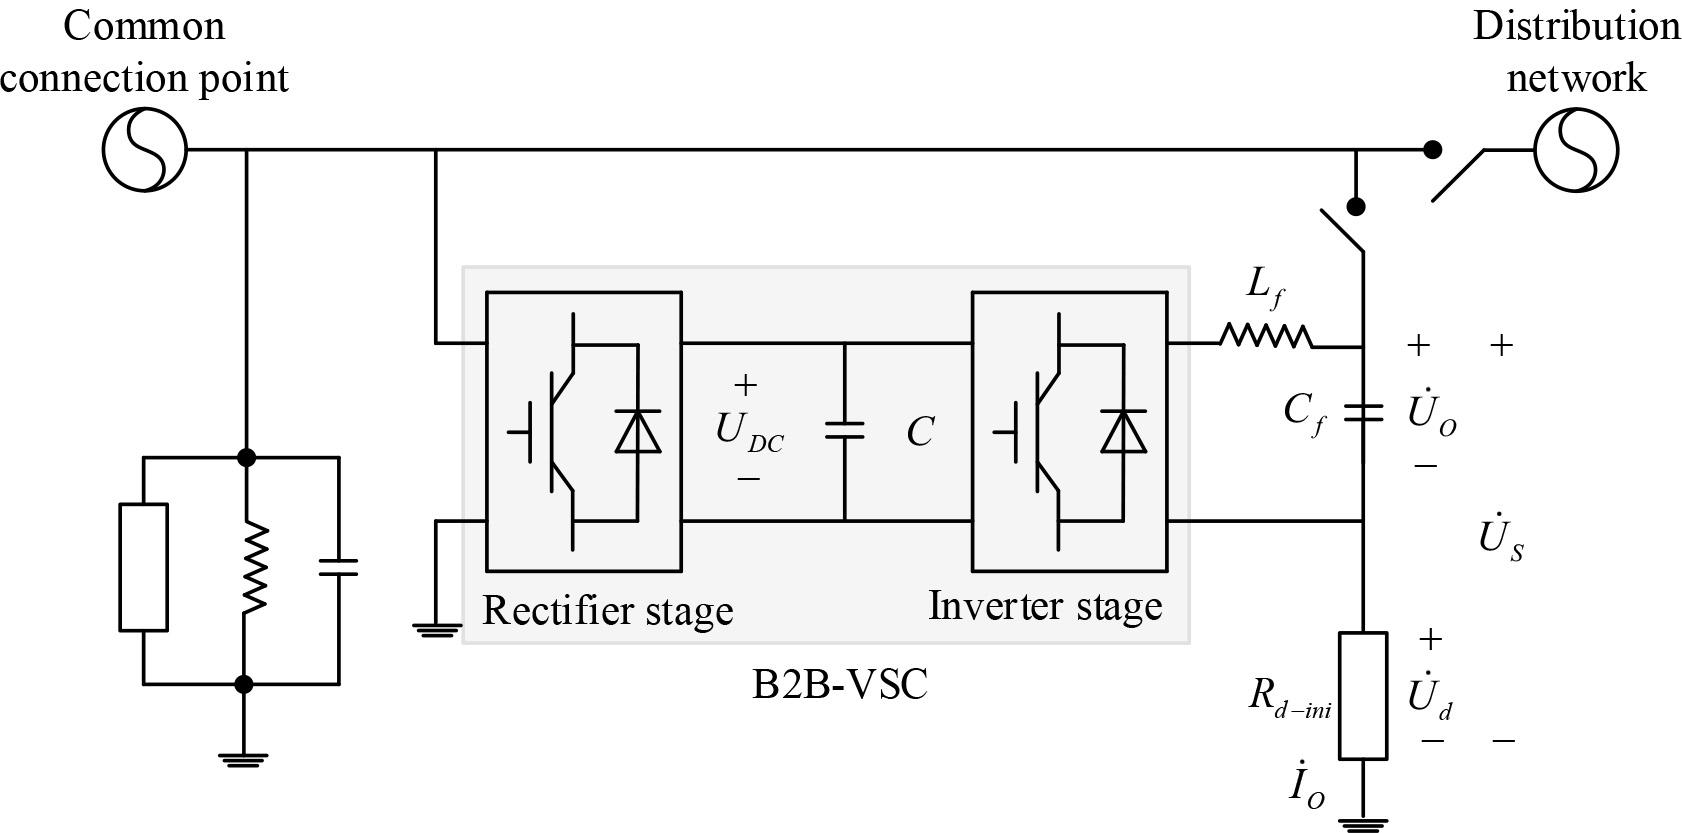
Figure 3.
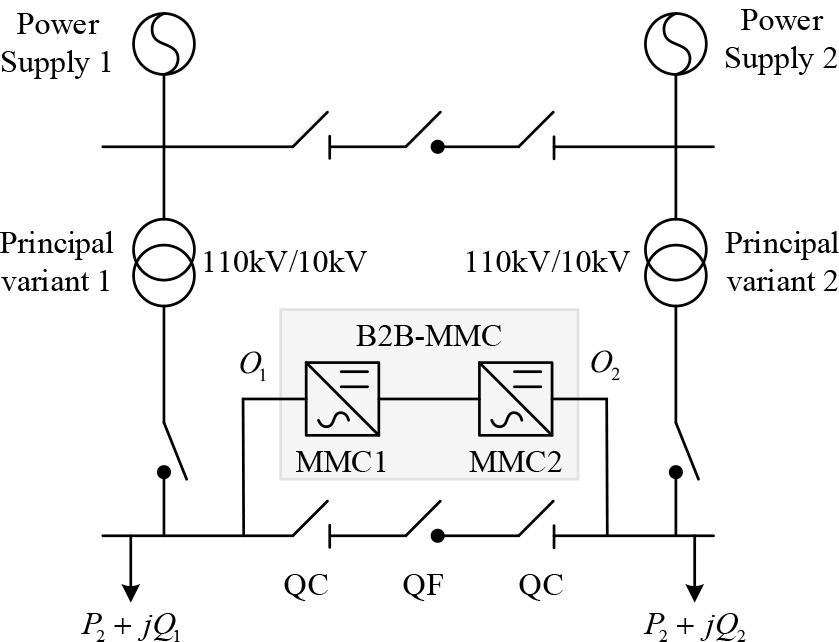
Figure 4.
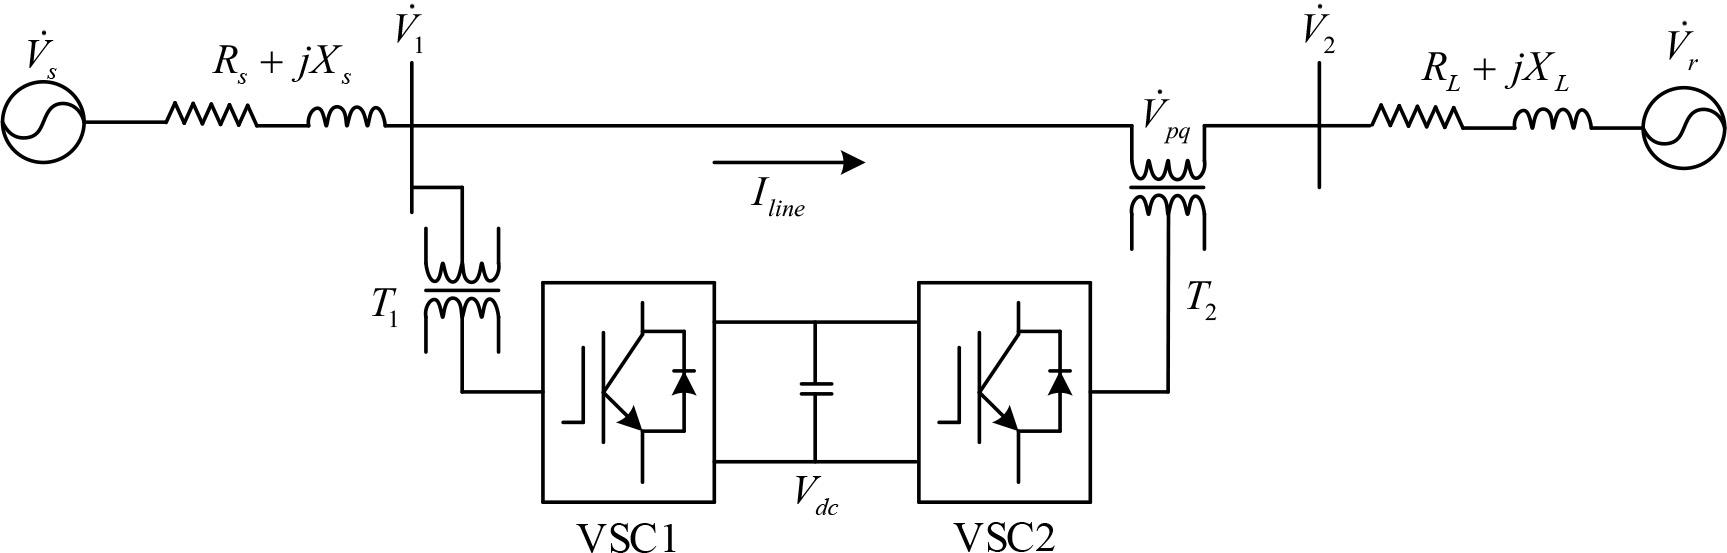
Figure 5.

Figure 6.
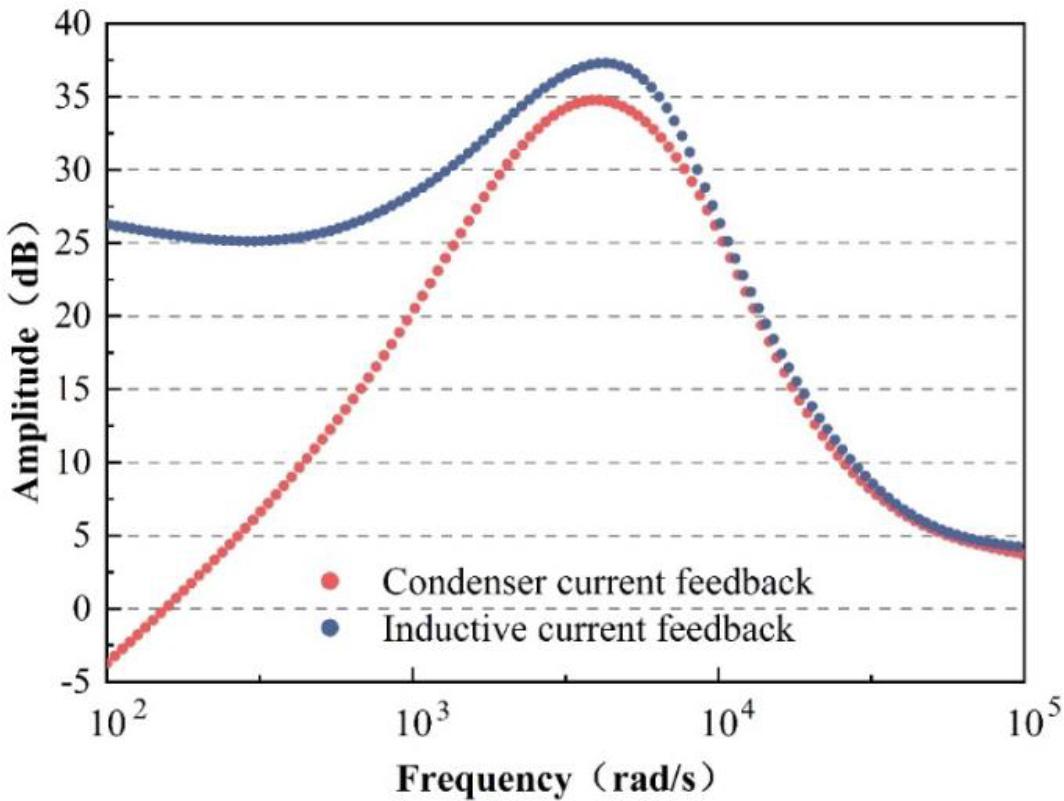
Figure 7.
Figure 8.
Figure 9.
Figure 10.
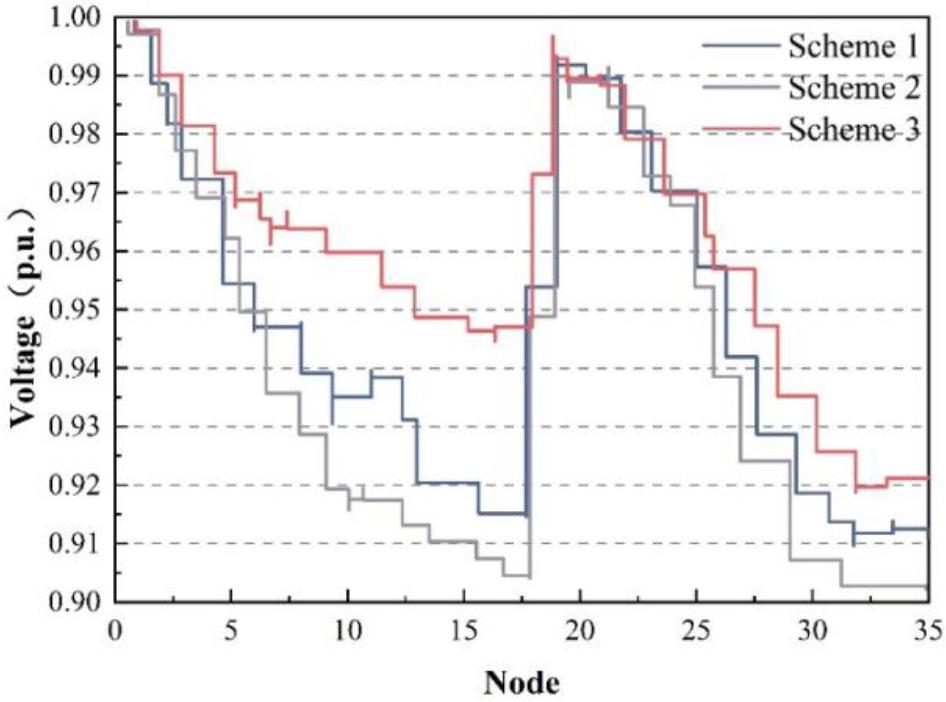
Figure 11.

The performance of different policies is the result of the comparison
| Scheme | Operating cost/CNY | Voltage deviation/p.u. | Total work loss/kWh |
| Initial system | — | 0.0870 | 4865.45 |
| Scheme 1 | 1559.5 | 0.081 | 3332.0 |
| Scheme 2 | 5543.8 | 0.0746 | 2897.3 |
| Scheme 3 | 3696.1 | 0.0685 | 2655.2 |