Multivariate model optimisation during the implementation of flexible interconnection projects for MV distribution networks
, , , , oraz
17 mar 2025

O artykule
Data publikacji: 17 mar 2025
Otrzymano: 05 lis 2024
Przyjęty: 17 lut 2025
DOI: https://doi.org/10.2478/amns-2025-0186
Słowa kluczowe
© 2025 Xing Su et al., published by Sciendo
This work is licensed under the Creative Commons Attribution 4.0 International License.
Figure 1.
Figure 2.
Figure 3.

Figure 4.
Figure 5.
Figure 6.
Figure 7.
Figure 8.

Figure 9.

Figure 10.
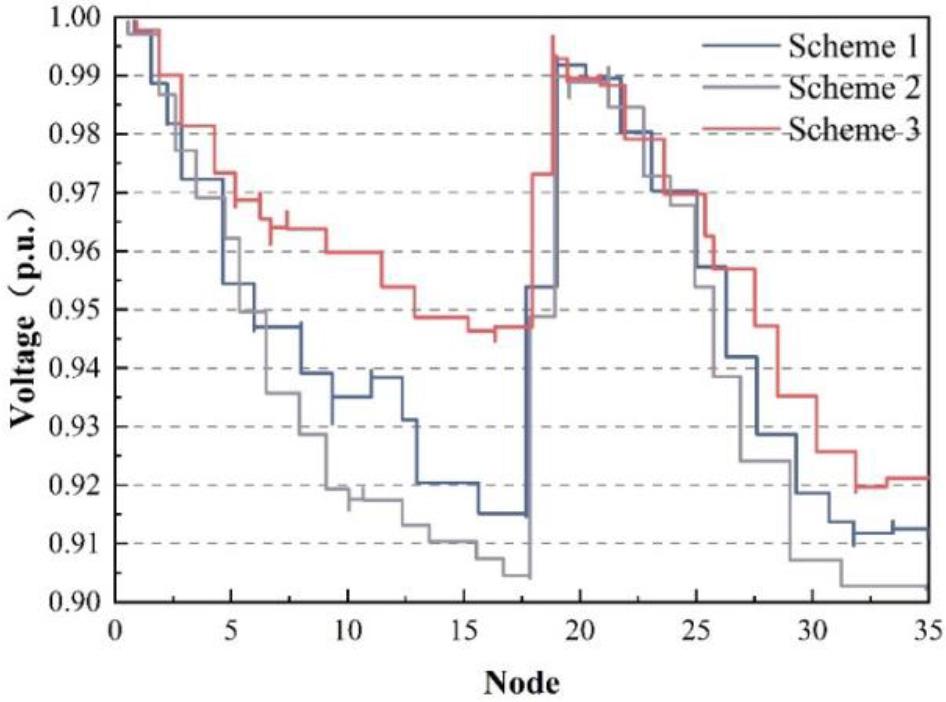
Figure 11.
The performance of different policies is the result of the comparison
| Scheme | Operating cost/CNY | Voltage deviation/p.u. | Total work loss/kWh |
| Initial system | — | 0.0870 | 4865.45 |
| Scheme 1 | 1559.5 | 0.081 | 3332.0 |
| Scheme 2 | 5543.8 | 0.0746 | 2897.3 |
| Scheme 3 | 3696.1 | 0.0685 | 2655.2 |