Multivariate model optimisation during the implementation of flexible interconnection projects for MV distribution networks
, , , , und
17. März 2025

Über diesen Artikel
Online veröffentlicht: 17. März 2025
Eingereicht: 05. Nov. 2024
Akzeptiert: 17. Feb. 2025
DOI: https://doi.org/10.2478/amns-2025-0186
Schlüsselwörter
© 2025 Xing Su et al., published by Sciendo
This work is licensed under the Creative Commons Attribution 4.0 International License.
Figure 1.
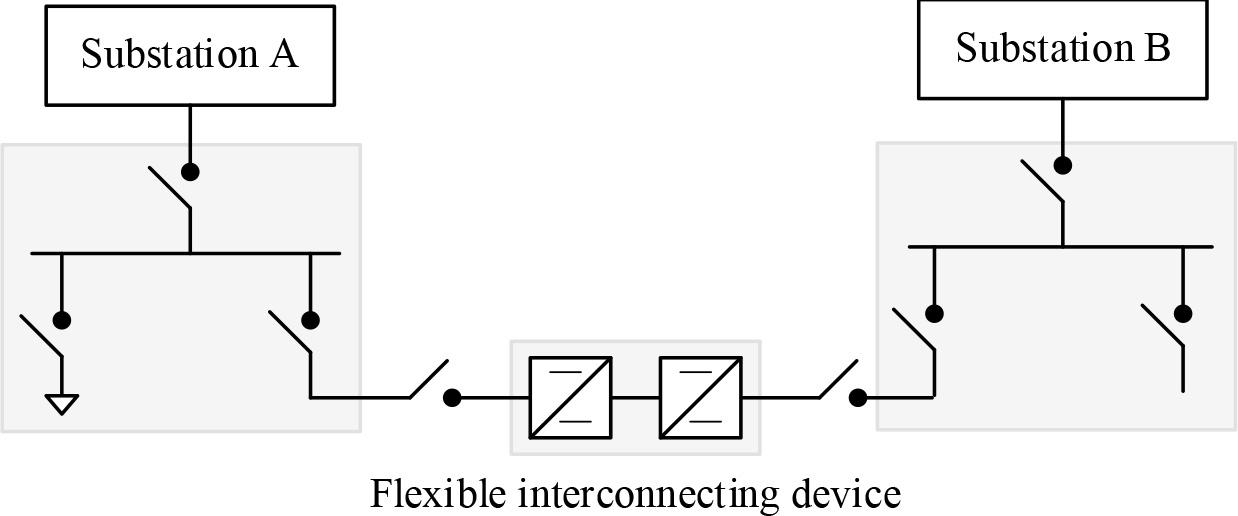
Figure 2.
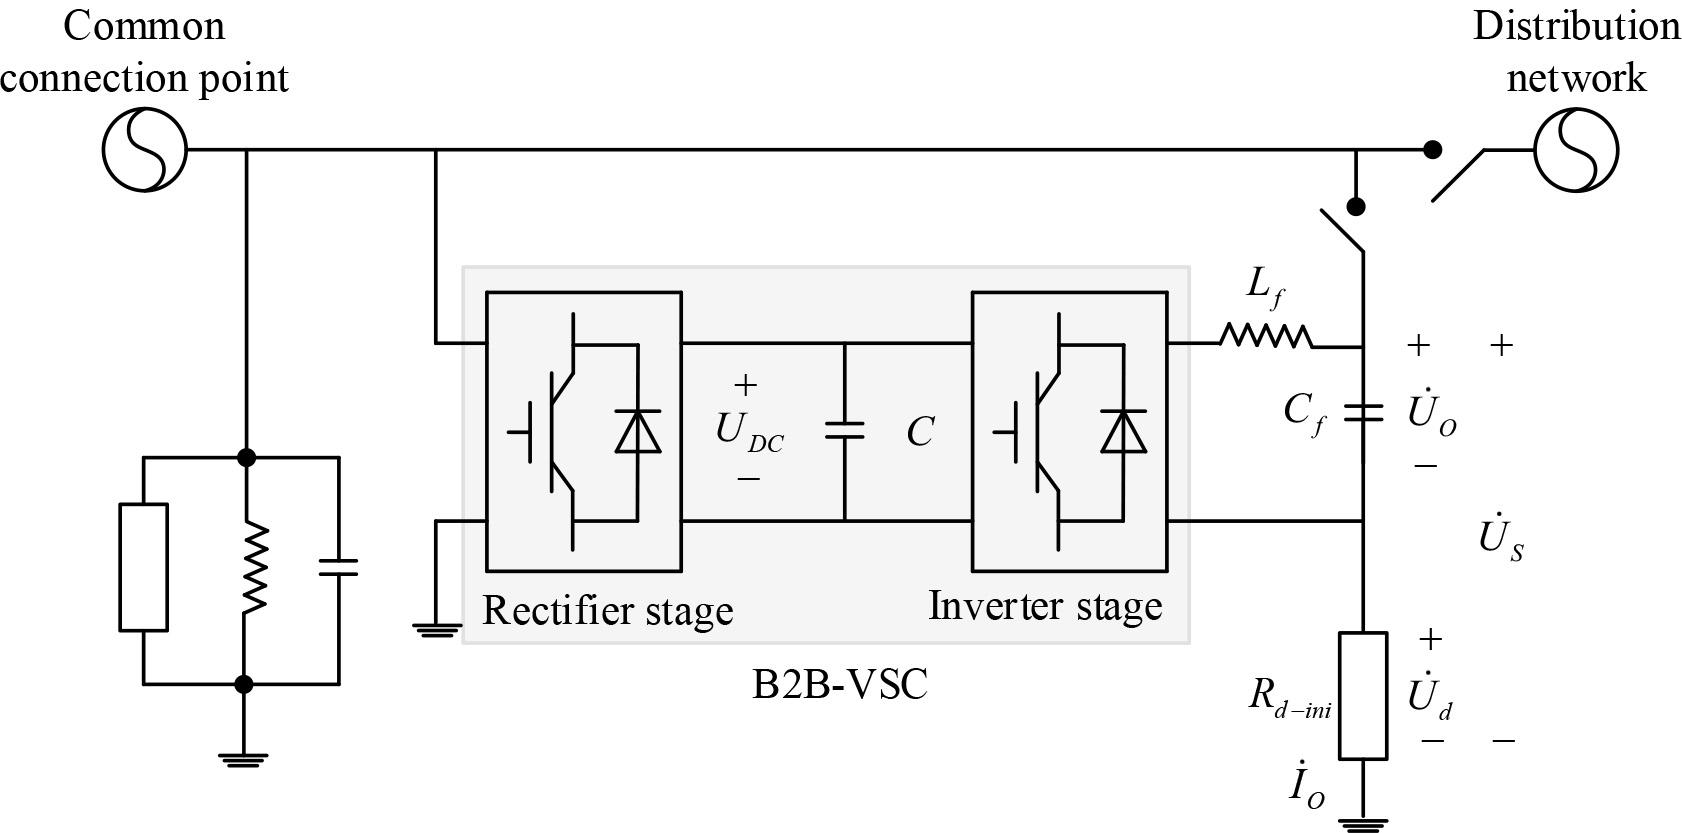
Figure 3.
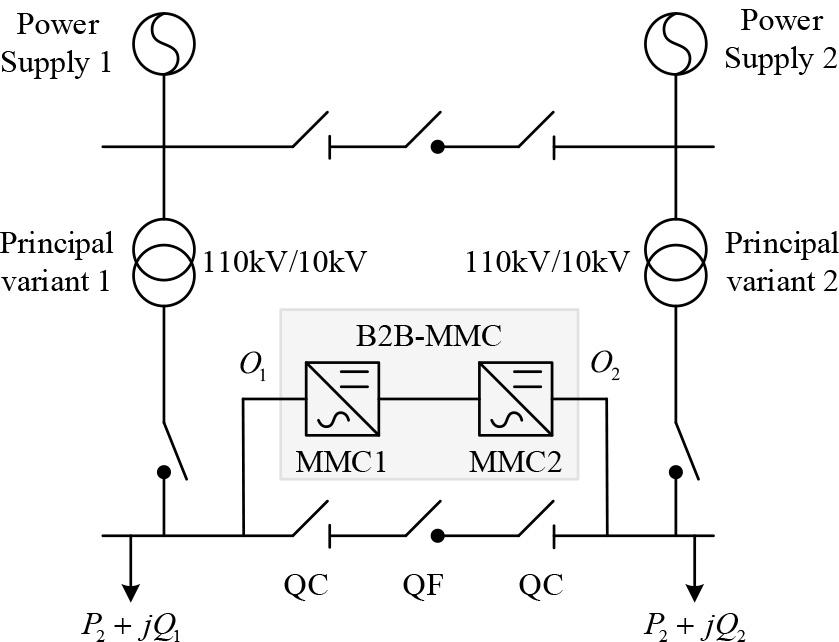
Figure 4.
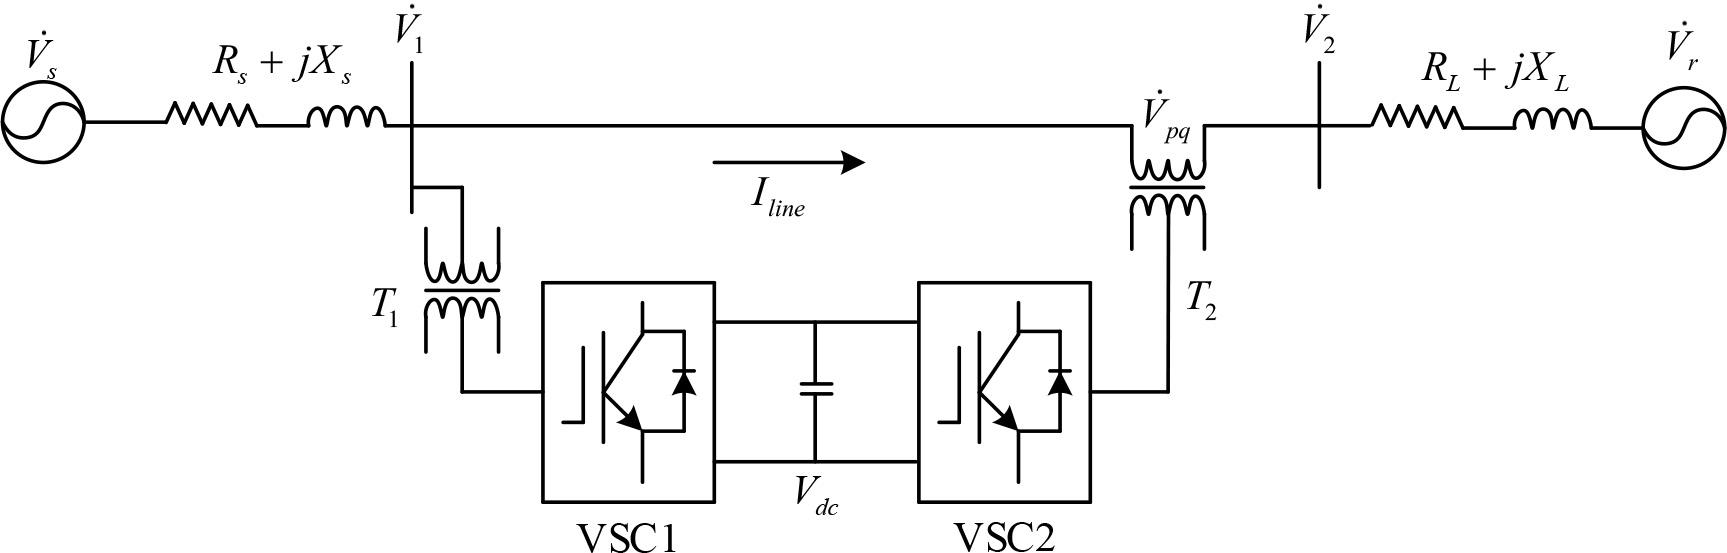
Figure 5.
Figure 6.
Figure 7.
Figure 8.
Figure 9.
Figure 10.
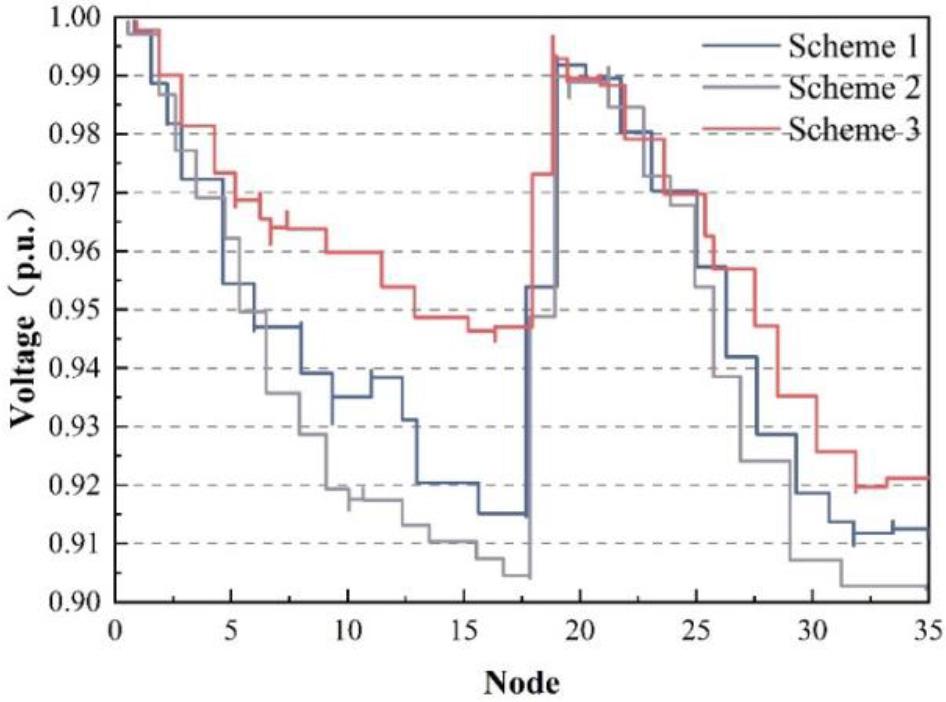
Figure 11.

The performance of different policies is the result of the comparison
| Scheme | Operating cost/CNY | Voltage deviation/p.u. | Total work loss/kWh |
| Initial system | — | 0.0870 | 4865.45 |
| Scheme 1 | 1559.5 | 0.081 | 3332.0 |
| Scheme 2 | 5543.8 | 0.0746 | 2897.3 |
| Scheme 3 | 3696.1 | 0.0685 | 2655.2 |