Calculation and Optimization Method of College Football Players in Physical Education

Data publikacji: 17 mar 2025
Otrzymano: 09 lis 2024
Przyjęty: 10 lut 2025
DOI: https://doi.org/10.2478/amns-2025-0187
Słowa kluczowe
© 2025 Erdong Xu, published by Sciendo
This work is licensed under the Creative Commons Attribution 4.0 International License.
With the rising temperature of college soccer, the control of athletes’ body load is becoming more and more important. In the daily training of athletes, the load should be reasonably controlled to ensure the physical health and development of athletes [1-2]. Sports load refers to the physiological, psychological and technical stresses that athletes undergo in competition and training, and its size will directly affect the athletes’ physical status and competition performance [3-5]. Load control refers to the control of the athlete’s body load during training and rest to achieve the purpose of health care. Especially for athletes in high-intensity sports, load control is even more critical. Scientific load control can improve athletes’ athletic ability and immunity and promote the development of physical health [6-9].
At the present stage, the content of soccer training load monitoring can be divided into the monitoring of the training class load, the monitoring of the load in the training phase, and the monitoring of the load in special periods or places, such as the pre-match training load monitoring and plateau training monitoring, etc. [10-12]. The main indicators of training load monitoring include hemoglobin, blood urea, serum creatine kinase, blood lactate, blood testosterone and cortisol and other biochemical indicators. The essence of training load monitoring for soccer players is to determine whether the load reaches the upper limit of reasonable stimulation that the athlete can withstand and make the body produce enough adaptation [13-16]. In the training, monitoring of the exercise load is the purpose of monitoring, the means is through the monitoring of the human body function changes in a series of indicators, and then through the comprehensive analysis of the series of indicators, to determine the degree of exercise load and make appropriate adjustments [17-20].
In soccer, a high-intensity, high-confrontational sport, it is particularly important to regulate exercise load with reasonable frequency. The article selects college soccer players of Sports and Health College of MD Teachers College as the research object and obtains the body load of soccer players in the training process through experimental method and test method, specifically selecting Player Load, TRIMP, maximum oxygen uptake, average heart rate, and exercise intensity as the evaluation indexes of training load. In the training process, set up different training themes and sports programs using different types of equipment to obtain the athletes’ sports training load situation and conduct data analysis.Finally, combining the training load data of soccer players, the optimization method for soccer sports training load in physical education is proposed.
Exercise load regulation in soccer training has an important impact on the development of athletes’ physical fitness, skills, and tactical abilities.The scientific regulation of sports loads can be achieved by following the principles of individualization, gradualism, periodicity, and comprehensiveness, and adopting reasonable regulation methods. Reasonable exercise load can help improve the training effect and game performance of athletes and promote the overall development of athletes. Therefore, soccer coaches should fully understand the concept, regulation principles and methods of sports load and develop scientific training plans according to the actual situation of athletes and the demands of the game in order to realize the best training effect.
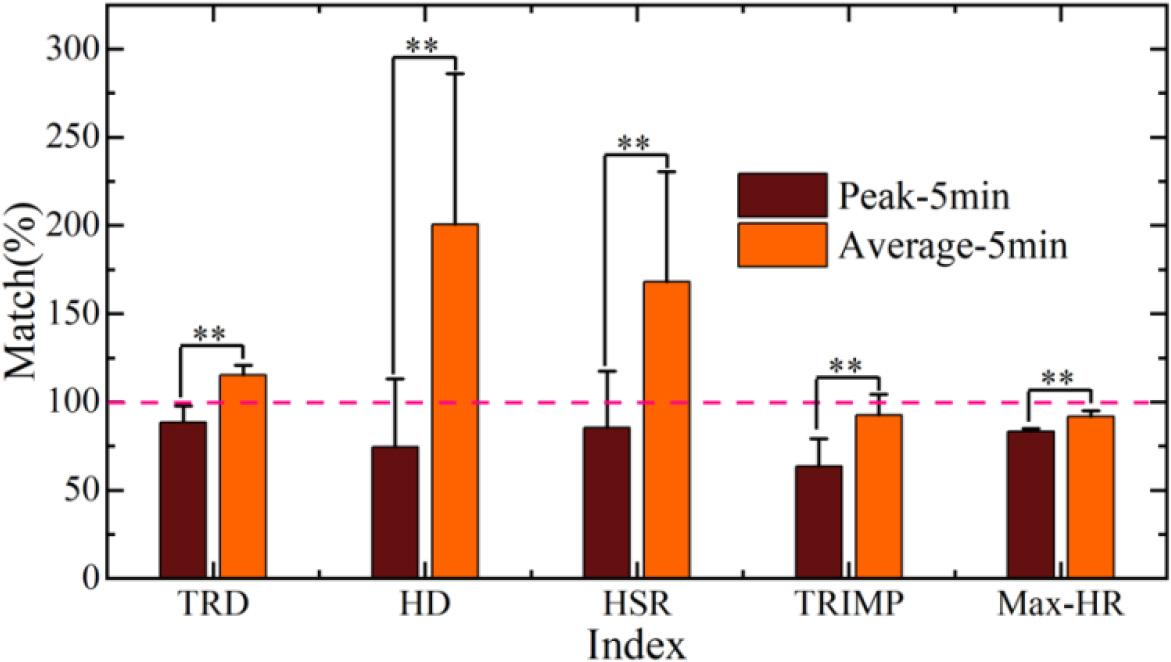
Collegiate soccer player training exercise load refers to the physiological and psychological responses caused by the stimuli applied by the coaches to the athletes’ organisms and the stimuli endured by the athletes in the sport during the soccer games or training. In terms of its structure, it can be divided into internal and external loads.External load refers to the stimulation of the athlete’s organism by generating athletic behavior, and internal load is the physiological stress response produced by the athlete’s organism after being stimulated [21]. Combined with the special characteristics and laws of soccer, drawing on previous research on sports load, this study gives the evaluation index of soccer training load as shown in Figure 1, which mainly includes internal and external load. External load refers to the amount of exercise load and relevant indicators of running, while internal load mainly refers to heart rate consumption and maximum heart rate.
Evaluation index of football training load
Heart rate
In the process of sports monitoring of athletes during competition and training, when the data collected by heart rate monitoring is used to evaluate athletes’ competition and training, it should be analyzed according to the characteristics of the heart rate and the influencing factors of the heart rate changes in a comprehensive way, so as to ensure that the evaluation of heart rate monitoring of athletes in the process of sports monitoring is scientific and effective [22]. Exercise intensity can be calculated by heart rate, specifically:
Average exercise intensity = average exercise heart rate / maximum heart rate * 100% Maximum exercise intensity = exercise maximum heart rate / maximum heart rate * 100%
Effort
Effort is a data collection parameter in Catapult Sport, a sports monitoring device. When the athlete is in motion, the body’s movement state reaches a set area and stays for a certain period, thus recording that the athlete has made an effort in terms of speed, heart rate, etc. [23]. Campus soccer Effort times are divided into three categories, i.e., sprint running, high-speed running and medium-low-speed running, with speed intervals of >6.5m/s, 4~6m/s and 2~4m/s, respectively.
Player Load
Catapult and the Australian Institute of Sport developed the Player Load parameter to measure an athlete’s effort independent of the distance they run. Player Load can help coaches measure and understand the differences in athletes’ performance in a very effective way [24]. For example, if 2 athletes have similar distance and speed profiles in a game, but one of the midfielders has a higher Player Load, it is because of his position in the team, which requires him to move quickly for short periods. Because of the different requirements of players in different positions in the game, preparation and recovery are different.
The Player Instantaneous Load can be expressed as:
The cumulative load of the athlete can be expressed as:
Of these,
Player Load is the cumulative speed and distance load, measuring instantaneous Effort and other cumulative loads over time.The accumulation of Player Load (or its subtle variations) is useful as an Effort metric in elite sports.
The subjective fatigue rating scale (RPE) evaluation scale was created by Borg, initially as a 6-20 level medical evaluation scale to evaluate subjective fatigue sensation and exertion during physical activity, and then modified to a 0-10 level scale, and the adapted RPE evaluation scale has been widely utilized in the assessment of training load intensity within various sports [25]. The specific content of the subjective fatigue rating scale is shown in Table 1. For the internal training load volume, it is defined by the training session (sRPE), which is calculated as:
Rating of Perceived Exertion Rank
| Rating | Descriptor | Rating | Descriptor |
| 0 | Rest | 6 | Very hard |
| 1 | Very, very easy | 7 | |
| 2 | Easy | 8 | |
| 3 | Moderate | 9 | |
| 4 | Somewhat hard | 10 | Maxima |
| 5 | Hard | - |
The sRPE also calculates the weekly training monotonicity (WTM) as well as the weekly training pressure (WTP), which are intended to help coaches clarify the training load of the athletes. Their calculation expressions are respectively:
Heart rate is an objective indicator for evaluating the intensity of internal training loads in aerobic exercise. Currently, percent of maximum heart rate and maximum heart rate are commonly used heart rate indicators to evaluate the intensity of internal training loads. Heart rate indexes for evaluating internal training load volume include Banister’s TRIMP, Edwards’ TL and Stagno’s TL, etc., among which Banister’s TRIMP and Edwards Banister’s TRIMP are calculated as:
Edwards’s TL calculates the product of the weight factor and exercise time for each heart rate interval, and the product of each heart rate interval is summed to obtain the final result.
MD Teachers College, College of Physical Education and Health, and College of College Soccer exclusively selected male athletes as their base of subjects. 10 students were randomly selected and required to play sports for ≥ 2 years, with athlete level or referee certificate preferred. Subjects initially identified to participate in the experiment filled out the “Experimental Participant Basic Information Questionnaire” to familiarize themselves with the basic conditions of the subjects. Subjects with caffeine intake habits, history of serious trauma in the past year, cardiovascular and neurological diseases, etc., who were not suitable to participate in the experiment or who might have a greater risk of injury in the experiment were excluded, and the final subjects included in the experiment would be informed of the risks that might occur during the experiment and the experimental rules that they needed to comply with, and signed the “Experimental Participant Informed Consent and Risk Notification Form”.
Experimental method
The college soccer players selected in the previous paper were the experimental subjects and the athletic field and physical training hall of the College of Physical Education and Health of MD Teachers College were chosen as the experimental sites to implement a 14-week stage physical training program, which was divided into two phases. The first phase of the training is to prepare for the “National College Football Championship” holiday training period, the time for the middle of June to the end of July 2023, a total of six weeks, the weekly training time from Monday to Saturday, the number of training times for six times, each training 120 minutes. The second stage is to prepare for the “National Youth Campus Football League (University High-level Group) Men’s Super Championship” pre-match semester training period, from early September to mid-October 2023, a total of six weeks, two training sessions per week in the middle of the week, two training sessions on the weekend, a total of three training sessions per week, each training time of 120 minutes, as well as for the exclude the interference of the first phase of training on the second phase of training, a 2-week washout period was conducted between the two phases from late August-early September 2023.
This study is based on the theory of plate cycle to design a stage-by-stage physical training program for college men’s soccer teams, which should be carried out according to the control procedure of the physical training process because the training process is variable and changeable due to the different tasks of the sports team in each stage. The basic structure of a complete set of physical training processes includes six links, which are the diagnosis of the starting state of the athlete, the establishment of the target state, the development of the training program, the organization and implementation of the training program, the detection and evaluation of the training effect, and the achievement of the training goals. The training is carried out in strict accordance with the formulated stage-by-stage physical training program, and the training load data of the soccer players are recorded through various types of equipment during the process.
Test method
This time, in the process of soccer players’ training load data collection equipment, the use of equipment GPS, accelerometers and heart rate acquisition unit to analyze the performance of the participating athletes in the game and sports performance for the selection of experts to provide the basis for selection and evaluation of the research for this paper to provide data support. The S-Tech company provides equipment models for the INSAIT KS soccer sports performance analysis system and the INSAIT M5 event management system.
The indexes of this test mainly include running distance, maximum speed, running distance of different zones (specifically including walking distance, jogging distance, low-speed running distance, medium-speed running distance, high-speed running distance, sprinting distance), maximum heart rate, average heart rate, and the number of sprints.
Mathematical statistics method
The real-time soccer monitoring system collected by the campus soccer selection activities of athletes and college championship athletes during the game test data related to the collation of statistics, and the use of SPSS statistical software to process and analyze real-time data collected, and then calculated and verified to determine whether the statistical significance of the data collected to support the conclusions of the study. The study was conducted using statistical methods such as paired samples t-test, independent samples t-test, Pearson correlation analysis, and one-way ANOVA. A p-value of <0.05 was characterized as significant and statistically significant.
This study is to monitor the load intensity in competition training through heart rate data, and since the maximum heart rate and resting heart rate are different between different individual athletes, the measurement of the maximum heart rate of the athletes is needed before the experiment. Maximum heart rate was measured as follows:
Athletes in the case of wearing a good heart rate meter for 6 minutes of warm-up activities, the end of the warm-up in the 105m × 68m standard soccer field for the maximum heart rate test, a total of six laps around the soccer field, requiring athletes in the first four laps within 2 minutes to complete, the fifth lap required to be completed in 1 minute and 30 seconds. The first half of the sixth lap was required to be completed within 40 seconds, and the last half of the lap required the athletes to finish the run in a full sprint, and the instantaneous maximum heart rate after the completion of the test was the maximum heart rate of the test. In this study, to avoid the influence of other factors during the test, the maximum heart rate of the athletes was tested several times, and the maximum value of the multiple measurements was taken as the maximum heart rate of the athletes. Table 2 shows the list of maximum heart rates of the tested athletes.
The maximum heart rate of the trial mobilization
| Code | Max HR | Code | Max HR |
| A | 201 | F | 215 |
| B | 198 | G | 197 |
| C | 202 | H | 216 |
| D | 195 | I | 203 |
| E | 204 | J | 198 |
The heart rate intervals in this study were referenced to the division of existing studies as a criterion for dividing the heart rate of athletes in training into 4 intervals, which were heart rate interval 1 (<75% of maximal heart rate), heart rate interval 2 (75%-85% of maximal heart rate), heart rate interval 3 (85%-90% of maximal heart rate), and heart rate interval 4 (>90% of maximal heart rate), and the training loads were evaluated according to the time that the heart rate was in each interval in relation to the total training The training load was evaluated based on the percentage of time spent in each interval to the total training time.
The speed division standard of Amisco, the official data provider of UEFA and the Chinese Soccer Super League was adopted, and its specific criteria are shown in Table 3. The running speed of soccer players in the game was classified into six-speed class intervals, which were slow running, low-speed running, medium-speed running, fast running, high-speed running and sprint running.
Speed interval division standard
| Speed level | Speed (km/h) | Speed (m/s) | Name |
| I | 0<v≤10 | 0<v≤3.05 | Jogging |
| II | 10<v≤15 | 3.05<v≤3.94 | Slow running |
| III | 15<v≤18 | 3.94<v≤4.75 | Medium run |
| IV | 18<v≤22 | 4.75<v≤5.91 | Run fast |
| V | 22<v≤25 | 5.91<v≤6.73 | High-speed run |
| VI | v>25 | v>6.73 | Sprint run |
High-intensity running distance refers to the sum of the distance run by an athlete in Speed Interval V (high-speed running) and Speed Interval VI (sprint running), as well as the distance run at an acceleration (deceleration) speed of more than 2m/s2.
Athletic training is a systematic project that includes physical training, specialized technical training, and mental development, and various factors influence each other.In the management of sports training, the management of training programs is an important aspect.At present, coaches’ practical experience is the primary factor in the development of training programs, and the main content of the program is the training requirements and methods of technical movements and physical fitness.Although different physiological and biochemical indicators and heart rate tests have been used in the scientific measurement of athletes’ fatigue, their practicality and validity have yet to be explored.This chapter focuses on quantitative analysis of previous indexes related to athletic training load, aiming to provide reliable research results to support the optimization of athletic training programs for college soccer players.
For the Player Load index of college soccer players’ training load, from the statistics of sports training data under different phases, combined with the calculation method of the Player Load index given in the previous article, we get the changes in sports load of soccer players in different positions under different phases as shown in Table 4.
Player load statistics
| Position | Stage 1 | Stage 2 | Stage 3 |
| Striker | 283.9 | 249.5 | 262.7 |
| Vanguard | 207.8 | 193.6 | 216.8 |
| Centre-Vanguard | 235.7 | 225.7 | 263.5 |
| Side-Fullback | 203.4 | 193.8 | 209.4 |
| Centre-Fullback | 246.5 | 190.4 | 243.1 |
| Means | 235.5 | 210.6 | 239.1 |
As can be seen from the table, the average Player Load of the whole team was 235.5 in the first stage of soccer players’ training, which decreased significantly in the second stage and then increased to 239.1 in the third stage, which showed a positive “U” shape overall. Compared to the first and second stages, the Player Load of college soccer players in the third stage increased by 1.53% and 13.53%, respectively. This is due to the fact that the first stage and the third stage have carried out high-intensity sports training, which makes the physical load of soccer players increase greatly, while the second stage is a washout period, which is designed to help soccer players better adjust the physical load brought about by soccer training so that the load appears to be reduced. With regard to the running load of college soccer players, the running distance and high-intensity running distance of the whole team in the third stage increased significantly, which indicates that soccer players are more likely to consume physical energy in the running.
During the training period of college soccer players, this paper set up four training sessions with different training themes, i.e., offensive and defensive transition (AC), special physical fitness (SF), pre-match adjustment (PMA) and post-match recovery (PMR), and analyzed the distribution characteristics of the various heart rate intervals on TRIMP based on the heart rate intervals classified in the previous section, and analyzed the training loads of the soccer players’ organisms brought by the different training theme training sessions. The duration of different thematic training sessions was around 100 minutes, and there was no difference in the total training time. The TRIMP distribution of heart rate zones of different thematic training sessions is shown in Table 5. As can be seen from the table, the total training impulses of soccer players under different training themes were 170.18±9.48, 181.91±5.73, 163.73±9.69, and 157.06±6.14, respectively, where the heart rate interval 2 (75%-85% of maximal heart rate) had more training impulses under the four training themes than the other heart rate intervals. This indicates that the training sessions under different training themes basically achieved the purpose of exercising the players’ physical fitness, enhancing the cardiorespiratory capacity of the soccer players, and helping to promote the athletes to cope with the sports training sessions with better physical fitness.
Different heart rate intervals TRIMP in different topic training courses
| Train | Interval 1 | Interval 2 | Interval 3 | Interval 4 | Total |
| AC | 18.24±2.78 | 83.54±4.67 | 63.24±5.15 | 5.16±2.47 | 170.18±9.48 |
| SF | 18.01±4.27 | 93.42±3.15 | 57.21±3.78 | 13.27±3.15 | 181.91±5.73 |
| PMA | 30.15±3.94 | 84.27±5.06 | 47.23±3.54 | 2.08±0.76 | 163.73±9.69 |
| PMR | 20.53±2.85 | 79.62±7.57 | 53.26±1.67 | 3.65±1.57 | 157.06±6.14 |
Based on the data in the above table, one-way ANOVA was conducted for the total TRIMP of different thematic training contents, and the Shapiro-Wilk Test of normality and Levene’s Test of variance chi-square were performed first, and the study data had normality and variance chi-square. Following this, the differences were further compared and analyzed using the LSD multiple methods, and the TRIMP variability of the heart rate intervals of the specific different thematic training sessions is shown in Table 6. In the table, *** denotes significant and highly significant differences, respectively, and the same as later.
TRIMP difference comparison results
| - | Interval 1 | Interval 2 | Interval 3 | Interval 4 | Total | |
| AC | SF | 0.041* | 0.082 | 0.003** | 0.002** | 0.000** |
| PMA | 0.004** | 0.001** | 0.000** | 0.015* | 0.001** | |
| PMR | 0.059 | 0.003** | 0.642 | 0.263 | 0.003** | |
| SF | AC | 0.045* | 0.082 | 0.000** | 0.002** | 0.002** |
| PMA | 0.001** | 0.000** | 0.000** | 0.000** | 0.001** | |
| PMR | 0.002** | 0.001** | 0.001** | 0.001** | 0.000** | |
| PMA | AC | 0.002** | 0.002** | 0.000** | 0.035* | 0.001** |
| SF | 0.001** | 0.001** | 0.002** | 0.001** | 0.002** | |
| PMR | 0.035* | 0.041* | 0.001** | 0.193 | 0.015* | |
| PMR | AC | 0.071 | 0.001** | 0.615 | 0.291 | 0.000** |
| SF | 0.002* | 0.009** | 0.001** | 0.003** | 0.001** | |
| PMA | 0.015* | 0.038* | 0.002** | 0.193 | 0.023* | |
Within heart rate interval 1 (<75% of maximum heart rate), the difference between pre-game conditioning training sessions and offensive and defensive transition, specialized fitness, and post-game recovery training sessions was highly significant (P<0.01), while the difference between pre-game conditioning training sessions and post-game recovery training sessions was also significant (P<0.05). In heart rate interval 2 (75%-85% of maximum heart rate), there was a significant difference between the offensive and defensive transition training sessions and the specialized fitness training sessions (P<0.05) and a highly significant difference between the post-game recovery training sessions and the specialized fitness and pre-game conditioning training sessions (P<0.01). Within heart rate interval 3 (85%-90% maximal heart rate), there was a highly significant difference (P<0.01) between the pre-match adjustment and offense-defense transition and specialized physical fitness training sessions and a significant difference (P<0.05) between the pre-match adjustment training session and the post-match recovery training session. There was a highly significant difference (P<0.01) between the post-game recovery training sessions and the offensive and defensive transition and specialized physical training sessions. Within heart rate interval 4 (>90% maximal heart rate), there was a highly significant difference (P<0.01) between the offensive and defensive transition training sessions and the pre-match adjustment training sessions, a highly significant difference (P<0.01) between the specialized physical fitness training sessions and the offensive and defensive transition, pre-match adjustment, and post-match recovery training sessions, and a highly significant difference (P<0.01) between the pre-match adjustment training sessions and the post-match recovery training sessions. In terms of the total TRIMP of the training sessions with different themes, there was a highly significant difference between the offensive and defensive transition training sessions and the specialized physical fitness, pre-game adjustment, and post-game recovery training sessions (P<0.01), a highly significant difference between the specialized physical fitness training sessions and the pre-game adjustment and post-game recovery training sessions (P<0.01), and a significant difference between the pre-game adjustment and post-game recovery training sessions (P<0.05). Overall, the training sessions under the four different training themes have more significant differences from each other, which is because there are certain differences in the training purposes of different training themes for soccer players, so it is necessary to set up corresponding training themes for soccer players with different needs in order to better maintain the physical functions of the soccer players and keep a good sports condition.
After 14 weeks of soccer training, the maximum oxygen uptake of the soccer players at different stages was recorded by the equipment, and the collected maximum oxygen uptake of the athletes under different stages was entered into the SPSS software, and the paired samples t-test was performed. The results of the maximum oxygen uptake test are shown in Table 7.
Test results of maximum oxygen uptake
| Index | Stage | Before | After | Change | T | P |
| Absolute value (L·min) | Stage1 | 1.81±0.24 | 1.93±0.38 | 6.63% | -0.814 | 0.172 |
| Stage2 | 1.93±0.49 | 2.25±0.64* | 16.58% | -3.247 | 0.023 | |
| Stage3 | 2.26±0.37 | 2.53±0.43** | 11.95% | -5.195 | 0.001 | |
| Relative value (L·min) | Stage1 | 22.12±4.27 | 26.28±3.95** | 18.81% | -6.032 | 0.005 |
| Stage2 | 26.26±3.74 | 28.95±3.61** | 10.24% | -5.358 | 0.000 | |
| Stage3 | 28.94±2.98 | 32.42±1.87** | 12.03% | -4.926 | 0.004 |
In terms of the absolute value of maximal oxygen uptake, there was no significant difference (p>0.05) between the soccer players before and after the first phase of training, but there was a significant difference between the second and third phases, respectively. The absolute value of maximal oxygen uptake of soccer players before the first phase of training was 1.81±0.24 L-min, and at the end of the third phase of training, their maximal oxygen uptake reached 2.53±0.43 L-min. The relative values were highly significant (p<0.01) before and after the different phases of training, and the relative value of maximal oxygen uptake increased to 2.53±0.43 L-min. Oxygen uptake relative values increased even more. The absolute and relative values of maximal oxygen uptake reflect the ability of cardiopulmonary function to function with oxygen and the ability of muscle tissue to utilize oxygen. In the early stages of training, maximal oxygen uptake is primarily increased by increasing cardiac output.With the increase of training time and the improvement of training level, the body can further increase its maximal oxygen uptake mainly through the increase of aerobic metabolism enzyme activity in peripheral tissues.In terms of sports training practice, the maximum oxygen uptake is affected by genetic factors as the basis for athlete selection. Training factors also affect the level of maximum oxygen uptake, which can reflect the changes in the cardiorespiratory function of the organism in the stage of training, and also reflect the level of the body’s physical function and assess the effect of training when the level of function decreases, the maximum oxygen uptake decreases. At the same time, the correlation between maximal oxygen uptake value and sports performance can assess the athletic ability of athletes. As can be seen from the table, after 14 weeks of training in the preparatory stage, the maximal oxygen uptake value of soccer players has a more significant increase in terms of the increase index, indicating that the coordination ability of the respiratory system and the circulatory system of the body is improved accordingly, and the level of cardiorespiratory function is improved, and the ability of the muscle tissues to utilize the oxygen is enhanced, which can further improve the athletic ability of the body.
In order to focus more accurately on the differences in training loads of athletes in different positions, the external load data of sports training under three phases were used for comparison because the training venues in all three phases were the same, reducing the influence of environmental factors on the load indexes. Multiple comparisons LSD-t test was performed on the external load data of athletes’ sports training in different positions, which was previously tested for variance alignment, and the results showed that the data variance alignment tests were all greater than 0.05 variance alignment. Table 8 shows the results of the comparison of the variability of the external load of athletic training for athletes in different positions.
External load of different position athletes
| Position | Running distance | Sprint run | High-speed run | |
| Striker | Vanguard | 0.055 | 0.015* | 0.072 |
| Centre-Vanguard | 0.001** | 0.073 | 0.043* | |
| Side-Fullback | 0.014* | 0.003** | 0.015* | |
| Centre-Fullback | 0.005** | 0.000** | 0.012* | |
| Vanguard | Striker | 0.057 | 0.015* | 0.053 |
| Centre-Vanguard | 0.104 | 0.442 | 0.904 | |
| Side-Fullback | 0.512 | 0.361 | 0.556 | |
| Centre-Fullback | 0.351 | 0.289 | 0.518 | |
| Centre-Vanguard | Striker | 0.003** | 0.075 | 0.042* |
| Vanguard | 0.103 | 0.414 | 0.915 | |
| Side-Fullback | 0.315 | 0.106 | 0.631 | |
| Centre-Fullback | 0.457 | 0.078 | 0.058 | |
| Side-Fullback | Striker | 0.016* | 0.000** | 0.014* |
| Vanguard | 0.513 | 0.631 | 0.552 | |
| Centre-Vanguard | 0.328 | 0.107 | 0.631 | |
| Centre-Fullback | 0.795 | 0.824 | 0.953 | |
| Centre-Fullback | Striker | 0.009** | 0.000** | 0.015* |
| Vanguard | 0.351 | 0.231 | 0.552 | |
| Centre-Vanguard | 0.452 | 0.076 | 0.631 | |
| Side-Fullback | 0.789 | 0.845 | 0.951 | |
The results of the study showed that in the comparison of differences in running distance, there was a significant difference in running between center backs and wingbacks (P<0.05) and a very significant difference between center backs and center forwards and strikers (P<0.01). In the comparison of differences in sprint runs, there were significant differences between center backs and side backs (P<0.05) and very significant differences between center backs and side forwards and forwards (P<0.01). In the comparison of differences in high-speed running distance, there was a significant difference between center backs and center forward, side forward, and strikers (P<0.05). There was no significant difference between the athletes at the side linebacker position and the other positions in all the indicators, and there was a highly significant difference between the athletes at the side linebacker on the same side of the field and the players at the center linebacker in terms of running distance and sprinting run (P<0.01), and there was a significant difference between the athletes at the center linebacker and the center linebacker in terms of running at a high rate of speed (P<0.05). There was a highly significant difference between center forward and center backs in terms of average running distance (P<0.01), and there was no significant difference with the other positions in each indicator.
In summary, the running distance of soccer center-back players is much lower than that of players in other positions, indicating that the center-back players can’t keep up with the trend of modern soccer development, and there is still much room for improvement in the load-bearing capacity of center back players, who need to improve the ability of anaerobic high-intensity running. The running ability of a center forward is higher than that of other positions, which indicates that soccer center forward athletes have strong offensive and defensive coverage abilities.
Based on the 14-week soccer sports training program designed in this paper, the average heart rate, the maximum heart rate, the average exercise intensity, and the maximum exercise intensity indexes of the soccer players under different cycles were measured, and the heart rates and exercise intensities of the training sessions of the soccer players under different cycles were obtained as shown in Table 9.
Training course heart rate and motion intensity
| Week | Average HR (bpm) | Max HR (bpm) | Mean intensity (%) | Max intensity (%) |
| Week1 | 144.2 | 177.4 | 73.28 | 89.24 |
| Week2 | 151.3 | 175.2 | 72.05 | 89.58 |
| Week3 | 146.1 | 182.5 | 77.32 | 89.02 |
| Week4 | 158.4 | 182.8 | 77.48 | 89.66 |
| Week5 | 154.5 | 191.3 | 75.55 | 89.07 |
| Week6 | 144.7 | 190.2 | 74.88 | 89.79 |
| Week7 | 149.6 | 174.5 | 70.17 | 82.03 |
| Week8 | 144.9 | 175.2 | 70.36 | 83.61 |
| Week9 | 145.3 | 189.2 | 74.54 | 88.37 |
| Week10 | 152.6 | 174.8 | 79.99 | 86.07 |
| Week11 | 148.8 | 180.7 | 73.56 | 88.17 |
| Week12 | 152.1 | 189.1 | 75.57 | 88.08 |
| Week13 | 156.4 | 191.9 | 76.15 | 87.95 |
| Week14 | 146.5 | 191.4 | 77.41 | 85.67 |
The results of the study showed that the average heart rate of soccer players was between 144.2bpm and 158.4bpm during the 14-week training period of the intensive training period, and it rose to the highest in the 4th week. The mean exercise intensity of the athletes ranged from 70.17% to 79.99% with moderate-intensity aerobic exercise, and the exercise intensity of the training in weeks 7 and 8 was the lowest in the training period, and in week 10 the mean exercise intensity reached 79.99% of the maximum value at moderate-high exercise intensity. The average heart rate from week 11 to week 14 ranged from 146.5bpm to 156.4bpm, and the exercise intensity was maintained at 73.56% to 77.41%, while the average heart rate of soccer sports games was 175bpm and the average exercise intensity was 85%. This indicates that there is a deficiency in the intensity arrangement of soccer sports training in the third stage, but the highest exercise intensity in weeks 2 to 6 is close to about 90%, which indicates that there is a higher intensity training content in the training sessions in these weeks. Different training stages have varying training arrangements, different classes have varying training objectives, and various training arrangements must meet the corresponding goal requirements.Coaches should choose different exercises according to the overall arrangement of the training process, as well as the objectives and design of the training process. From the point of view of stimulation recovery, the 11th to 14th week is the pre-competition training week and should have higher load intensity, giving enough stimulation. In the 7th to 8th week of the competition week, sports intensity is low. Load sports training with science, cycle training, and law.
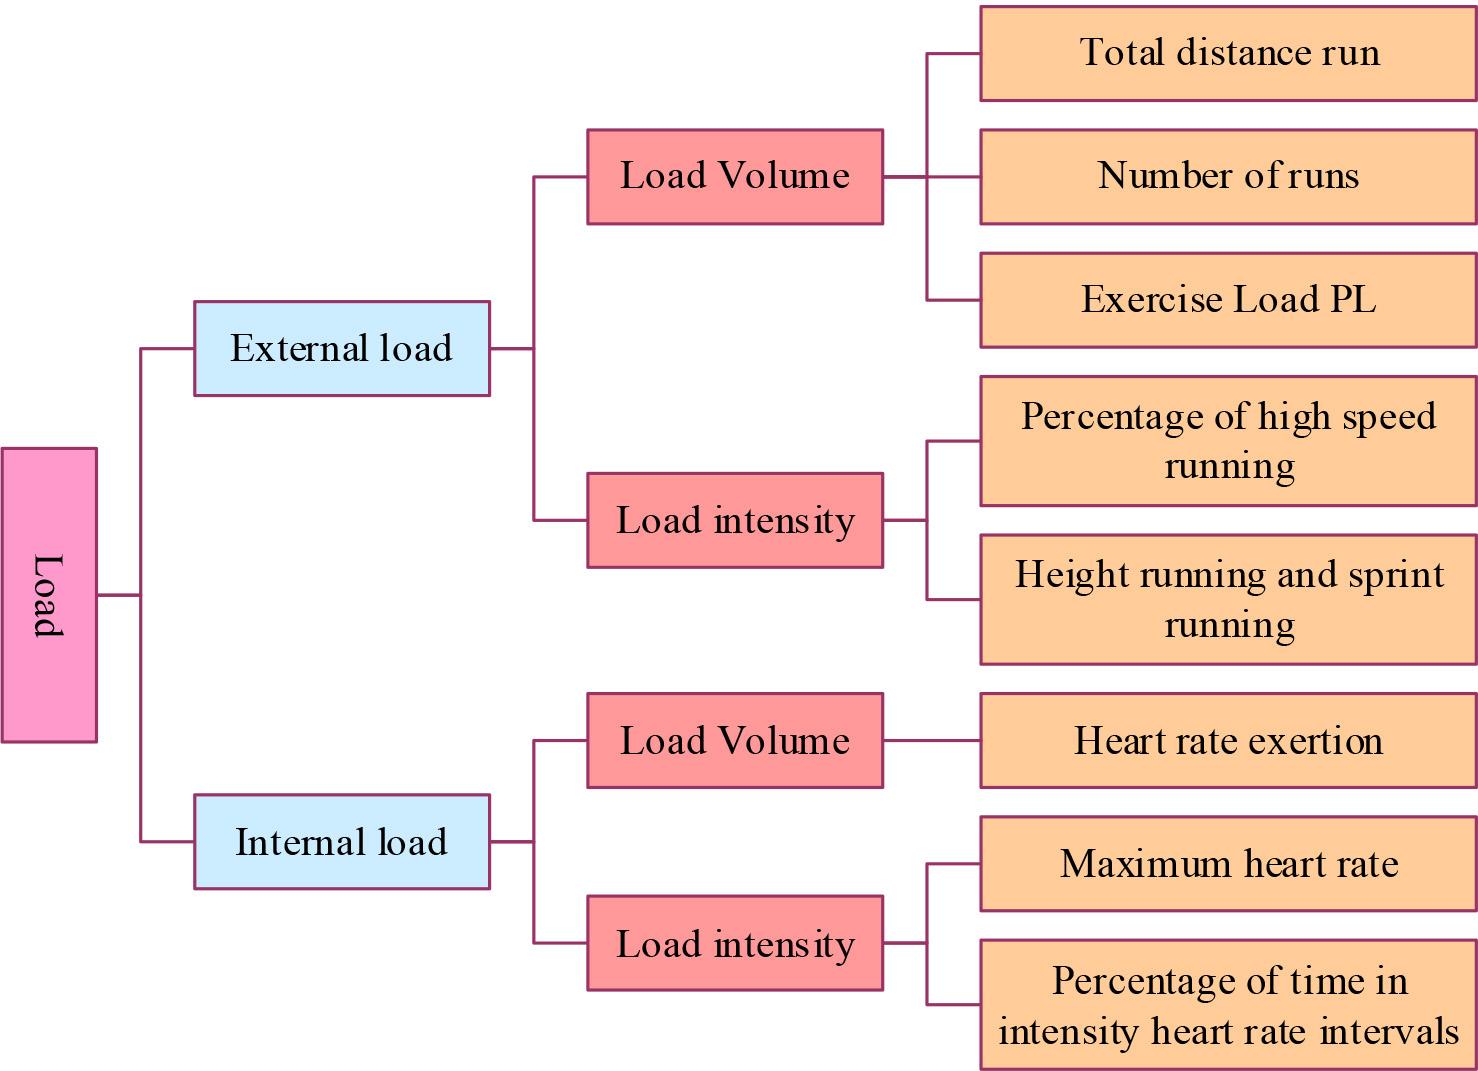
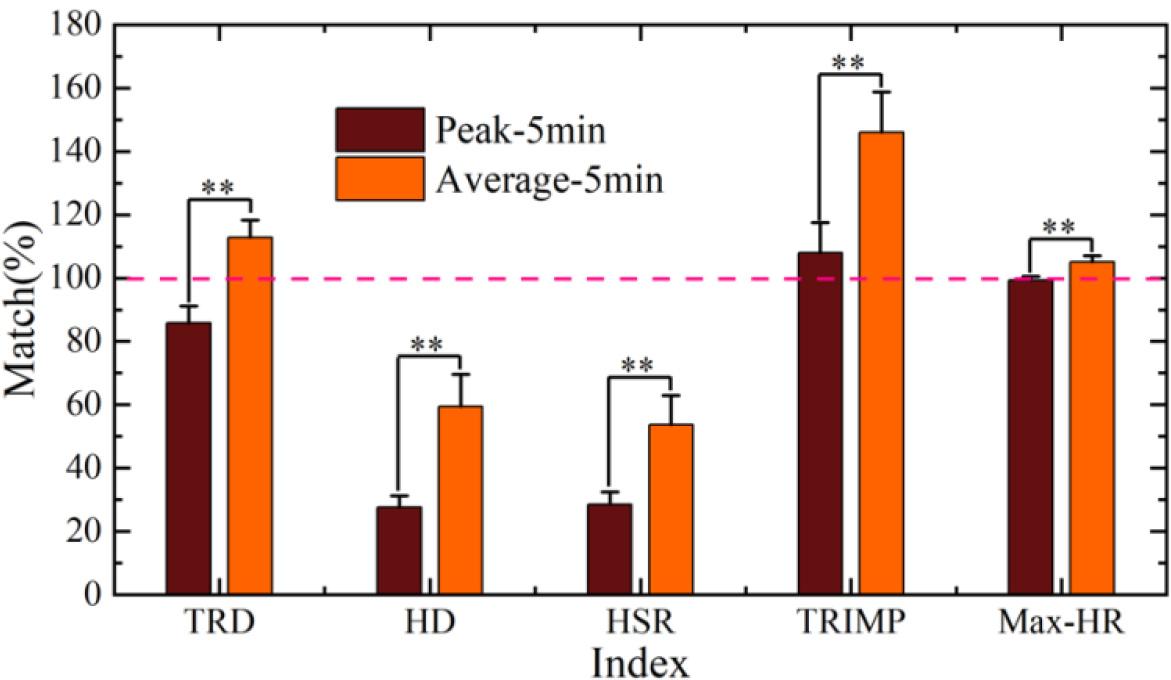
The purpose of collecting the athletic training load data of soccer players is to better develop training programs to help athletes achieve better performance, and the assessment of soccer players’ training load based on the athletic training load data provides data support for the development of athletic training programs. The total running distance (TRD), high-intensity running distance (HD), high-intensity running ratio (HSR), TRIMP and maximal heart rate (Max-HR) were selected as the five load indexes, and the Peak-5min game loads of the youth age group games were used to assess the training loads of the soccer players, with the total running distance, high-intensity running distance, high-intensity running ratio, TRIMP and maximal heart rate being 120.6m/min, 19.2m/min, 17.5%, 4.2AU/min, 89.3%, and Average-5min match load (total running distance, high-intensity running clusters, high-intensity running percentage, TRIMP and maximal heart rate of 91.3m/min, 8.5m/min, 8.7%, 2.8AU/min, 83.5%, respectively) were used as the benchmarks for The training loads were evaluated and calculated for 2 specialized high load exercises for soccer players. The 2 specialized high-load contacts were the (5vs5+2GK) two-penalty-area confrontation exercise and (10vs10+2GK) two-penalty-area inter-area confrontation exercise, respectively. Figures 2 and 3 show the results of the different metrics of variability tests for the (5vs5+2GK) and (10vs10+2GK) two free throw zone confrontation exercises, respectively.
(5vs5+2GK) two penalty area countermeasures practice
(10vs10+2GK) two penalty area countermeasures practice
In the (5 vs 5+2GK) two free throw zone confrontation exercises, the assessment results of all indicators showed significant differences (t = -20.52 to -218.41, p < 0.01) when using Peak-5min and Average-5min game loads as the baseline for the assessment of this exercise load. Only TRIMP reached the level of competition load when using Peak-5min competition load as a benchmark, and 3 indicators, total running distance, TRIMP and maximum heart rate, reached the level of competition load when using Average-5min competition load as a benchmark. In the (5vs5+2GK) confrontation exercise, for external loading, only the running distance reached the average competition level (117.27%), and the high-intensity running distance and percentage did not reach either the average competition level (69.67%, 62.38%) or even the competition Peak-5min level (30.57%, 31.93%). In terms of internal loading, both TRIMP and maximal heart rate largely met or exceeded the competition level of Peak-5min (116.43%, 100.28%) and far exceeded the competition level of Average-5min (158.74%, 107.08%). This phenomenon can be explained by the study of small-field games, i.e., due to the relatively small playing field and small number of people, each player may perform more short-distance sprinting behaviors, but the absolute speed is difficult to reach the threshold of high-intensity running speed, so the high-intensity running distance is lower. Also due to the relatively small area per capita, the confrontation is more intense, the technical actions are used more frequently, and the number of offensive and defensive rounds increases, so the internal load of the players is higher.
In the (10vs10+2GK) two-penalty inter-area confrontation practice, there were significant differences in the assessment results of each index when using Peak-5min and Average-5min game loads as the baseline for this training load (t = -21.94 to -126.93, P < 0.01). When using the Peak-5min race load as a benchmark, all metrics did not reach the level of the race load, and when using the Average-5min race load as a benchmark, the total running distance, high-intensity running distance, and high-intensity running percentage reached the level of the race load. In the (10vs10+2GK) confrontation exercise, in terms of external loading, the running distance reached 97.35% and 120.68% of the competition Peak-5min and Average-5min, respectively, and the high-intensity running distance and percentage reached 74.47% and 85.55% of the competition Peak-5min, Average-5min 200.74% and 168.19%. In terms of internal loading, TRIMP and maximal heart rate did not reach the competition level of Peak-5min, but basically reached the competition level of Average-5min. Due to the large size of the playing field, each player had more space for high-intensity running, coupled with the fact that the coaching staff required the players to implement high pressure and quick recovery at the tactical level and gave constant verbal feedback during the training. As a result, both the distance run and the high-intensity run in this exercise far exceeded the game average.
Compared to the (5vs5+2GK) exercise, the (10vs10+2GK) matchup exercise has a larger field, more people, and a longer period of time, and the players have more opportunities to catch their breath and make adjustments, so the internal loading is only the same as the average of the game, and it does not reach the Peak-5min level. The exercise far exceeded the match average in terms of external loading, was close to the highest level of running requirements, and was able to reach the match average in terms of internal loading, indicating that it was able to simulate the loading requirements of repeated high-intensity running in matches, but had an average degree of cardiorespiratory fitness stimulation for the players. Therefore, although both exercises satisfy the highest load requirement of the match, they are reflected in different aspects, and appropriate indicators should be selected to evaluate the training load by considering the specific practice situation and objectives and combining the highest and average loads of the match.
For college soccer training load calculation, its ultimate goal is to adjust the sports training program based on the training load data to help college sports education improve the physical quality of athletes so that the quality of college sports teaching can be improved. Based on the calculation and analysis of the training load data of soccer players, this paper mainly focuses on the optimization of the training load from the two dimensions of training and training methods so as to ensure that college soccer players get better physical condition but also to help the high-quality development of college physical education.
A relaxed training environment allows soccer players to relax and feel nervous, which reduces psychological pressure and makes it easier to accept external stimuli. When the athlete is depressed, the exercise will make the cells excited and reduce the excitement of the pain cells so that the athlete can maintain a good mood, which is beneficial to regulate the attention of the brain and achieve a state of psychological balance. Athletes in a relaxed and happy training environment often can actively accept the stimulus produced by the movement and produce positive effects.
Coaches can create a relaxed atmosphere by switching training methods, etc., through a friendly attitude, giving athletes full respect and care, with their positive attitude and healthy personalities to guide the athletes so that athletes can easily exercise in a pleasant environment, which is for athletes to relieve psychological pressure, the formation of good psychological quality.
For soccer players, the scientific rationality of training methods can help them carry out reasonable and effective sports, improve the athletes’ physical and psychological state, and further maintain good exercise habits.Thus, in daily sports training, the coach should teach soccer players scientific exercise methods. Exercise should choose a main item and other auxiliary items so that the body can get a comprehensive exercise so that the expected results can be achieved, thus enhancing the confidence of the athletes will not have a sense of frustration.
Sports coaches should be based on the relevant standards of the soccer tournament, a reasonable choice of assessment indicators, to the actual situation of the soccer players as a starting point to develop a scientific exercise method. To help soccer players maximize their body explosive force, set the training load indicators in line with the physical quality of soccer players and towards the effective completion of the load indicators to help athletes achieve the continuous improvement of sports skills.
This paper used several training load indicators to measure the training load of college soccer players, and proposed a training load optimization method for soccer in physical education. During the 14-week three-stage soccer training, the average player load of soccer players was 235.5 in the first stage, decreased significantly in the second stage, and then increased to 239.1 in the third stage, with an overall positive U-shape.
After 14 weeks of soccer training, the absolute value of maximal oxygen uptake of soccer players increased from 1.81±0.24 L/min to 2.53±0.43 L/min, which indicated that the appropriate intensity of soccer training load could help to enhance the cardiorespiratory capacity of the athletes and promote the better performance of their sports skills. During the 14-week intensive training period, the average heart rate of the soccer players ranged from 144.2 bpm to 158.4 bpm, while their average exercise intensity ranged from 70.17% to 79.99%. Under the two different training load assessment standards of peak-5min and average-5min, the training load data of soccer players can be analyzed to clarify the training load changes of the athletes and provide reliable data support for the tailor-made sports training program. In addition, after clarifying the training load of athletes, it is necessary to create a more relaxed training atmosphere, relying on scientific training methods to promote the quality of teaching soccer in physical education, which helps to further improve the sports level of soccer players.