Entrepreneurial Project Management and Personal Career Growth Path Design Using the PDCA Cycle Model
17 mars 2025

À propos de cet article
Publié en ligne: 17 mars 2025
Reçu: 06 nov. 2024
Accepté: 12 févr. 2025
DOI: https://doi.org/10.2478/amns-2025-0176
Mots clés
© 2025 Cui Zhang, published by Sciendo
This work is licensed under the Creative Commons Attribution 4.0 International License.
Figure 1.
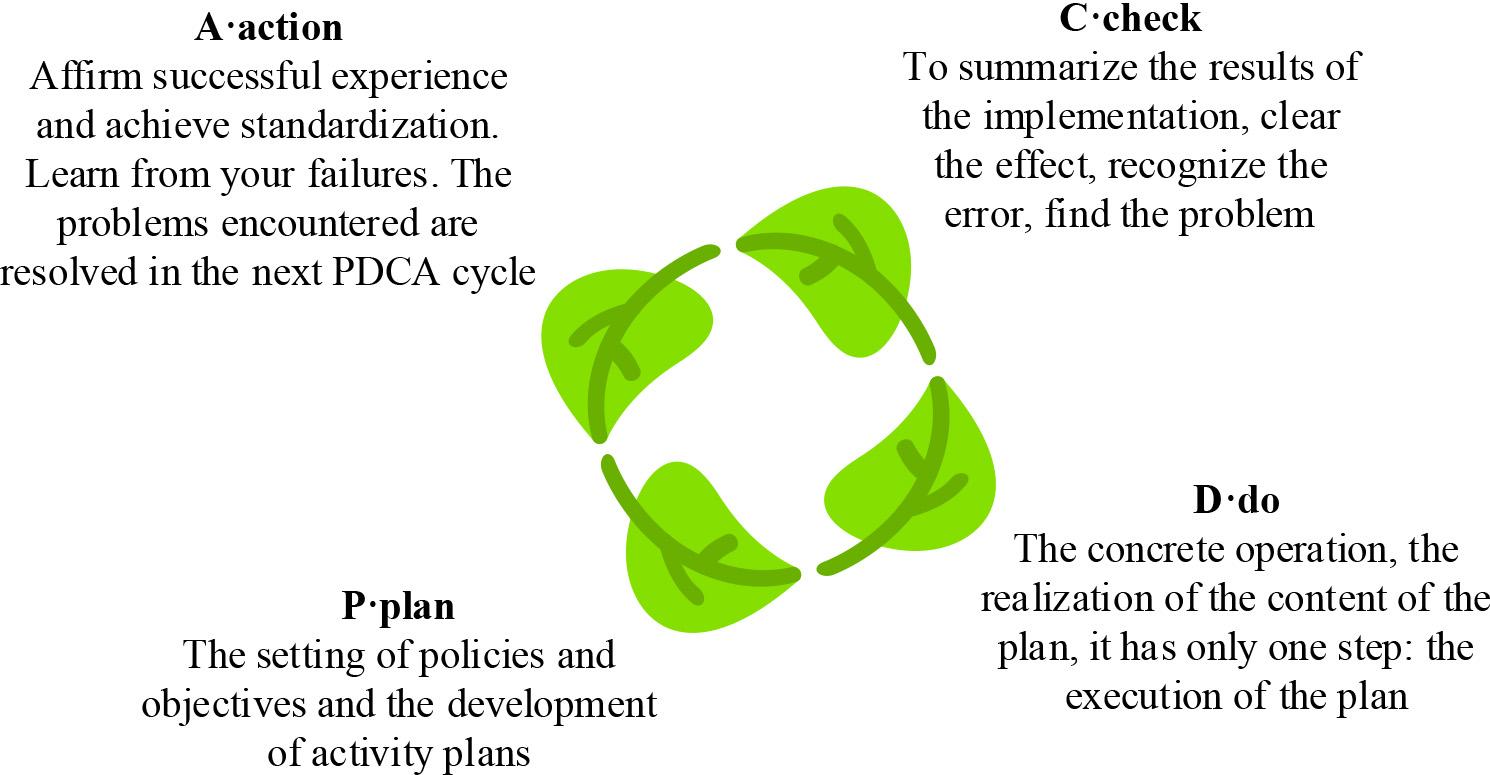
Figure 2.
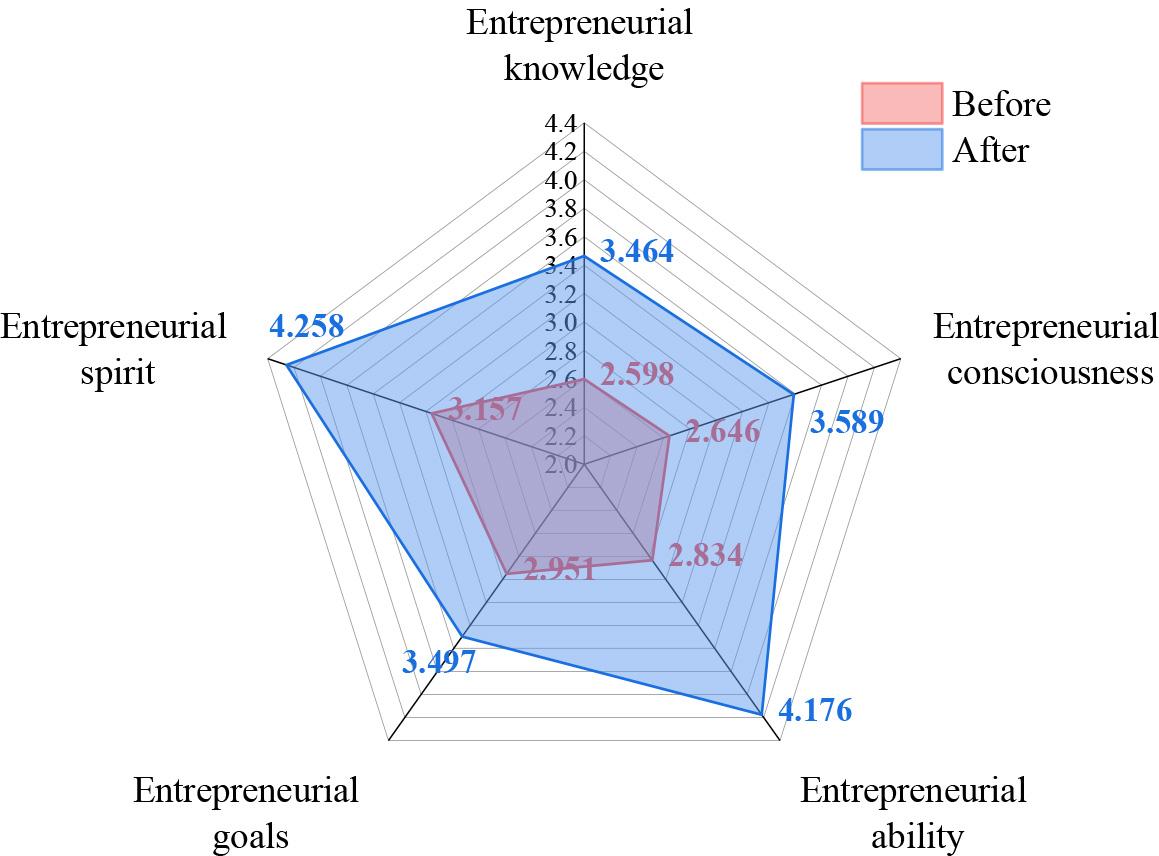
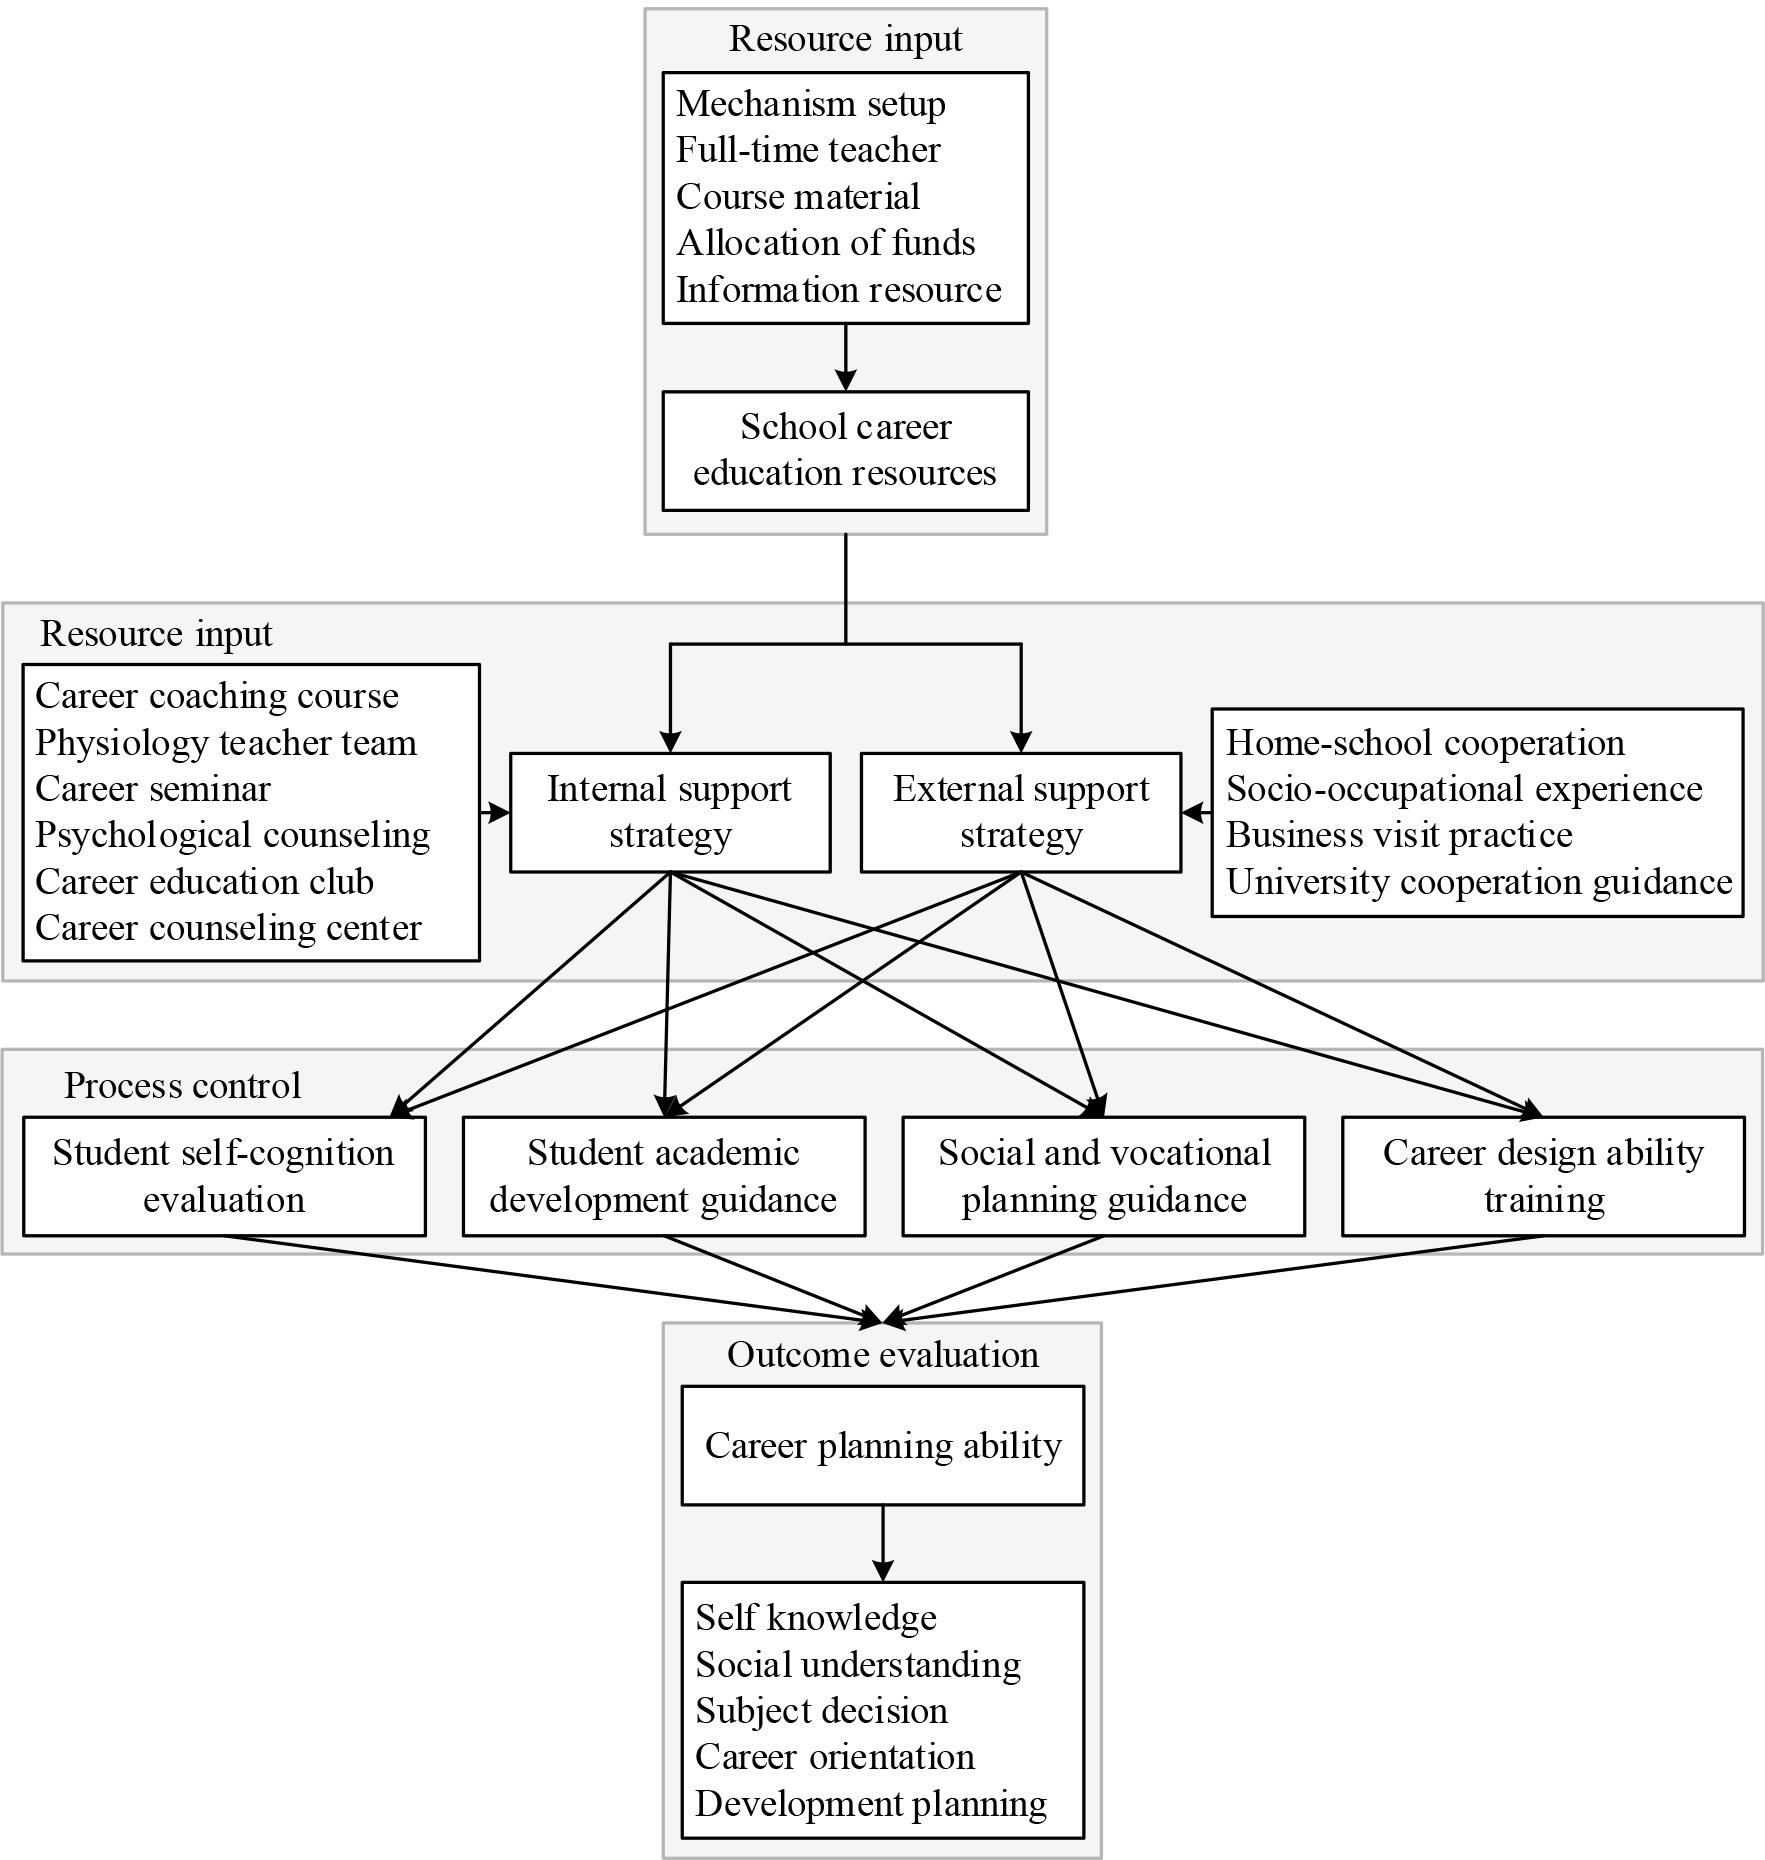
Figure 3.
Results of factor analysis
| Total variance interpretation | |||||||
|---|---|---|---|---|---|---|---|
| Initial eigenvalue | Extracting the load of the load | Component score coefficient | |||||
| Total | Variance% | Cumulate% | Total | Variance% | Cumulate% | ||
| A1 | 2.207 | 78.259 | 78.259 | 2.207 | 78.259 | 78.259 | 0.236 |
| A2 | 0.608 | 10.858 | 89.117 | 0.272 | |||
| A3 | 0.504 | 6.589 | 95.706 | 0.306 | |||
| A4 | 0.477 | 3.498 | 99.204 | 0.237 | |||
| A5 | 0.257 | 0.796 | 100.000 | 0.246 | |||
| B1 | 1.856 | 81.765 | 81.765 | 1.856 | 81.765 | 81.765 | 0.425 |
| B2 | 0.614 | 12.537 | 94.302 | 0.477 | |||
| B3 | 0.251 | 5.698 | 100.000 | 0.403 | |||
| C1 | 2.577 | 79.825 | 79.825 | 2.577 | 79.825 | 79.825 | 0.379 |
| C2 | 0.822 | 7.722 | 87.547 | 0.368 | |||
| C3 | 0.630 | 5.534 | 93.081 | 0.355 | |||
| C4 | 0.559 | 3.564 | 96.645 | 0.348 | |||
| C5 | 0.312 | 2.309 | 98.954 | 0.385 | |||
| C6 | 0.279 | 1.046 | 100.000 | 0.363 | |||
| D1 | 1.778 | 77.547 | 77.547 | 1.778 | 77.547 | 77.547 | 0.389 |
| D2 | 0.875 | 15.348 | 92.895 | 0.436 | |||
| D3 | 0.362 | 7.105 | 100.000 | 0.424 | |||
| E1 | 2.802 | 78.867 | 78.867 | 2.802 | 78.867 | 78.867 | 0.305 |
| E2 | 0.823 | 11.324 | 90.191 | 0.322 | |||
| E3 | 0.555 | 7.339 | 97.530 | 0.341 | |||
| E4 | 0.213 | 2.470 | 100.000 | 0.325 | |||
Regression result of variables
| Nonnormalized coefficient | Normalized coefficient | t | Significance | ||
|---|---|---|---|---|---|
| Standard error | |||||
| Constant | 0.882 | 0.291 | 2.359 | 0.006 | |
| 0.152 | 0.127 | 0.215 | 3.821 | 0.002 | |
| 0.180 | 0.037 | 0.178 | 2.551 | 0.008 | |
| 0.314 | 0.075 | 0.338 | 1.383 | 0.001 | |
| 0.077 | 0.054 | 0.042 | 3.751 | 0.004 | |
| 0.082 | 0.063 | 0.021 | 2.668 | 0.005 | |
| Model | Sum of squares | Df | Mean square | F | Significance |
| Regression | 81.789 | 5 | 17.754 | 26.574 | 0.000 |
| Residual error | 124.726 | 221.479 | 0.301 | ||
| Total | 254.326 | 265.808 | |||
| Adjusted |
S.E. | ||||
| 0.855 | 0.785 | 0.663 | 0.854 | ||
The path coefficient test of the structural equation model
| DV | IV | Estimate | S.E. | P |
|---|---|---|---|---|
| Career education resources | Internal support strategy | 0.206 | 0.064 | ** |
| External support strategy | 0.615 | 0.051 | *** | |
| Internal support strategy | Student self-cognitive evaluation | 0.524 | 0.059 | *** |
| Student development guidance | 0.331 | 0.088 | *** | |
| Social career planning guidance | 0.191 | 0.097 | *** | |
| Career design ability culture | 0.255 | 0.051 | *** | |
| External support strategy | Student self-cognitive evaluation | 0.352 | 0.072 | *** |
| Student development guidance | 0.284 | 0.081 | *** | |
| Social career planning guidance | 0.495 | 0.087 | *** | |
| Career design ability culture | 0.202 | 0.087 | *** | |
| Student self-cognitive evaluation | Career planning ability | 0.529 | 0.091 | *** |
| Student development guidance | 0.448 | 0.066 | *** | |
| Social career planning guidance | 0.527 | 0.053 | *** | |
| Career design ability culture | 0.428 | 0.061 | *** |
Analysis of the model verification factor of the structural equation
| Dimension | Sth | SMC | CR | AVE |
|---|---|---|---|---|
| Career education resources | 0.646~0.869*** | 0.458~0.778 | 0.917 | 0.752 |
| Internal support strategy | 0.663~0.873*** | 0.511~0.861 | 0.851 | 0.678 |
| External support strategy | 0.655~0.903*** | 0.617~0.787 | 0.885 | 0.779 |
| Student self-cognitive evaluation | 0.649~0.916*** | 0.434~0.729 | 0.896 | 0.757 |
| Student development guidance | 0.731~0.883*** | 0.608~0.809 | 0.909 | 0.763 |
| Social career planning guidance | 0.665~0.942*** | 0.569~0.775 | 0.943 | 0.669 |
| Career design ability culture | 0.722~0.929*** | 0.539~0.833 | 0.848 | 0.685 |
| Career planning ability | 0.641~0.849*** | 0.467~0.857 | 0.867 | 0.672 |
The scoring of all elements of the growth path
| Dimension | Mean | S.D. | Difference test | |
|---|---|---|---|---|
| Resource input | Career education resources | 3.356 | 0.903 | F=10.582*** |
| Execution strategy | Internal support strategy | 3.863 | 0.641 | F=8.628*** |
| External support strategy | 3.467 | 0.784 | F= 4.651 | |
| Process control | Student self-cognitive evaluation | 4.283 | 0.814 | F= 5.177*** |
| Student development guidance | 4.072 | 0.533 | F=6.521*** | |
| Social career planning guidance | 3.858 | 0.614 | F=8.169*** | |
| Career design ability culture | 3.663 | 0.573 | F=7.172*** | |
| Result assessment | Career planning ability | 3.325 | 0.765 | F= 2.518*** |