Application of intelligent multi-sensor technology in higher education teaching system
, and
Mar 17, 2025

About this article
Published Online: Mar 17, 2025
Received: Nov 15, 2024
Accepted: Feb 15, 2025
DOI: https://doi.org/10.2478/amns-2025-0207
Keywords
© 2025 Yanbin Liu et al., published by Sciendo
This work is licensed under the Creative Commons Attribution 4.0 International License.
Figure 1.

Figure 2.

Figure 3.
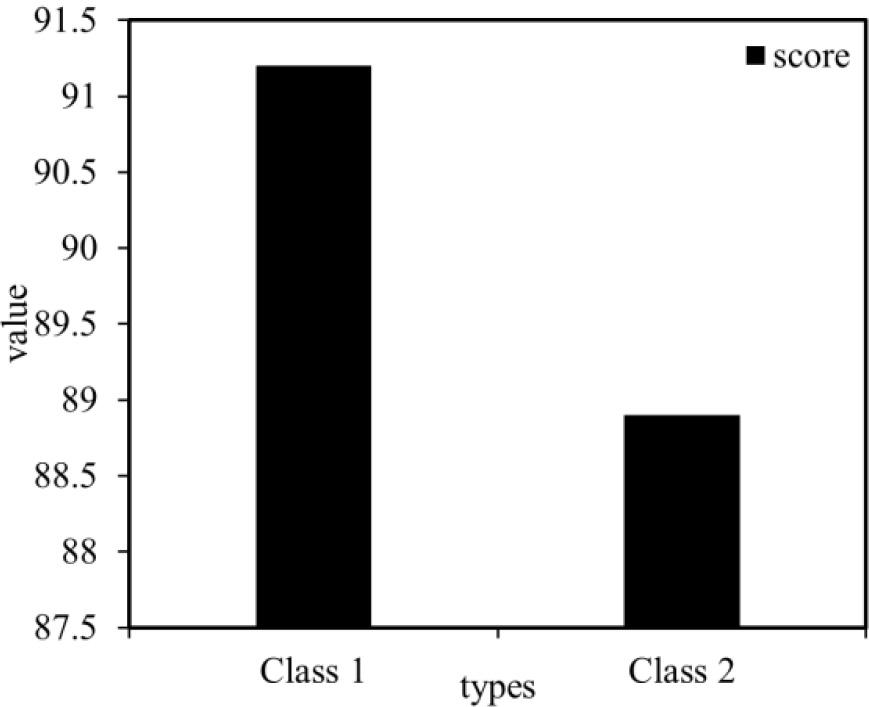
Figure 4.
Figure 5.
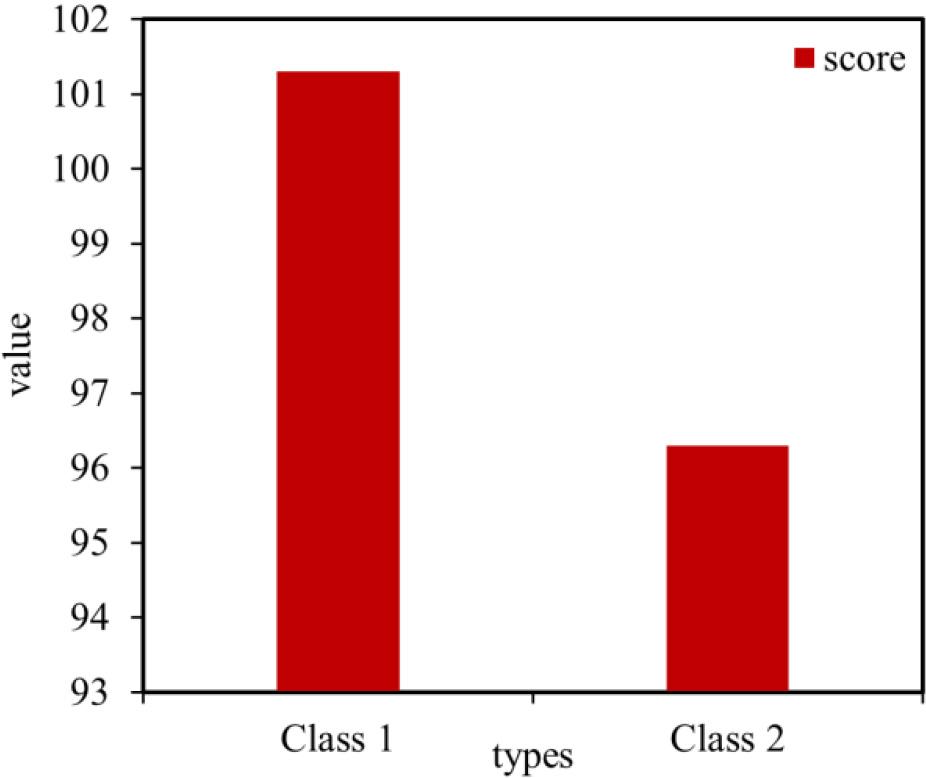
Figure 6.
Figure 7.
Figure 8.
Figure 9.
Figure 10.
T-test for the results of the thorough examination
| class | Class 1 | Class 2 |
|---|---|---|
| N | 50 | 50 |
| mean value | 91.16 | 88.92 |
| standard deviation | 19.485 | 19.176 |
| standard deviation of the mean | 2.784 | 2.712 |
| F | 0.143 | |
| P | 0.706 | |
| Sig. | 0.565 | |
T test for final exam results
| class | Class 1 | Class 2 |
|---|---|---|
| N | 50 | 50 |
| mean value | 101.26 | 96.26 |
| standard deviation | 9.516 | 14.851 |
| standard deviation of the mean | 1.346 | 2.1 |
| F | 7.046 | |
| P | 0.009 | |
| Sig. | 0.048 | |