Application of intelligent multi-sensor technology in higher education teaching system
, y
17 mar 2025

Acerca de este artículo
Publicado en línea: 17 mar 2025
Recibido: 15 nov 2024
Aceptado: 15 feb 2025
DOI: https://doi.org/10.2478/amns-2025-0207
Palabras clave
© 2025 Yanbin Liu et al., published by Sciendo
This work is licensed under the Creative Commons Attribution 4.0 International License.
Figure 1.
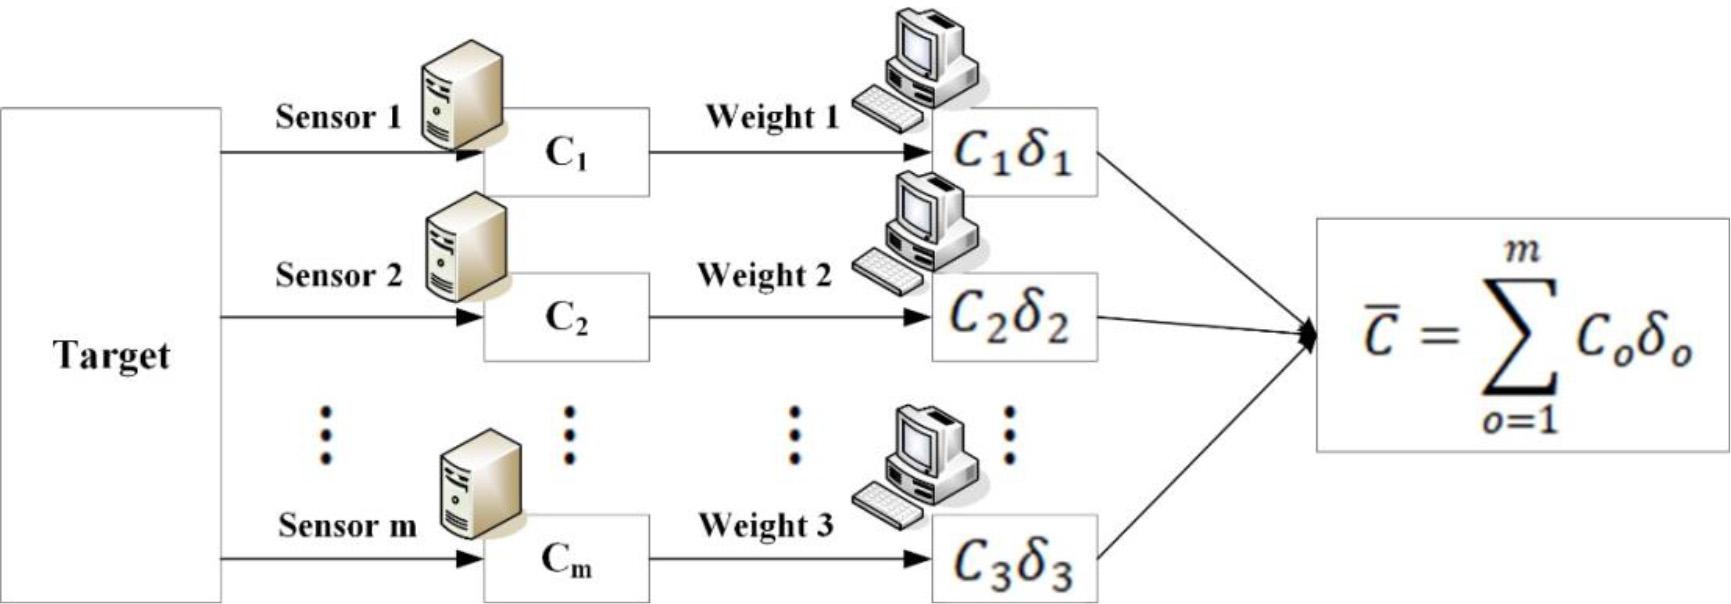
Figure 2.
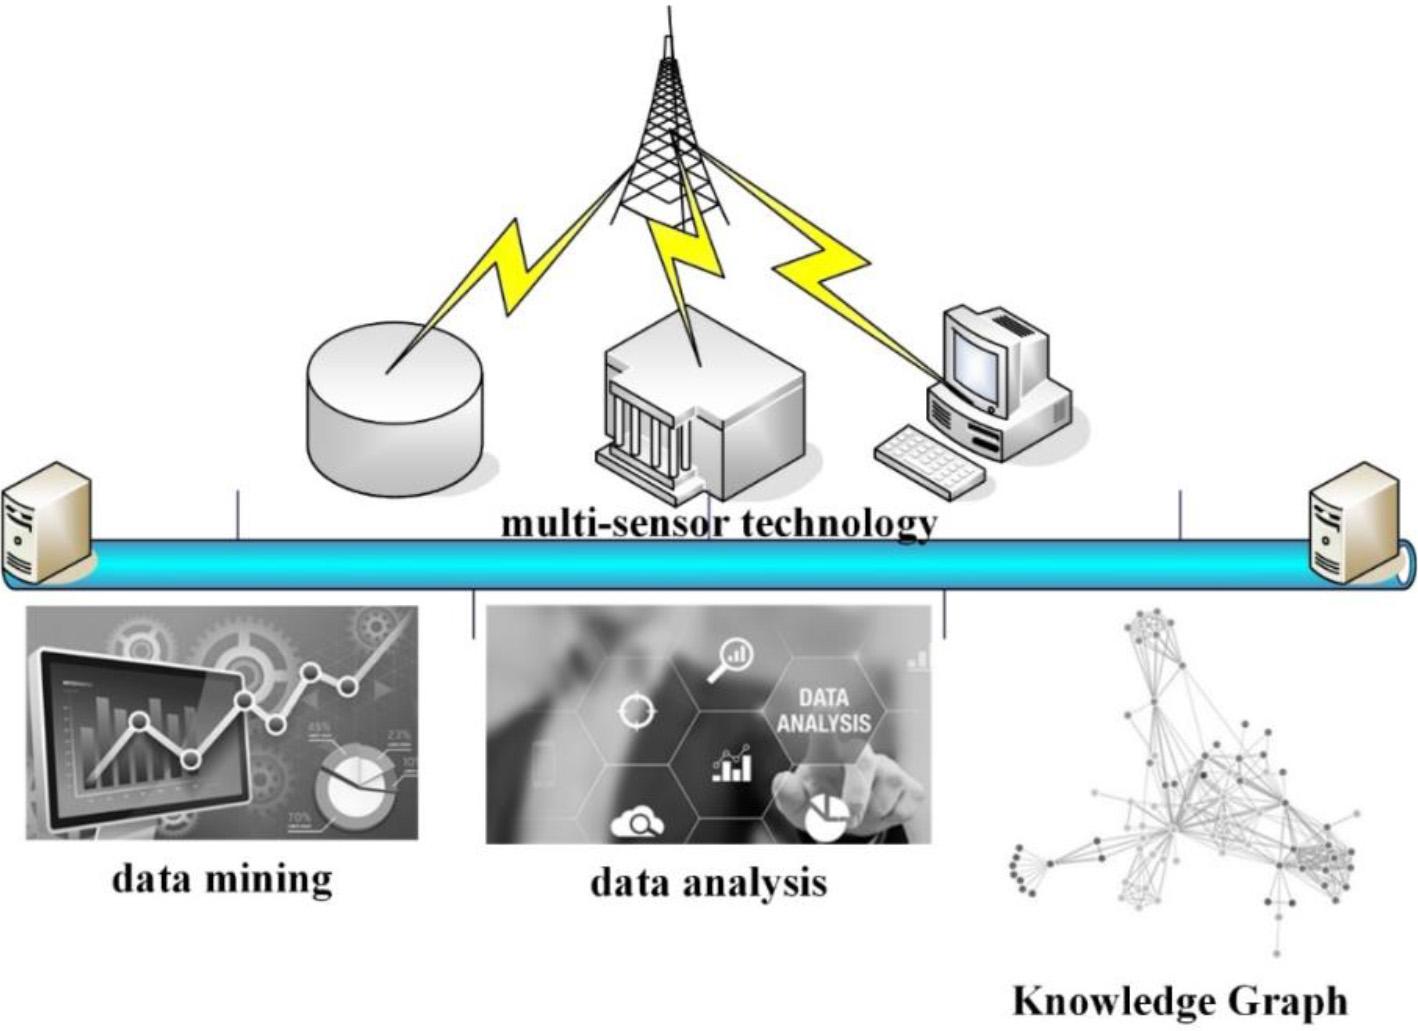
Figure 3.
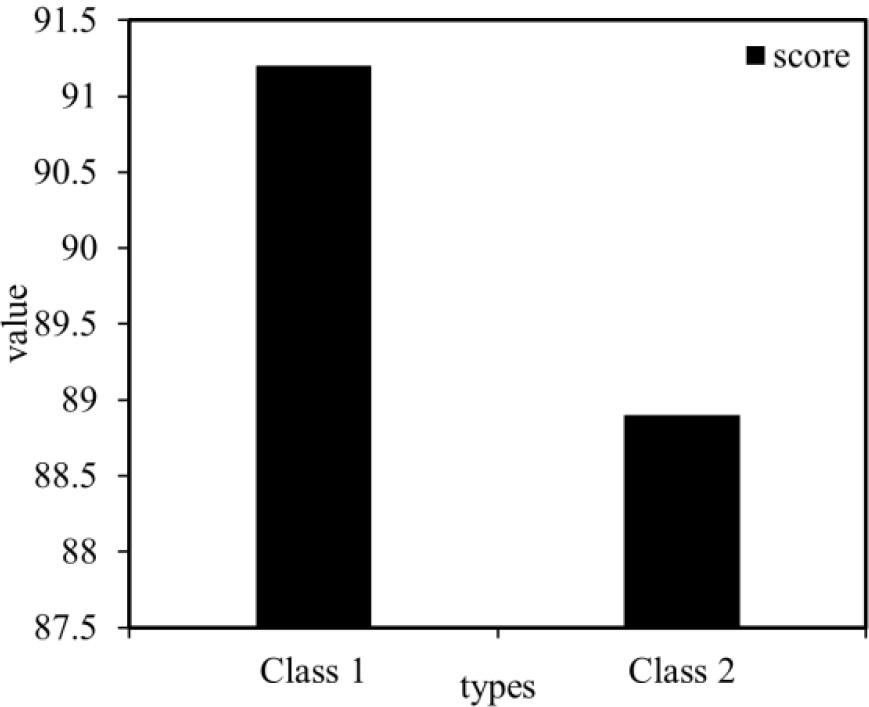
Figure 4.
Figure 5.
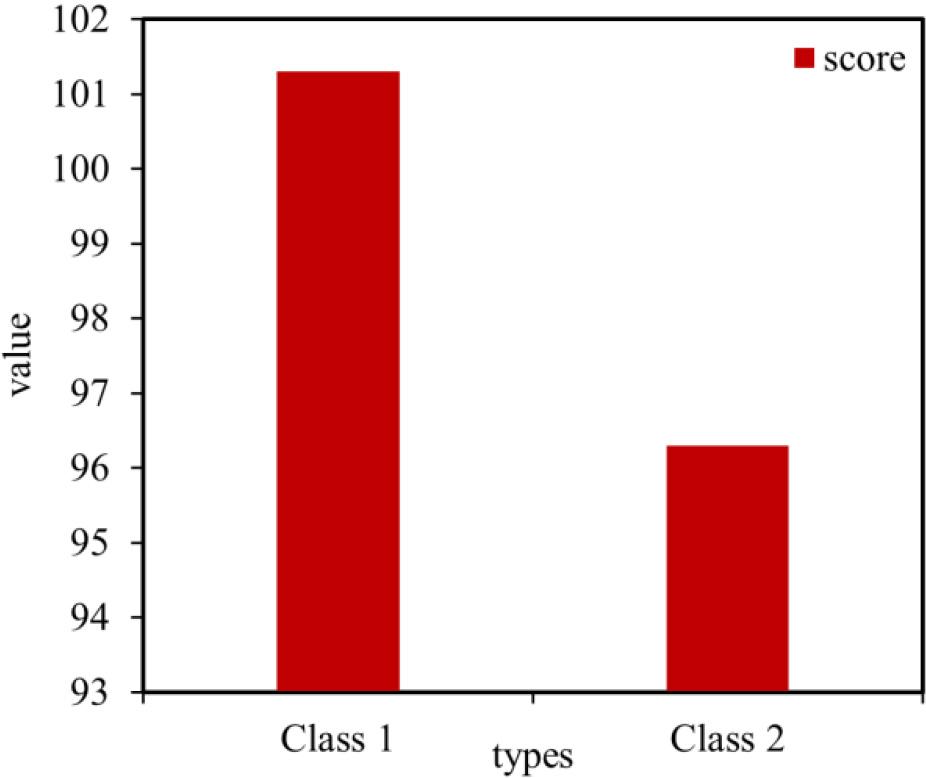
Figure 6.
Figure 7.
Figure 8.
Figure 9.
Figure 10.
T-test for the results of the thorough examination
| class | Class 1 | Class 2 |
|---|---|---|
| N | 50 | 50 |
| mean value | 91.16 | 88.92 |
| standard deviation | 19.485 | 19.176 |
| standard deviation of the mean | 2.784 | 2.712 |
| F | 0.143 | |
| P | 0.706 | |
| Sig. | 0.565 | |
T test for final exam results
| class | Class 1 | Class 2 |
|---|---|---|
| N | 50 | 50 |
| mean value | 101.26 | 96.26 |
| standard deviation | 9.516 | 14.851 |
| standard deviation of the mean | 1.346 | 2.1 |
| F | 7.046 | |
| P | 0.009 | |
| Sig. | 0.048 | |