The Role of Data-Driven Instructional Models in the Development of Students’ Critical Thinking Skills in Core Literacy Education
Mar 17, 2025

About this article
Published Online: Mar 17, 2025
Received: Oct 17, 2024
Accepted: Jan 28, 2025
DOI: https://doi.org/10.2478/amns-2025-0177
Keywords
© 2025 Min Zhang, published by Sciendo
This work is licensed under the Creative Commons Attribution 4.0 International License.
Figure 1.
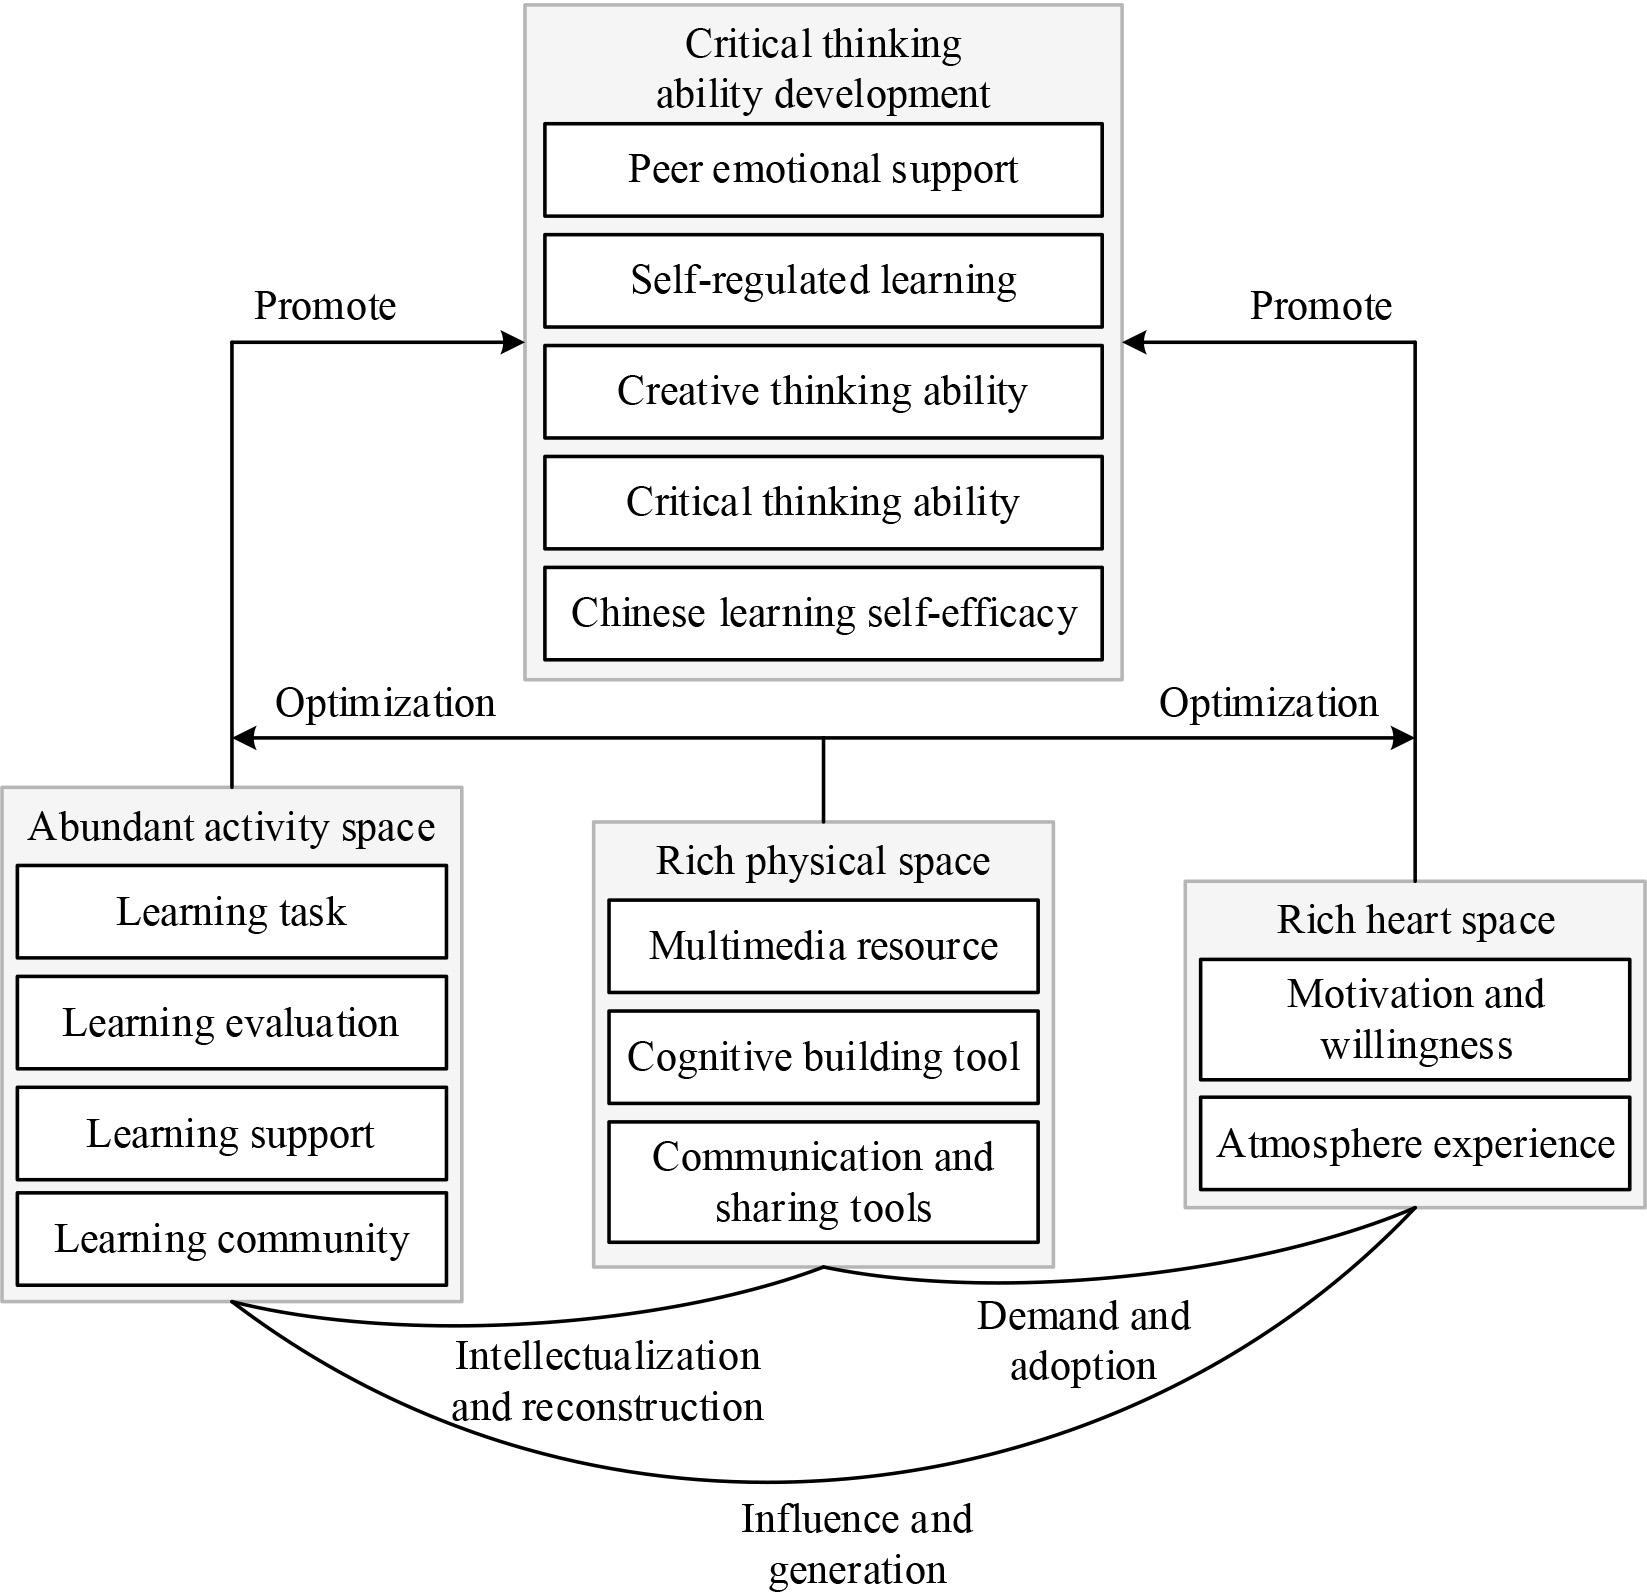
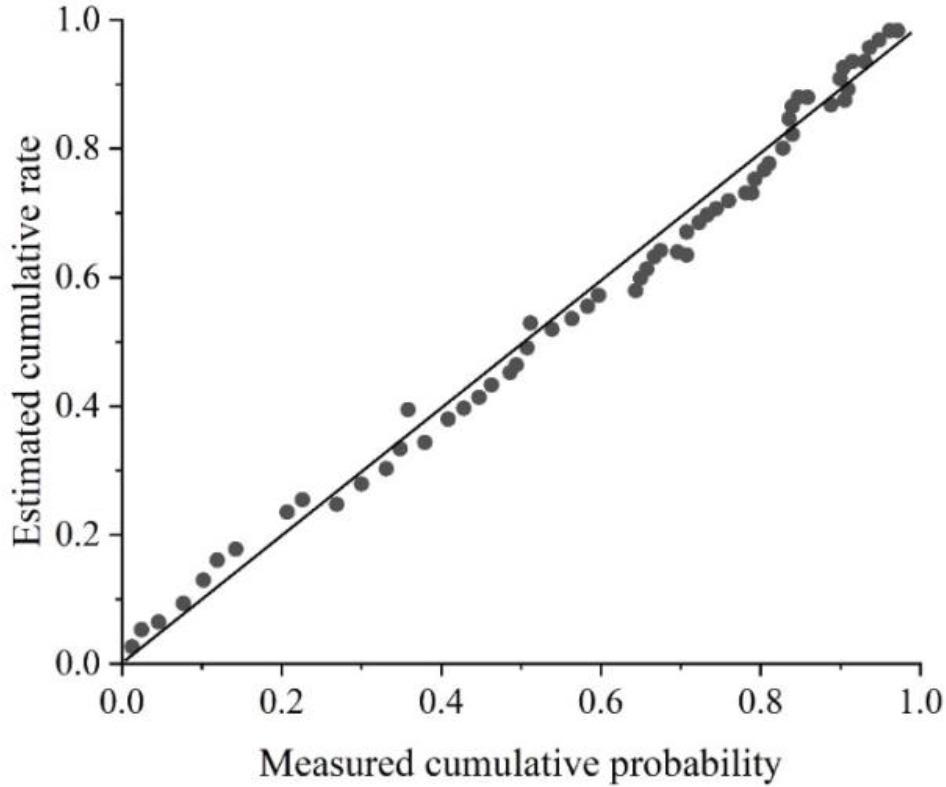
Figure 2.
Data drive teaching mode key elements indicator
| Observation dimension | Observation index |
|---|---|
| Physical space Active space | Multimedia resources |
| Cognitive construction tool | |
| Ac evaluation tool | |
| Observation dimension Physical space Active space | Learning task |
| Learning support | |
| Learning community | |
| Learning evaluation | |
| Observation dimension | Incentive will |
| Atmosphere experience |
The analysis of critical thinking and data driving mode of students
| Project | Open mind | Thirst for knowledge | Cognitive maturity | Systematization | Look for the truth | Analytical ability | Self-confidence | Total score |
|---|---|---|---|---|---|---|---|---|
| Active space | 0.046 | 0.157*** | 0.033 | 0.122** | 0.068 | 0.042 | 0.052 | 0.113** |
| Physical space | 0.017 | 0.176*** | -0.008 | 0.173** | 0.092* | 0.081 | 0.078 | 0.132** |
| Psychological space | 0.041 | 0.174*** | 0.043 | 0.166** | 0.121** | 0.054 | 0.058 | 0.132** |
| Total score | 0.278 | 0.192** | 0.036 | 0.174** | 0.097* | 0.063 | 0.072 | 0.151** |
Overall student statistics
| Categories | Project | N | Percentage(%) |
|---|---|---|---|
| School | Elite school | 78 | 26 |
| Quality | 131 | 43.67 | |
| General | 91 | 30.33 | |
| Gender | Male | 135 | 45 |
| Female | 165 | 55 | |
| Grade | A high | 178 | 59.33 |
| High two | 122 | 40.67 | |
| Home | Countryside | 145 | 48.33 |
| City | 155 | 51.67 | |
| Disciplines | Liberal arts | 198 | 66 |
| Science | 102 | 34 |
University critical thinking is different in gender
| Male(N=35) | Fmale(N=165) | T value | Sig | |||
|---|---|---|---|---|---|---|
| M | SD | M | SD | |||
| Seek the truth | 37.81 | 6.836 | 36.13 | 4.751 | 2.084* | 0.041 |
| Liberation thought | 38.99 | 5.41 | 37.21 | 4.677 | 1.137 | 0.277 |
| Analytical ability | 38.93 | 6.011 | 39.18 | 5.777 | 0.522* | 0.639 |
| systematization | 35.75 | 4.863 | 36.02 | 4.712 | .344 | 0.769 |
| self-confidence | 38.91 | 6.398 | 36.11 | 5.493 | 2.566* | 0.011 |
| Thirst for knowledge | 39.85 | 5.675 | 41.42 | 6.576 | -1.349 | 0.16 |
| Cognitive maturity | 35.95 | 7.004 | 38.21 | 5.863 | -2.441* | 0.011 |
| Total score | 266.19 | 35.21 | 264.28 | 27.212 | -.431 | .598 |
Students’ critical thinking majors
| Science(N=102) | Liberal arts(N=198) | T value | Sig | |||
|---|---|---|---|---|---|---|
| M | SD | M | SD | |||
| Seek the truth | 37.12 | 6.845 | 35.84 | 5.648 | 2.145* | 0.041 |
| Liberation thought | 38.36 | 5.879 | 37.64 | 5.267 | 1.137 | 0.077 |
| Analytical ability | 39.69 | 6.711 | 38.44 | 6.171 | 2.084* | 0.039 |
| systematization | 36.08 | 5.715 | 35.84 | 5.071 | 1.123 | 0.169 |
| self-confidence | 36.56 | 7.313 | 37.84 | 5.857 | -.566 | 0.011 |
| Thirst for knowledge | 41.16 | 7.56 | 40.26 | 6.253 | 1.441 | 0.061 |
| Cognitive maturity | 38.12 | 7.878 | 37.27 | 6.185 | 1.349 | 0.076 |
| Total score | 267.09 | 25.421 | 263.13 | 32.534 | 1.898* | 0.018 |
The dimensions of each dimension and the percentage of critical thinking
| Project | Score(score, |
Each dimensional score distribution [n(%)] | |||
|---|---|---|---|---|---|
| Negative thinking(≤30 score) | Ambiguity(31~39 score) | Positive thinking(≥40 score) | Positive thinking(≥50 score) | ||
| Seek the truth | 43.25±6.09 | 32(18.2) | 48(31.2) | 78(49.3) | 11(6.2) |
| Liberation thought | 51.45±2.99 | 4(2.1) | 37(24.2) | 115(71.3) | 11(6.2) |
| Analytical ability | 51.24±1.13 | 4(2.1) | 48(31.2) | 97(62.1) | 16(9.6) |
| systematization | 48.26±2.56 | 11(6.3) | 67(42.7) | 78(49.3) | 11(6.2) |
| self-confidence | 43.52±5.72 | 22(12.2) | 79(48.51) | 61(38.3) | 9(5.8) |
| Thirst for knowledge | 52.23±5.28 | 6(2.3) | 46(38.5) | 82(51.3) | 35(21.4) |
| Cognitive maturity | 48.94±3.26 | 17(10.2) | 51(30.2) | 89(56.4) | 13(7.8) |
| Total score | 293.14±30.6 | 0(0.0) | 67(42.8) | 96(52.9) | 4(2.1) |
Colinear diagnosis
| Dimension | Eigenvalue | Conditional index | Common linear statistics | |
|---|---|---|---|---|
| Authorized value | Coefficient of variance expansion | |||
| 1 | 0.012 | 19.231 | 0.523 | 1.231 |
| 2 | 0.031 | 17.452 | 0.532 | 1.892 |
| 3 | 0.022 | 19.224 | 0.611 | 1.593 |
Regression analysis
| Model | Non-standard error factor | Standard coefficientBeta | T | significance | |
|---|---|---|---|---|---|
| B | Standard error | ||||
| Constants | 1.088 | 0.142 | 8.314 | <0.001 | |
| Active space | 0.182 | 0.041 | 0.232 | 5.232 | <0.001 |
| Physical space | 0.145 | 0.038 | 0.193 | 5.088 | <0.001 |
| Psychological space | 0.121 | 0.036 | 0.095 | 3.145 | 0.032 |
| R2 | 0.296 | ||||
| F | 53.052 | ||||
| P | <0.001 | ||||
| Dependent variables: the total score of critical thinking in students | |||||