A study on the effect of physical education content adjustment on students’ physical fitness based on data analysis
and
Mar 17, 2025

About this article
Published Online: Mar 17, 2025
Received: Oct 20, 2024
Accepted: Feb 14, 2025
DOI: https://doi.org/10.2478/amns-2025-0171
Keywords
© 2025 Xiaojing Yang et al., published by Sciendo
This work is licensed under the Creative Commons Attribution 4.0 International License.
Figure 1.
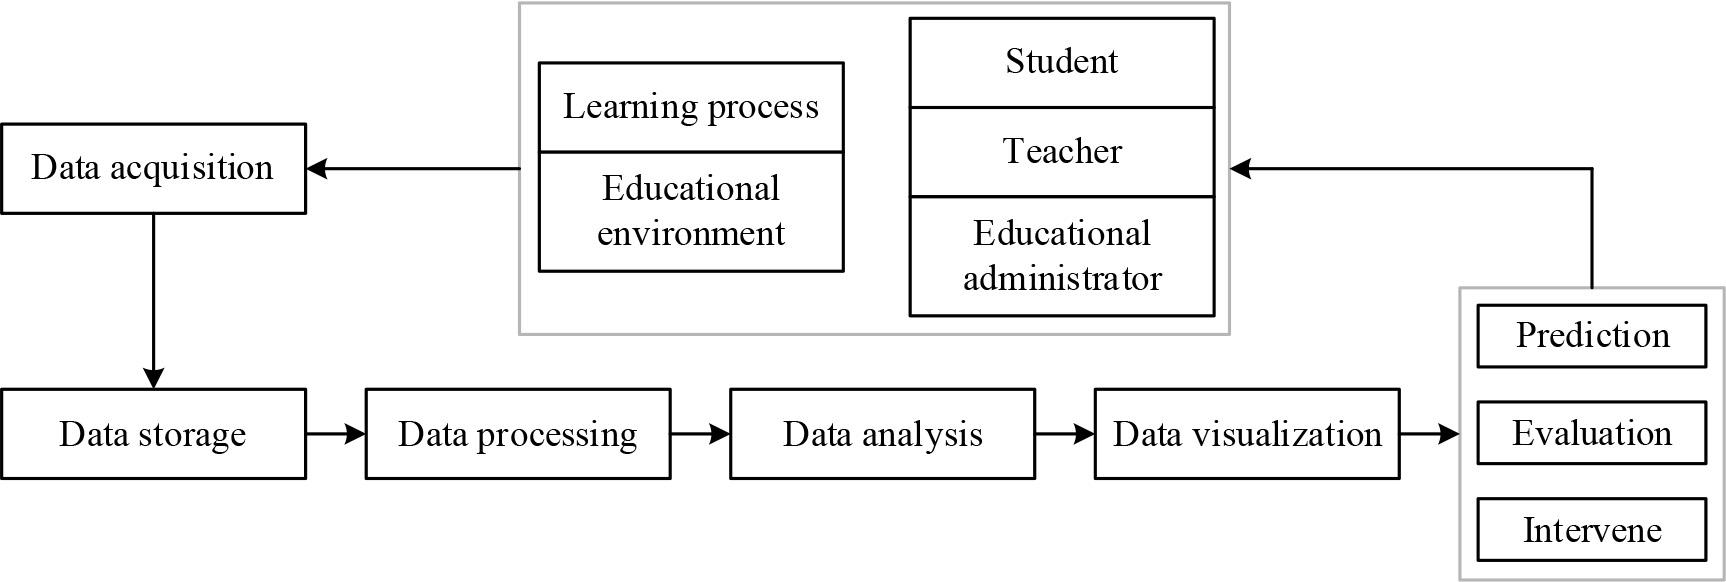
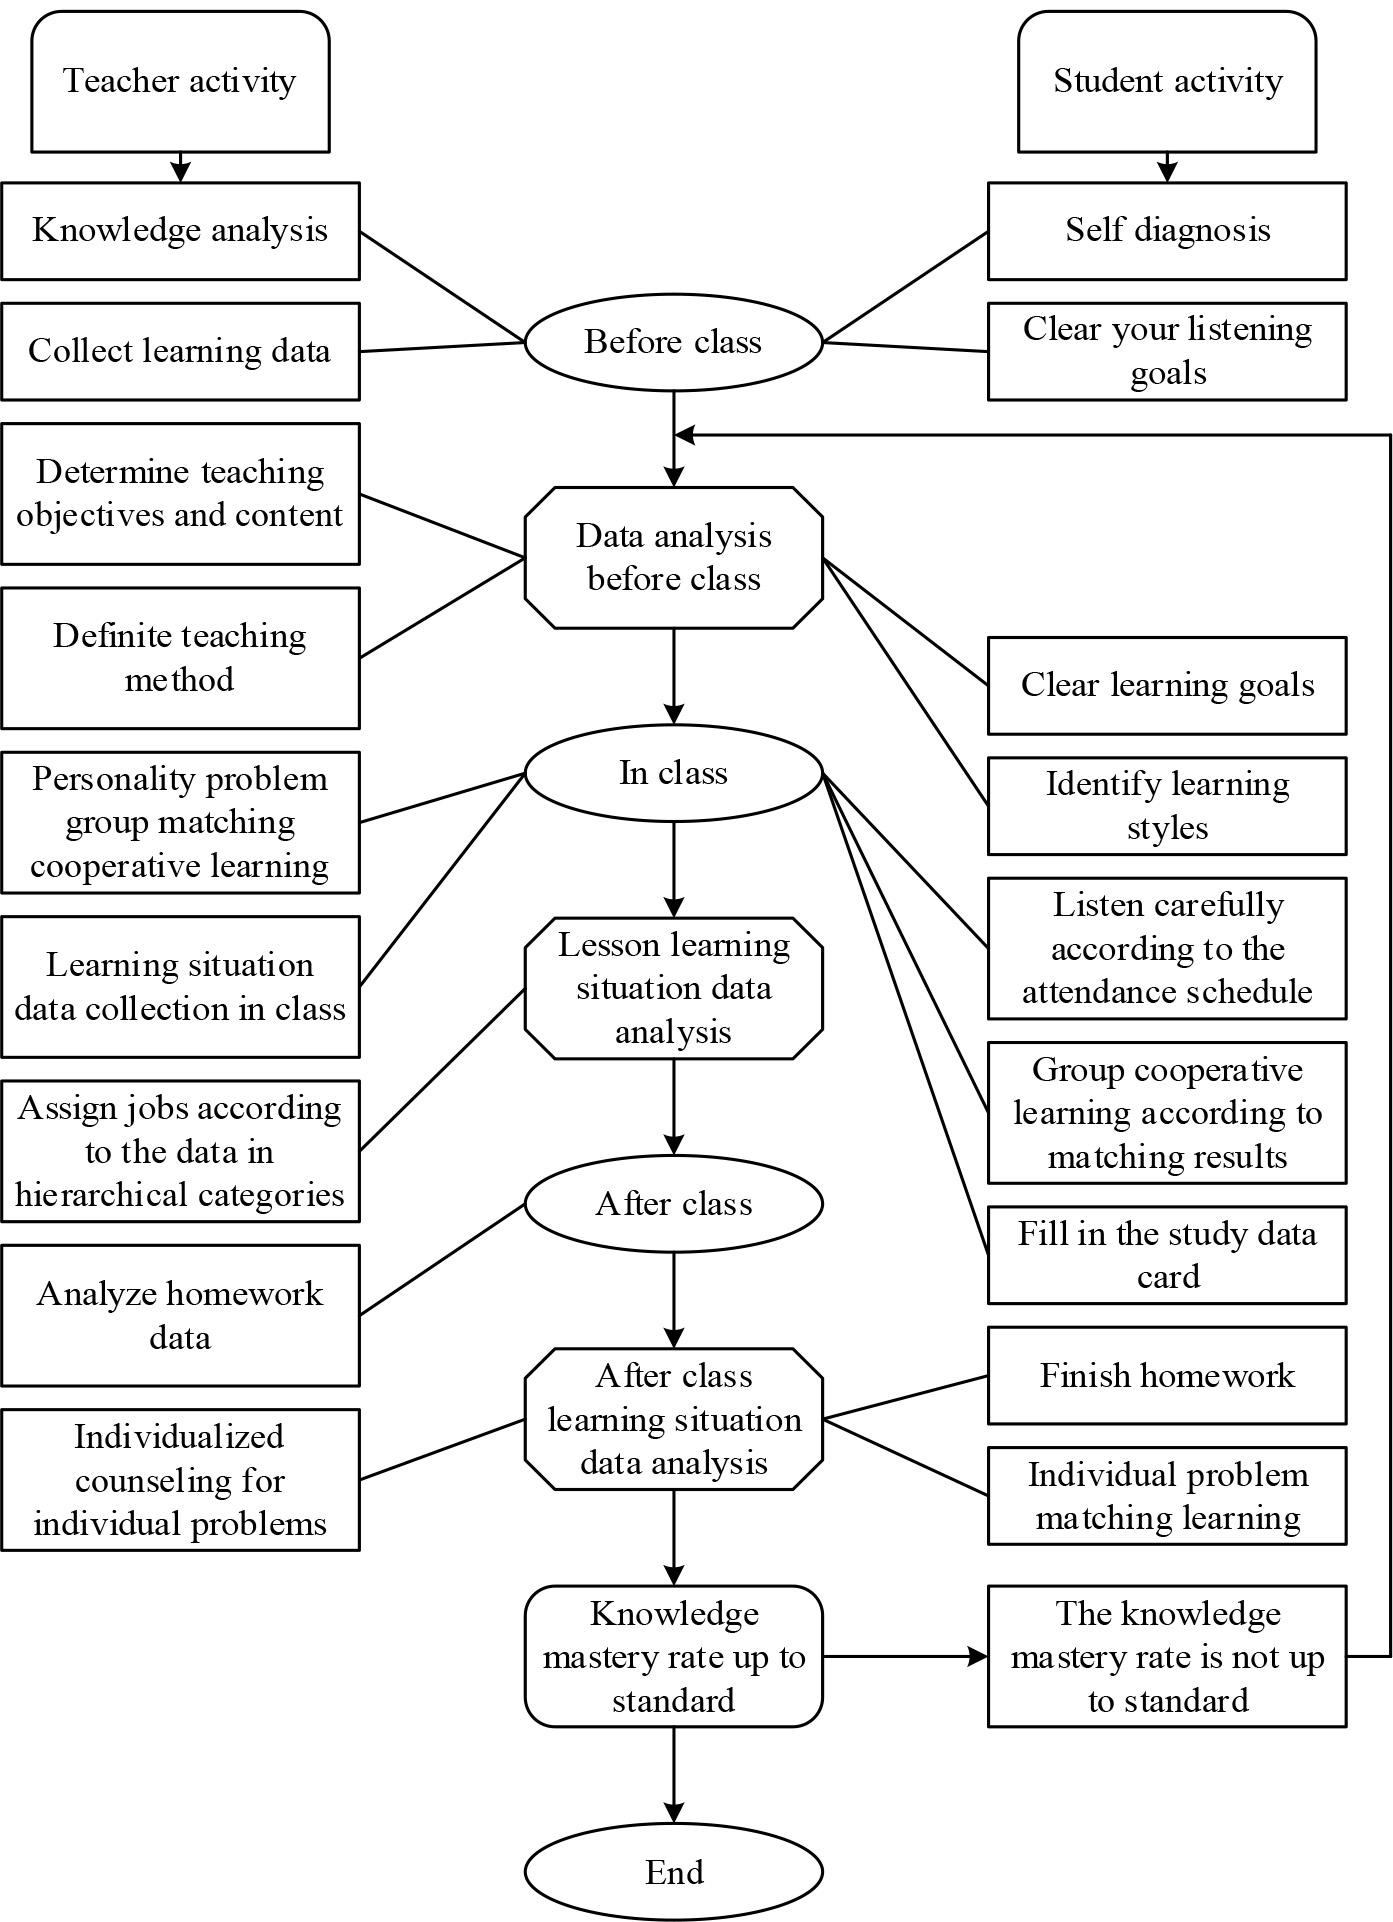
Figure 2.
Student health test results
| variable | Class | Time | Time factor | Intervention condition | Interaction term | ||||
|---|---|---|---|---|---|---|---|---|---|
| Before | After | F | P | F | P | F | P | ||
| Speed | Laboratory | 27.15±2.85 | 30.25±3.45 | 25.657 | 0.012 | 15.123 | 0.000 | 6.523 | 0.000 |
| Cross-reference | 26.95±2.56 | 27.15±2.11 | |||||||
| Endurance | Laboratory | 22.65±3.15 | 26.15±3.42 | 4.815 | 0.000 | 14.352 | 0.000 | 15.185 | 0.032 |
| Cross-reference | 22.55±2.35 | 21.85±3.22 | |||||||
| Flexibility | Laboratory | 17.15±2.15 | 20.23±2.65 | 12.854 | 0.015 | 11.115 | 0.002 | 6.038 | 0.001 |
| Cross-reference | 17.15±2.68 | 17.16±2.68 | |||||||
| Power | Laboratory | 17.52±4.15 | 23.68±3.98 | 30.152 | 0.000 | 43.242 | 0.000 | 22.341 | 0.000 |
| Cross-reference | 16.68±3.15 | 17.11±3.11 | |||||||
The previous data of the three sets of class sports results
| Group | Class | Mean | Maximum | Minimum | High rate | Excellence rate | Good rate | Rate of conformity | Pending rate | Standard deviation |
|---|---|---|---|---|---|---|---|---|---|---|
| A | Laboratory | 83.68 | 100 | 75 | 21% | 33% | 31% | 15 | 12.35% | 15.66 |
| Cross-reference | 84.56 | 100 | 73 | 22% | 34% | 30% | 14% | 11.52% | 16.58 | |
| B | Laboratory | 79.56 | 100 | 70 | 11% | 8% | 37% | 44% | 20.08% | 18.24 |
| Cross-reference | 80.33 | 100 | 71 | 12% | 8% | 37% | 43% | 18.54% | 16.77 | |
| C | Laboratory | 70.15 | 100 | 65 | 2% | 6% | 35% | 37% | 21.11% | 18.32 |
| Cross-reference | 71.23 | 100 | 65 | 3% | 7% | 34% | 56% | 16.23% | 17.52 |
The results of the group A
| Class | Examination | Mean | Excellence rate | Good rate | Rate of conformity | Low rate(%) | Standard deviation |
|---|---|---|---|---|---|---|---|
| Cross-reference class | Midterm | 87.56 | 0.33 | 0.38 | 0.29 | 5.25 | 14.25 |
| Final examination | 92.12 | 0.30 | 0.40 | 0.30 | 0.00 | 10.12 | |
| Laboratory class | Midterm | 82.35 | 0.15 | 0.50 | 0.35 | 4.89 | 12.85 |
| Final examination | 96.75 | 0.35 | 0.25 | 0.10 | 0.00 | 10.45 |
The results of the group B
| Class | Examination | Mean | Excellence rate | Good rate | Rate of conformity | Low rate(%) | Standard deviation |
|---|---|---|---|---|---|---|---|
| Cross-reference class | Midterm | 85.23 | 0.14 | 0.33 | 0.53 | 25.53 | 15.53 |
| Final examination | 87.12 | 0.20 | 0.40 | 0.40 | 2.68 | 13.35 | |
| Laboratory class | Midterm | 80.13 | 0.15 | 0.45 | 0.40 | 10.21 | 11.36 |
| Final examination | 90.23 | 0.30 | 0.40 | 0.30 | 0.00 | 12.38 |
The results of the group C
| Class | Examination | Mean | Excellence rate | Good rate | Rate of conformity | Low rate(%) | Standard deviation |
|---|---|---|---|---|---|---|---|
| Cross-reference class | Midterm | 70.56 | 0.9 | 0.37 | 0.54 | 19.02 | 15.20 |
| Final examination | 83.66 | 0.14 | 0.35 | 0.51 | 1.12 | 14.98 | |
| Laboratory class | Midterm | 78.68 | 0.10 | 0.41 | 0.49 | 0.00 | 6.58 |
| Final examination | 87.62 | 0.28 | 0.40 | 0.32 | 0.00 | 14.35 |