A study on the effect of physical education content adjustment on students’ physical fitness based on data analysis

Published Online: Mar 17, 2025
Received: Oct 20, 2024
Accepted: Feb 14, 2025
DOI: https://doi.org/10.2478/amns-2025-0171
Keywords
© 2025 Xiaojing Yang et al., published by Sciendo
This work is licensed under the Creative Commons Attribution 4.0 International License.
Physical fitness is an important part of China’s health, and the physical fitness level of young people is directly related to the development of society and the future of the country. The data released by China’s Ministry of Education on the changes in students’ physical fitness in the past 30 years show that college students show a continuous downward trend in various indicators such as endurance, explosive strength, speed and power, and the physical fitness and health of college students is not optimistic [1-2]. In this context, the introduction of big data analysis and assessment diagnosis, combined with the reform of physical education teaching and research on strategies to improve the physical health of college students, has important practical value.
In the study of big data in college sports, the monitoring and assessment of students’ physical health is an important aspect, which can be comprehensively and systematically monitored and assessed through big data technology [3-4]. In terms of collection, the monitoring of students’ physical health includes the measurement of various indicators of students’ bodies, such as height, weight, lung capacity, heart rate, blood pressure, etc. Relevant data are collected through professional testing equipment and uploaded to the big data platform [5-7]. For assessment, based on the monitoring data, the physical health status of students is analyzed [8]. Comparisons and analyses can be made between groups of different grades, majors, and genders to understand the strengths and weaknesses of students in physical fitness and health and to provide a basis for the development of personalized physical education programs [9-11]. It can also monitor the trend of students’ physical fitness and health changes and discover the changing law of students’ physical fitness and health through long-term data accumulation and analysis [12-14]. Taken together, the use of big data technology to adjust physical education strategies in a timely manner can effectively improve the overall physical health of students.
Physical activity is an important safeguard factor for personal health, as well as an important supplement after physical education classes and an important extension of physical exercise [15]. Wang, J. empirically analyzed the relationship between physical fitness and physical activity among college students and found that although they had the same physical fitness test scores, college students who were actively involved in sports had better physical performance compared to those who were more physically active [16]. Bharti, J. et al. Explained the benefits and importance of sports. Active sports not only promote students’ physical health but also help to develop their social skills and psychological skills [17]. Yang, Y. showed that a sedentary lifestyle and poor dietary habits lead to physical and psychological deficiencies in college students and that involving college students in physical fitness training can effectively stimulate their interest in sports to improve their physical health and promote their psychological development [18]. Wang, J. et al. studied the effect of physical fitness training on college students’ physical fitness and set up a control test to evaluate the physical fitness indexes of college students participating in the study, and the results showed that physical fitness training can significantly improve and strengthen students’ physical fitness [19]. It can be found that the physical health of college students at this stage is not optimistic. Colleges and universities should vigorously carry out sports activities so that students can allocate more exercise time while paying attention to the cultural curriculum and cultivate students’ habits of physical exercise, which is conducive to the improvement of college students’ physical health.
Student physical fitness monitoring is an important indicator for evaluating the physical education teaching effect of a college and the physical fitness of the students in that college [20]. Sun, W. et al. proposed an adaptive federal deep learning algorithm and set up a quantitative evaluation framework of college students’ sports skills to analyze and predict the sports immersion of college students, and the experiments showed that the proposed model has a high accuracy rate and better reflects the training effect of the students [21]. Dong, X. combined information technology with physical education and proposed to establish a big data-embedded college sports information system to rationally arrange students’ sports training methods based on the results of big data analysis, in order to better improve students’ sports skills training effects and meet the social demand for highly skilled sports talents [22]. Zeng, W. et al. conducted a study on the application of big data in higher physical education Zeng, W. et al. conducted a study on the application of big data in higher physical education, analyzed the physical health data of college students participating in the study by clustering, and used it as the basis to open teaching courses to change the students’ physical defects, and adjusted the teaching content through the cyclic mode of “experimental feedback experiments” to improve the students’ health level significantly [23]. Yang, S. et al. grouped the experimental subjects according to male and female genders, extracted their physical characteristics using the K-means algorithm, carried out cluster analysis, and provided them with personalized exercise suggestions in physical education courses, aiming to better improve and promote the physical health of college students [24]. Therefore, the timely use of big data technology to organize and analyze the results of students’ physical fitness tests and use the results of the physical fitness test as a basis for guiding students to carry out physical exercise and optimizing the physical education curriculum can significantly improve the pass rate of college students’ physical fitness indicators.
Educational information technology is a significant feature of educational modernization, and in the era of modern education, educational data analysis still plays an important role in the development and improvement of teaching. This paper explores the application method of data analysis technology in physical education teaching to realize the adjustment and optimization of physical education teaching content. Starting from the needs of actual physical education teaching, it proposes an accurate adjustment strategy for physical education teaching based on data analysis and establishes the process path for its implementation. Then, through teaching practice, study the impact of this paper’s adjustment of sports precision teaching on students’ physical fitness and verify the impact of this paper’s adjustment of sports teaching content.
The key technology process of data analysis is shown in Figure 1. Big data-related technologies are tightly focused on data, and the key technologies of data analysis mainly include data acquisition, pre-processing, storage, processing, analysis and mining, visualization and other technologies, which is a comprehensive, complete and interlocking process. When data technology is applied to physical education, it is not necessary to use all the technologies, but rather, the appropriate technology should be selected according to the application needs, data scale, and technical strength so that the data can generate value for educators, learners, parents, and administrators.
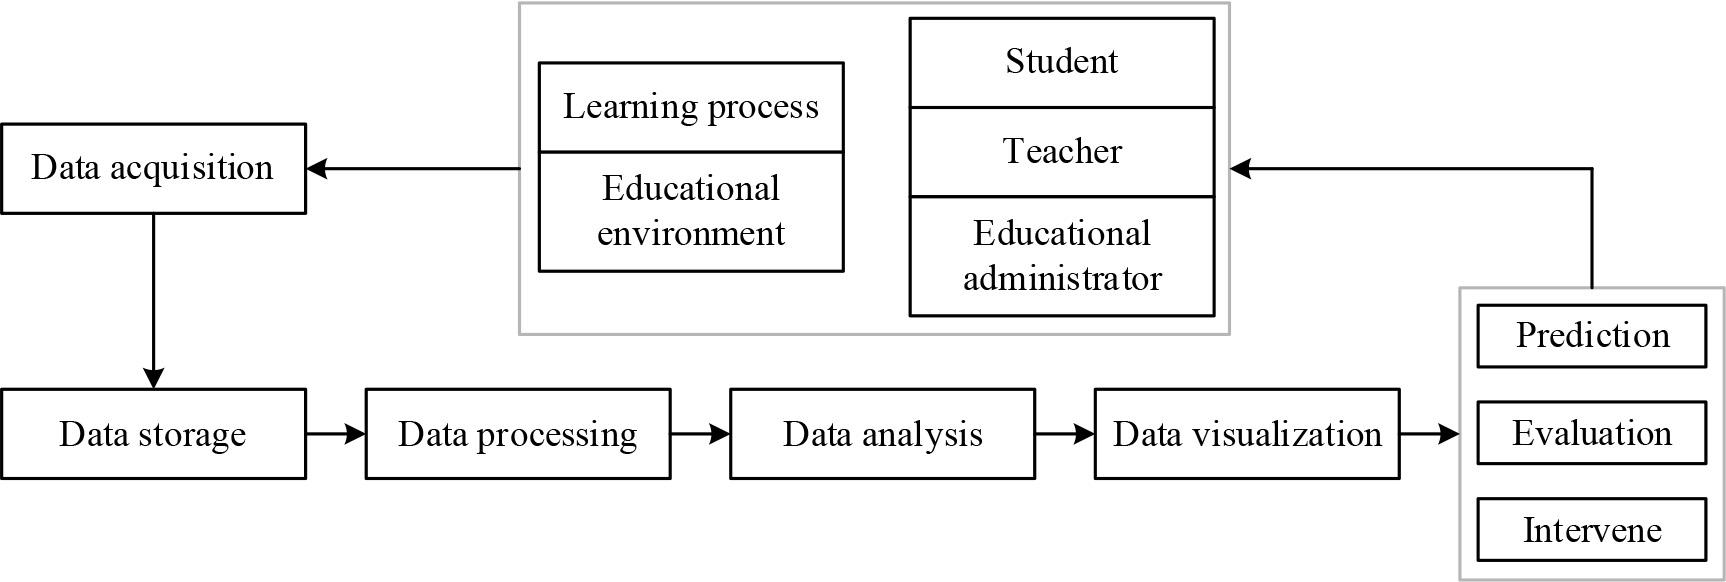
Key technical process model for data analysis
Data collection is the first part of the entire data technology process, and the scope and quality of the data collected in physical education directly affect the subsequent use of the data. Data collection is the act of using different data collection methods to gather and combine data into a big data storage and processing platform.
Data storage is the process of storing a massive amount of data that is collected automatically. Storing data on a reliable medium prevents loss and facilitates access at any time. There are two ways of storing data: either the data is automatically stored in the storage server acquired by the kindergarten, or it is uploaded to the cloud for cloud storage. In this paper, the data support for physical education uses cloud storage to virtualize the storage device, which is cost-effective and does not have high fixed costs, and authorized users can access and retrieve the data according to their needs.
Data processing is the process of further calculating and processing the stored data as required. The commonly used data processing methods are sorting, aggregation, grouping, filtering, correlation, etc.
Data analysis is done after data collection, storage, and processing. Data analysis is the process of processing data using appropriate algorithms and statistical analysis to convert it into useful information. Due to the huge amount of data and the large amount of data generated every moment, in order to facilitate the application and analysis of the user, the physical education management system can provide daily, weekly, monthly, quarterly, yearly and other analysis cycles. Teachers can independently choose the analysis cycle, querying and analyzing the relevant data.
Data visualization through the use of computer technology, data can be converted into images or graphics presented on the screen, not only to facilitate the user’s intuitive access to information but also to greatly reduce the difficulty of the application of big data so that users can quickly find the key points.
Data mining is a research field that integrates many disciplines and mainly contains research on new technologies such as database system information technology, artificial intelligence, machine learning, mathematical statistics, learning technology, object-oriented technology, information retrieval, high-performance computing technology and visualization technology. Data mining algorithms include statistical analysis, clustering algorithms, association algorithms, decision tree algorithms, and others.
Statistical analysis
Statistical analysis refers to the use of statistical analysis methods and data analysis-related expertise in a close combination of quantitative and qualitative scientific research activities. This is a very important work following the statistical design, statistical surveys, and data integration, it is based on the previous stages of work through the analysis of big data and to obtain a more in-depth understanding of the subject of the survey. That is, a large amount of information is summarized to calculate the meaning of the most common analysis, generally variance, maximum value, minimum value, summing and other single data representation, in addition to diversified data analysis such as correlation analysis, regression analysis, factor analysis, principal component analysis and so on.
Principal Component Analysis (PCA) is a class of dimensionality reduction analysis methods that significantly improve the efficiency of unsupervised learning. It turns multiple parameters into a few primary components that are linear compositions of the initial data, uncorrelated with each other, but still convey all the circumstances of the initial data.
The basic idea of principal component analysis:
Assuming
Suppose one wants to find a new set of variables
In the mathematical model of principal component analysis:
The coefficient
By analogy,
The new variable index
Factor analysis is a multivariate statistical analysis that identifies the potential elements (common factors) that are implicit in the data of each factor, that cannot be obtained by observation, but that control the observable factors, and that predicts the degree to which the potential elements contribute to the measurable factors and their relationship to the potential factors. In essence, factor analysis is a dimensionality-reducing idea, using as few single factors as possible to describe the vast majority of the original factors.
The mathematical model of factor analysis
The above equation is also a model for factor analysis, which is able to be expressed in matrix form as follows:
Where
The basic idea of factor analysis is to find a few public variables
The variance contribution
The closer the value of
Factor loading
Common Degree of All Variables
Cluster Analysis
Cluster analysis is the process of dividing a set of datasets into different categories according to some similarity function or similarity rule. These categories are called classes. The similarity of object attributes in the same class is high, and the difference of object attributes in different classes is more obvious. Generally, by comparing the degree of similarity (degree of difference) of the attribute values of the sample data to determine whether the different data are in the same class, in cluster analysis, it is usually necessary to calculate the distance between the values of each attribute, if the distance is less than a set threshold, the sample data are divided into the same class, and if the distance exceeds the set threshold, the data are divided into other different classes. The distance is usually calculated using the Ming’s distance, which is given by the formula:
When
When
When
Where
In addition, the commonly used distances include the Mahalanobis distance, Ming’s distance, Lang’s distance and so on.
The clustering algorithm is an analytical method to study the problem of “clustering”. It can be all the sample data, in the absence of “a priori knowledge” of the preconditions for statistical characteristics, according to its “affinity” in the characteristics of the automatic classification, and so that the structure of the individuals within the group and the characteristics of the existence of a great deal of similarity between. Clustering algorithms include the K-means algorithm, systematic clustering algorithm, and so on.
Correlation Analysis
Correlation analysis is to find the latent correlation between things from complicated data, and correlation rules can express this correlation. The main purpose of association analysis is to find out the relationships and rules between events and to correlate them. Common association analysis techniques include the Apriori algorithm, sequence association algorithm, and so on.
Decision Tree Algorithm
Decision trees are a very common type of analysis that requires supervised learning. Supervised learning is usually given a sample of samples, each of which has an attribute and an analysis, and if the analysis is known, then learning can be used to derive a decision tree from these samples, by which new data can be analyzed sensibly.
Precision teaching theory, through the practice of different scholars’ research, produced a variety of different understandings. As of now there is no uniform definition and definition. This paper summarizes that precision teaching is an educational theory, teaching methods, and teaching mode. The precision teaching studied in this paper is to realize the precise adjustment of physical education teaching content, to improve the high degree of matching between students’ needs and teachers’ teaching, so as to improve the efficiency of physical education classrooms and the higher the degree of matching, the better the classroom effect. On the basis of data analysis of the various aspects of student learning data collection, and through the analysis of the collected data so as to accurately adjust and improve the content of physical education teaching and teaching methods, to carry out precision teaching.
The process of achieving precise teaching of physical education based on data analysis is shown in Figure 2, and most schools across the country are now equipped with various data collection and analysis systems. The precise adjustment of physical education teaching based on data analysis refers to the teaching method of precise teaching through the design of data collection, data analysis strategy, and decision-making based on data analysis with the help of an educational data analysis system and the adjustment and optimization of physical education teaching content through teaching feedback and analysis.

Based on data analysis, the implementation process of the precise teaching of sports
Precise adjustments to physical education teaching based on data analysis should first make it clear that students are the main focus of learning and the center of teaching design for content adjustment in physical education. Students can truly master knowledge and skills only when they experience the learning process and take the initiative. Teachers’ teaching design stands in the students’ perspective so that students can play the subjectivity and initiative of learning, provide a learning environment that can realize the students’ subjective position so that students have more learning experiences, experience the learning process, and give students the autonomy of learning. Respect for individual differences is the first and foremost of the precise adjustment of physical education. Treat every student with equal vision and attitude, realize the optimal development of every student as the ultimate goal, according to the different characteristics and personalities of students, give students positive evaluation and correct guidance, and effectively carry out tailor-made teaching. Secondly, the teacher’s way of teaching determines the students’ way of learning. Different individuals, different knowledge content, using different ways of learning, have different learning effects. This is to learn the principle of the highest learning efficiency for students to design the appropriate way of learning. Finally, the implementation of precise teaching adjustment relies on the collection, analysis and application of students’ learning data, so in the process of carrying out precise teaching design, it is necessary to be able to effectively collect students’ learning data and the data collected should be true, effective and timely, and then adjust the content of physical education teaching according to the results of data analysis, optimize the teaching objectives and, carry out precise teaching.
The duration of this PE teaching practice was one semester, and the frequency of the practice was once a week in conjunction with School H’s weekly testing and evaluation model. The target audience for the practice were students from 18 teaching classes in School H. Using the pre-test data, the 18 teaching classes in School W were divided into three groups based on the differences in student bases, with six classes of similar degrees in each group. In order to facilitate the subsequent control verification of the effectiveness of using data for precision teaching implementation, one experimental class was selected in Group A to implement precision teaching, while one class was selected in Group A as a control. The same screening was conducted in Groups B and C. At the end of the semester, the final grades of the two classes in the three groups were compared to verify the effectiveness of the adjustment of precision teaching in physical education in this paper. At the same time, the student’s physical fitness was analyzed to study the impact of the precision adjustment of the content of physical education teaching on the student’s physical fitness.
The pre-test data of the three groups of classes’ sports achievements are shown in Table 1. Among them, the students of group A class have the best foundation, and the sum of the high score rate and excellence rate of sports achievement for both experimental and control classes is higher than 50%. Group B and Group C are the next best, and the sum of the high score rate and excellence rate is not higher than 20% and 10%, respectively. At the same time, in order to overcome the tendency of relying solely on scores, the following data are only available to teachers. Students can only see the grade presentation for individual performance.
The previous data of the three sets of class sports results
| Group | Class | Mean | Maximum | Minimum | High rate | Excellence rate | Good rate | Rate of conformity | Pending rate | Standard deviation |
|---|---|---|---|---|---|---|---|---|---|---|
| A | Laboratory | 83.68 | 100 | 75 | 21% | 33% | 31% | 15 | 12.35% | 15.66 |
| Cross-reference | 84.56 | 100 | 73 | 22% | 34% | 30% | 14% | 11.52% | 16.58 | |
| B | Laboratory | 79.56 | 100 | 70 | 11% | 8% | 37% | 44% | 20.08% | 18.24 |
| Cross-reference | 80.33 | 100 | 71 | 12% | 8% | 37% | 43% | 18.54% | 16.77 | |
| C | Laboratory | 70.15 | 100 | 65 | 2% | 6% | 35% | 37% | 21.11% | 18.32 |
| Cross-reference | 71.23 | 100 | 65 | 3% | 7% | 34% | 56% | 16.23% | 17.52 |
In order to objectively verify the effectiveness of the precision teaching mode of physical education in this paper, two teaching modes were adopted in the experimental class and the control class to carry out teaching. In the experimental class, the precise teaching mode was adopted for teaching. In the control class, the traditional teaching mode is adopted. After one semester of teaching experiment, the midterm test scores and final exam scores of the three experimental and control groups were compared and analyzed.
The results of the comparison of the scores of group A are shown in Table 2. The two classes in group A have a better foundation in physical education, and there has been a significant improvement in the midterm test and final examination of the two classes. The average score of the control class in the midterm exam was 87.56, which was higher than that of the experimental class (82.75), but the average score of the experimental class exceeded that of the control class in the final exam, with an average score of 96.75. Moreover, the excellence rate in the final exam of the control class decreased from 33% to 30%, while the experimental class increased from 15% to 30%.
The results of the group A
| Class | Examination | Mean | Excellence rate | Good rate | Rate of conformity | Low rate(%) | Standard deviation |
|---|---|---|---|---|---|---|---|
| Cross-reference class | Midterm | 87.56 | 0.33 | 0.38 | 0.29 | 5.25 | 14.25 |
| Final examination | 92.12 | 0.30 | 0.40 | 0.30 | 0.00 | 10.12 | |
| Laboratory class | Midterm | 82.35 | 0.15 | 0.50 | 0.35 | 4.89 | 12.85 |
| Final examination | 96.75 | 0.35 | 0.25 | 0.10 | 0.00 | 10.45 |
The results of the comparison of the results of group B are shown in Table 3. The average score of the midterm examination of the control class in group B is 5.1 points higher compared to the experimental class, but the average score of the final examination is 3.11 points lower. Meanwhile, the excellence rate of the final exam of the experimental class is 10% higher than that of the control class, and the experimental class has a better effect on improving the performance of physical education.
The results of the group B
| Class | Examination | Mean | Excellence rate | Good rate | Rate of conformity | Low rate(%) | Standard deviation |
|---|---|---|---|---|---|---|---|
| Cross-reference class | Midterm | 85.23 | 0.14 | 0.33 | 0.53 | 25.53 | 15.53 |
| Final examination | 87.12 | 0.20 | 0.40 | 0.40 | 2.68 | 13.35 | |
| Laboratory class | Midterm | 80.13 | 0.15 | 0.45 | 0.40 | 10.21 | 11.36 |
| Final examination | 90.23 | 0.30 | 0.40 | 0.30 | 0.00 | 12.38 |
The results of the comparison of the results of group C are shown in Table 4. The average scores of the experimental class in group C were higher than those of the control group in both the midterm and final tests, which were 78.68 and 87.62, respectively. Combining the comparison of the physical education achievement data of the three groups of experimental and control classes, it can be analyzed and concluded that the experimental class and the control class are both making progress. However, because it takes some time for students to adapt to the model during practice, not all classes made progress on the midterm test, which is also the main reason for the lower midterm scores of the experimental classes. However, the final exam scores of the experimental classes in all groups were higher than those of the control classes, so the physical education precision teaching mode in this paper can quickly adapt to the classes and promote the increase in performance and the adjustment of physical education teaching content is reasonable and effective.
The results of the group C
| Class | Examination | Mean | Excellence rate | Good rate | Rate of conformity | Low rate(%) | Standard deviation |
|---|---|---|---|---|---|---|---|
| Cross-reference class | Midterm | 70.56 | 0.9 | 0.37 | 0.54 | 19.02 | 15.20 |
| Final examination | 83.66 | 0.14 | 0.35 | 0.51 | 1.12 | 14.98 | |
| Laboratory class | Midterm | 78.68 | 0.10 | 0.41 | 0.49 | 0.00 | 6.58 |
| Final examination | 87.62 | 0.28 | 0.40 | 0.32 | 0.00 | 14.35 |
The results of the student’s physical fitness test are shown in Table 5. Physical fitness, which encompasses the body’s performance in daily activities and life itself, is the cornerstone of healthy living for everyone. This concept encompasses several aspects, including strength, endurance, flexibility, and coordination. In the study of the impact on students’ physical fitness, this study takes a 50-meter run, 50×8 folding run, seated forward bending and one-minute sit-up as the test standards for speed, endurance, flexibility and strength quality, respectively, and then comprehensively analyzes the impact of the precise adjustment of physical education teaching on students’ physical fitness in this paper.
In the speed qualities, a repeated measures ANOVA revealed a significant interaction between intervention condition and time (F=6.523, p<0.001). A further separate simple effects analysis for intervention condition and time showed that the experimental class scored significantly higher on the speed test post-test than their pre-test data (p<0.001). In contrast, there was no significant difference between the pre and post-tests of the control class (p>0.05). A test effect test for time showed that there was no significant difference between the scores of the experimental and control classes before the experiment (p>0.05), while there was a significant difference after the experiment (p<0.001) and the experimental class scored significantly higher than the control class, with an increase of 3.1 points in the speed score compared to the control class.
In endurance qualities, the interaction between intervention condition and time was significant (F=15.185, p<0.05). The experimental class scored significantly higher (p<0.05) after the experiment than before the experiment. There was no significant difference in the endurance qualities of the students in the control class before and after the experiment (p>0.05). However, after the experiment, there was a significant difference between the endurance quality scores of the two classes (p<0.05), and the experimental class scored 4.3 points higher than the control class.
In flexibility qualities, the experimental class scored significantly higher after the experiment than before (p<0.01), and flexibility was significantly improved, while there was no significant difference between the control class before and after the experiment (p>0.05). The experimental class scored significantly higher (p<0.01) than the control class after adjustment for physical education in this paper.
In strength qualities, the results of the repeated measures ANOVA showed a significant interaction between intervention condition and time (F=22.341, p<0.001). Further, separate simple effect analyses for intervention conditions and time showed that strength quality scores were significantly higher in the experimental class after the experiment than before the experiment (p<0.001). In contrast, there was no significant difference in strength scores before and after the experiment in the control class (p>0.05). Before the experiment, there was no significant difference between the scores of the experimental class and the control class (p>0.05), while there was a significant difference in the scores after the experiment (p<0.001), and the score of the experimental class was significantly higher than that of the control class by 6.57 points.
Comprehensively, this paper, based on data analysis of precisely adjusted physical education teaching mode, can effectively improve the level of students’ physical fitness, for students’ speed quality, endurance quality, flexibility quality, strength quality and other comprehensive physical fitness have a promotional effect.
Student health test results
| variable | Class | Time | Time factor | Intervention condition | Interaction term | ||||
|---|---|---|---|---|---|---|---|---|---|
| Before | After | F | P | F | P | F | P | ||
| Speed | Laboratory | 27.15±2.85 | 30.25±3.45 | 25.657 | 0.012 | 15.123 | 0.000 | 6.523 | 0.000 |
| Cross-reference | 26.95±2.56 | 27.15±2.11 | |||||||
| Endurance | Laboratory | 22.65±3.15 | 26.15±3.42 | 4.815 | 0.000 | 14.352 | 0.000 | 15.185 | 0.032 |
| Cross-reference | 22.55±2.35 | 21.85±3.22 | |||||||
| Flexibility | Laboratory | 17.15±2.15 | 20.23±2.65 | 12.854 | 0.015 | 11.115 | 0.002 | 6.038 | 0.001 |
| Cross-reference | 17.15±2.68 | 17.16±2.68 | |||||||
| Power | Laboratory | 17.52±4.15 | 23.68±3.98 | 30.152 | 0.000 | 43.242 | 0.000 | 22.341 | 0.000 |
| Cross-reference | 16.68±3.15 | 17.11±3.11 | |||||||
This paper adjusts and optimizes the content of physical education teaching by combining the concept of precise teaching with data analysis and establishing the realization path.
The physical education scores of both experimental and control classes are improving. However, because it takes a period for students to adapt to the teaching adjustment mode of this paper during practice, the midterm scores are lower than those of the control class. Overall, this paper introduces a sports precision teaching model that effectively enhances students’ sports performance compared to conventional sports teaching, while also demonstrating relatively good student adaptability.
The physical education content adjustment in this paper has a positive impact on students’ physical fitness. After the test, the speed, endurance, flexibility, and strength qualities of the students in the experimental class improved by 3.1, 4.3, 3.07, and 6.57 points, respectively, compared to the control class. This difference is significant, with a p-value of less than 0.05. At the same time, there is a significant difference in the pre- and post-test fitness scores of the experimental class (p<0.05), and there is no significant difference in the pre- and post-test fitness scores of the control class (p>0.05). Physical fitness scores are not significantly different (p > 0.05). The practical results further demonstrate the effectiveness of this paper’s physical education teaching model, which is based on data analysis and accurate adjustment. It also demonstrates that this method can enhance students’ physical fitness and positively influence their level of physical fitness.