The Role of Green Marketing Strategies in Promoting Sustainable Development
oraz
17 mar 2025

O artykule
Data publikacji: 17 mar 2025
Otrzymano: 22 paź 2024
Przyjęty: 04 lut 2025
DOI: https://doi.org/10.2478/amns-2025-0203
Słowa kluczowe
© 2025 Hui Zhang et al., published by Sciendo
This work is licensed under the Creative Commons Attribution 4.0 International License.
Figure 1.
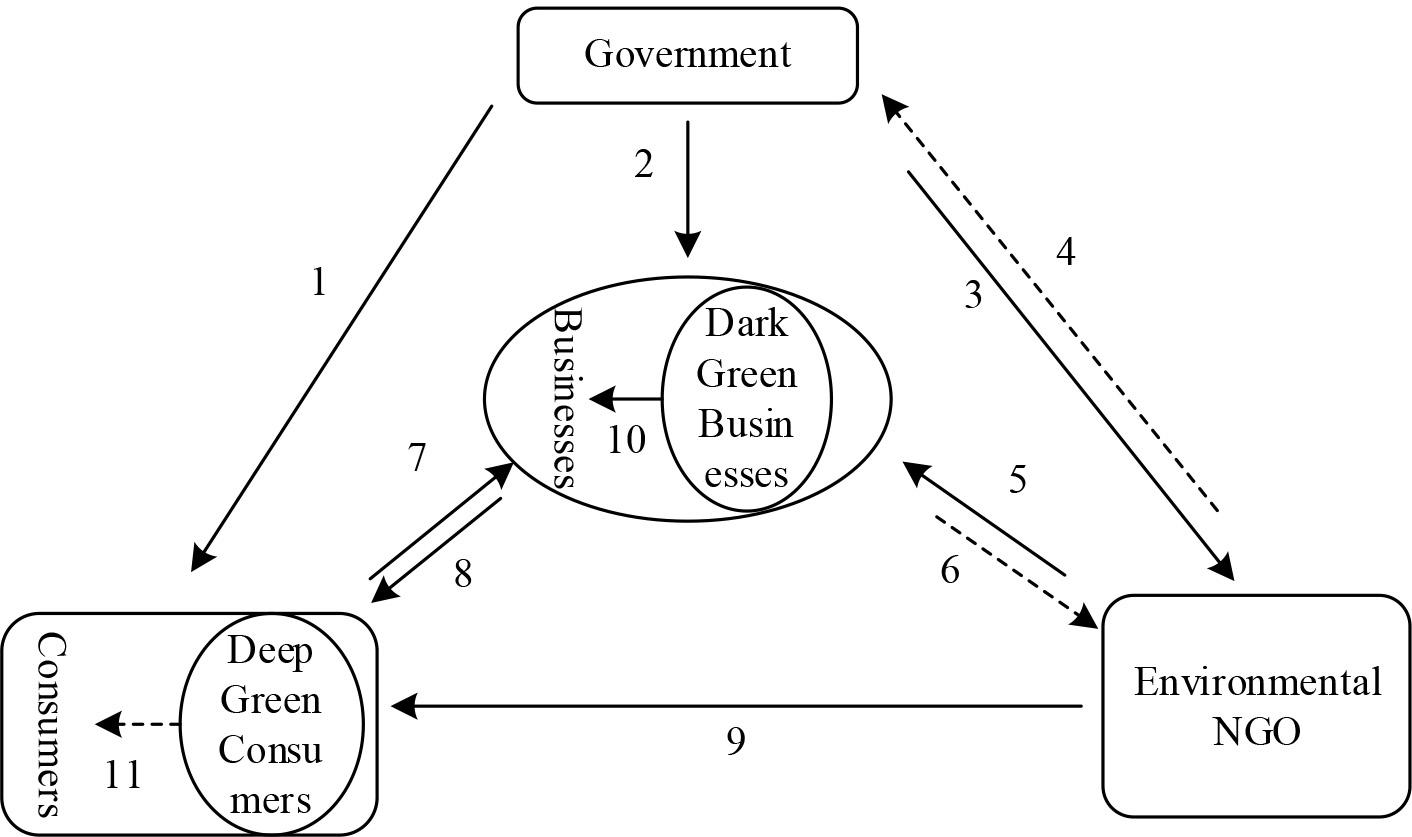
Figure 2.
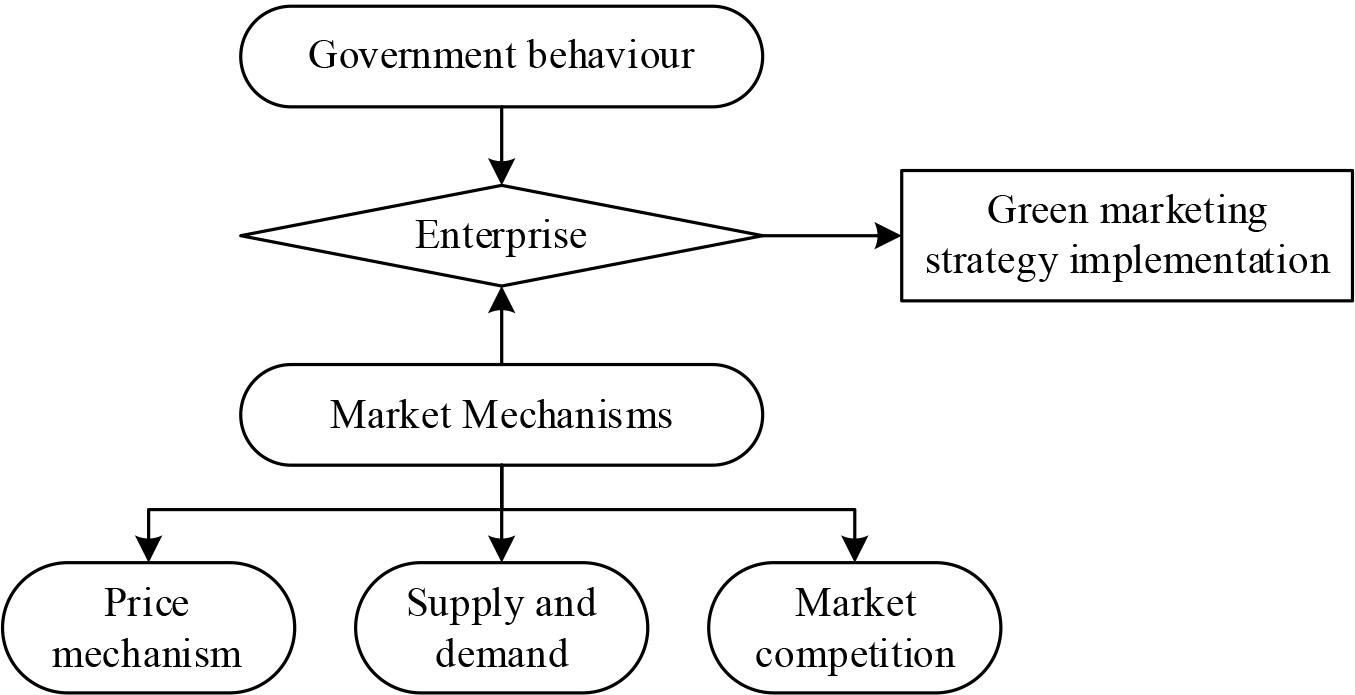
Figure 3.
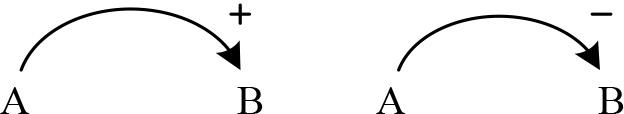
Figure 4.
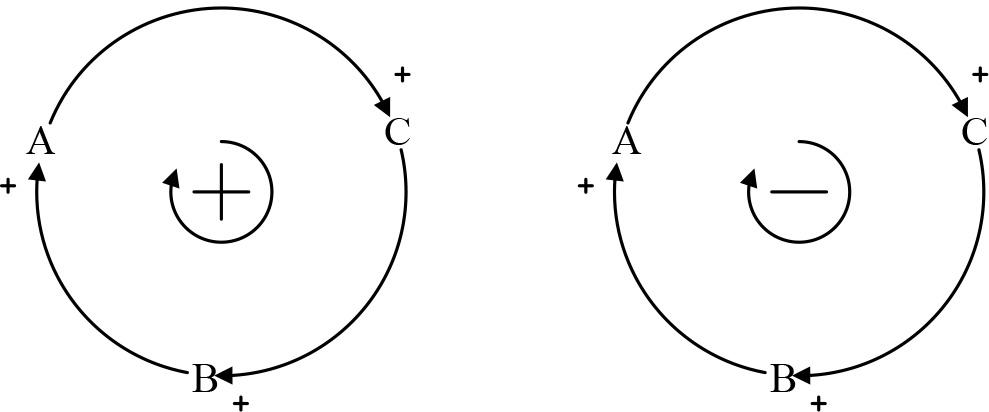
Figure 5.
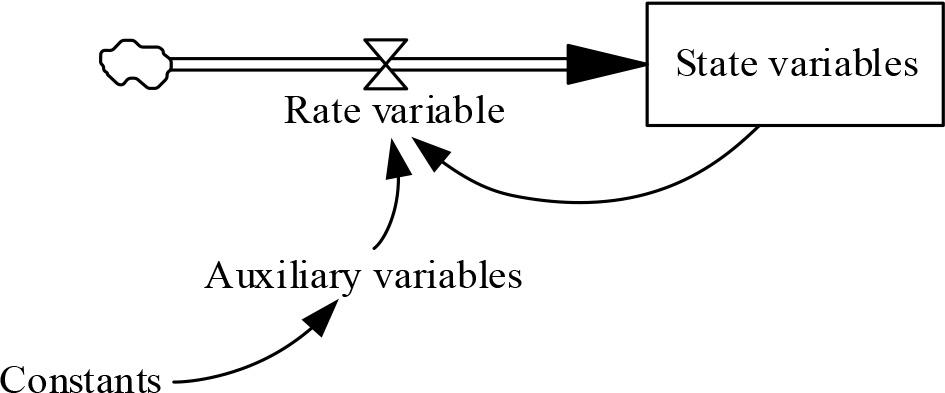
Figure 6.
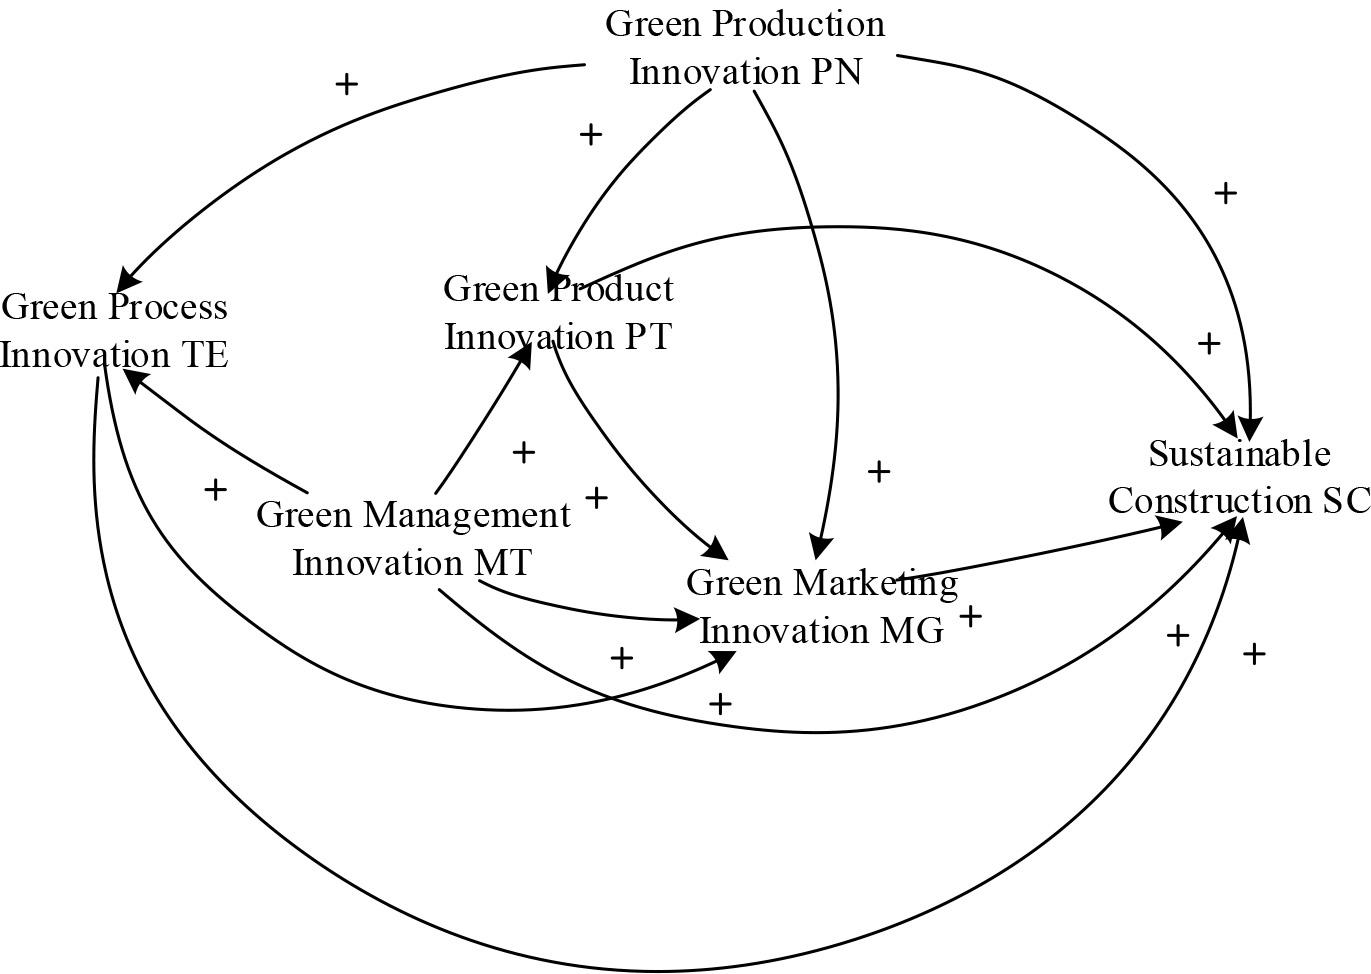
Figure 7.
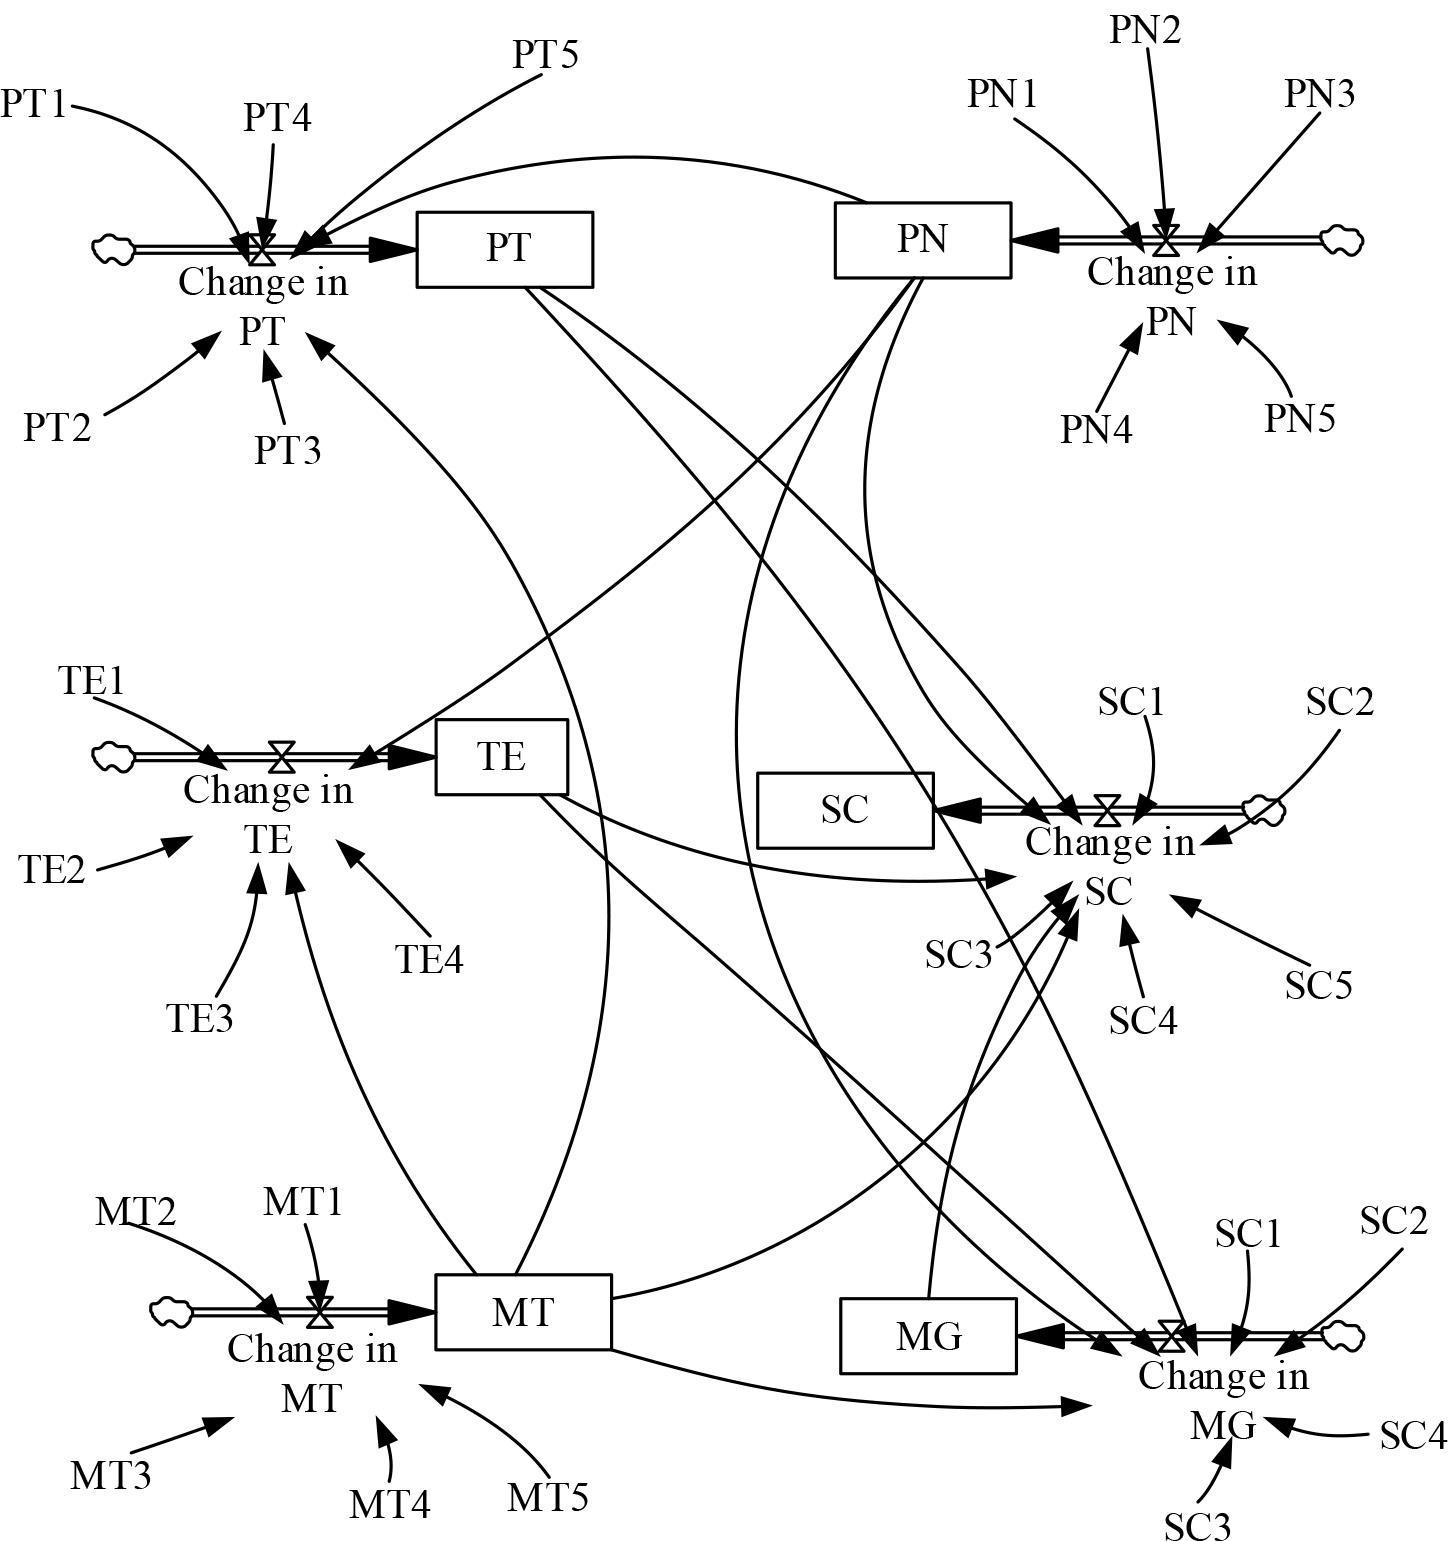
Figure 8.
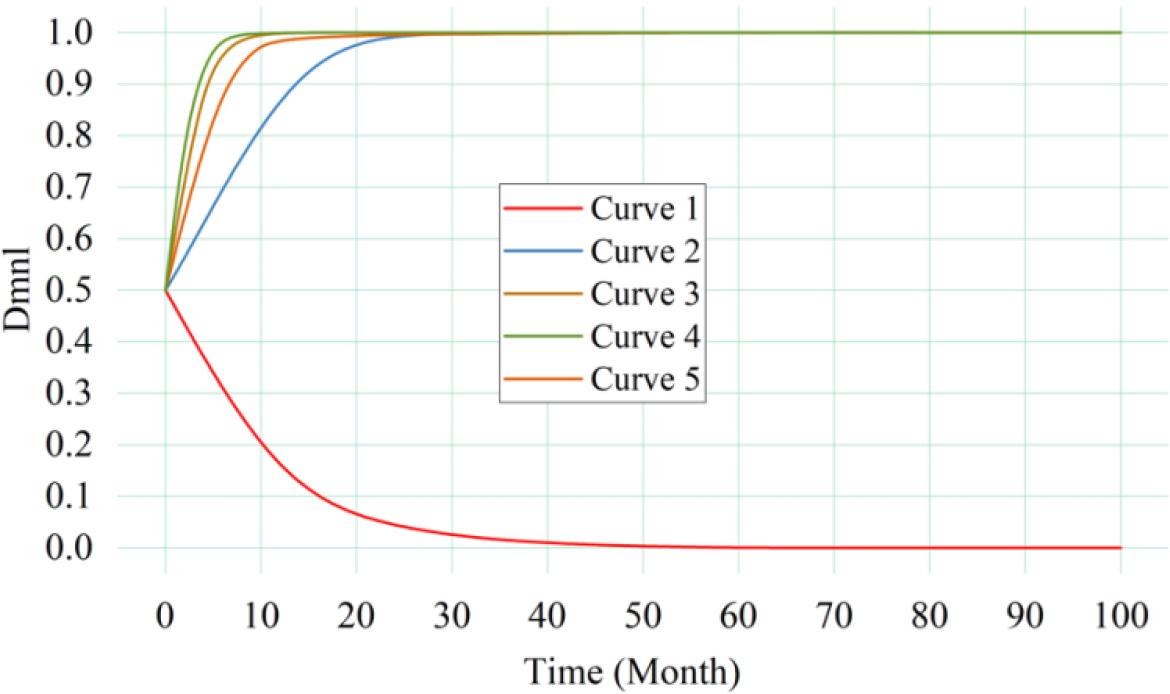
Figure 9.
Figure 10.
Figure 11.
Green marketing affects the relevant variables of sustainable development system
| Nature | Content | |
|---|---|---|
| State variable | Sustainable Development (SC) | |
| Green Production (PN) | ||
| Green Products (PT) | ||
| Green Technology (TE) | ||
| Green Management (MT) | ||
| Green Marketing (MG) | ||
| Rate variable | Amount of change in Sustainable Development (SC) | |
| Amount of change in Green Production (PN) | ||
| Amount of change in Green Products (PT) | ||
| Amount of change in Green Technology (TE) | ||
| Amount of change in Green Management (MT) | ||
| Amount of change in Green Marketing (MG) | ||
| Constant | SC | Water Use Efficiency during Project construction (SC1) |
| Energy utilization efficiency during project construction (SC2) | ||
| Material utilization efficiency during project construction (SC3) | ||
| Pollution control level during project construction (SC4) | ||
| Occupational Health and Safety Management Level (SC5) | ||
| PN | Implementation of green procurement and supply green raw materials (PN1) | |
| Scientific and Reasonable design of green construction process (PN2) | ||
| Effective reduction of toxic and waste emissions (PN3) | ||
| Recovery of waste and emissions for treatment and reuse (PN4) | ||
| Reduce water, electricity, coal or oil consumption (PN5) | ||
| PT | Select product materials that produce the least amount of pollution (PT1) | |
| Select product materials that consume the least energy and resources (PT2) | ||
| Choose to use the least amount of material to produce (PT3) | ||
| Carefully consider whether the product is easy to recycle (PT4) | ||
| Avoid using materials that violate environmental regulations in the production of products (PT5) | ||
| TE | Adoption of pollution control and prevention technology (TE1) | |
| Construction Waste Reduction technology (TE2) | ||
| Use of advanced resource utilization technology (TE3) | ||
| Green Construction technology for Increased Productivity (TE4) | ||
| MT | Create a feasible green management system(MT1) | |
| Effective communication and resource sharing among departments (MT2) | ||
| Invest a high proportion of funds in green innovation (MT3) | ||
| Constantly collect new information on green innovations (MT4) | ||
| Actively introduce green advanced equipment and cultivate innovative talents (MT5) | ||
| MG | Quickly and effectively identify the market’s green needs (MG1) | |
| Green promotion, establish green marketing channel (MG2) | ||
| Green Communication and Promotion Strategy (MG3) | ||
| Establishment of corporate green brand status (MG4) | ||
Simulation scheme Settings
| Variable | Increase foreign capital inflow | Expand overseas investment | Strengthening International trade |
|---|---|---|---|
| Option 1 | +10% | +0 | +0 |
| Option 2 | +0 | +10% | +0 |
| Option 3 | +0 | +0 | +10% |
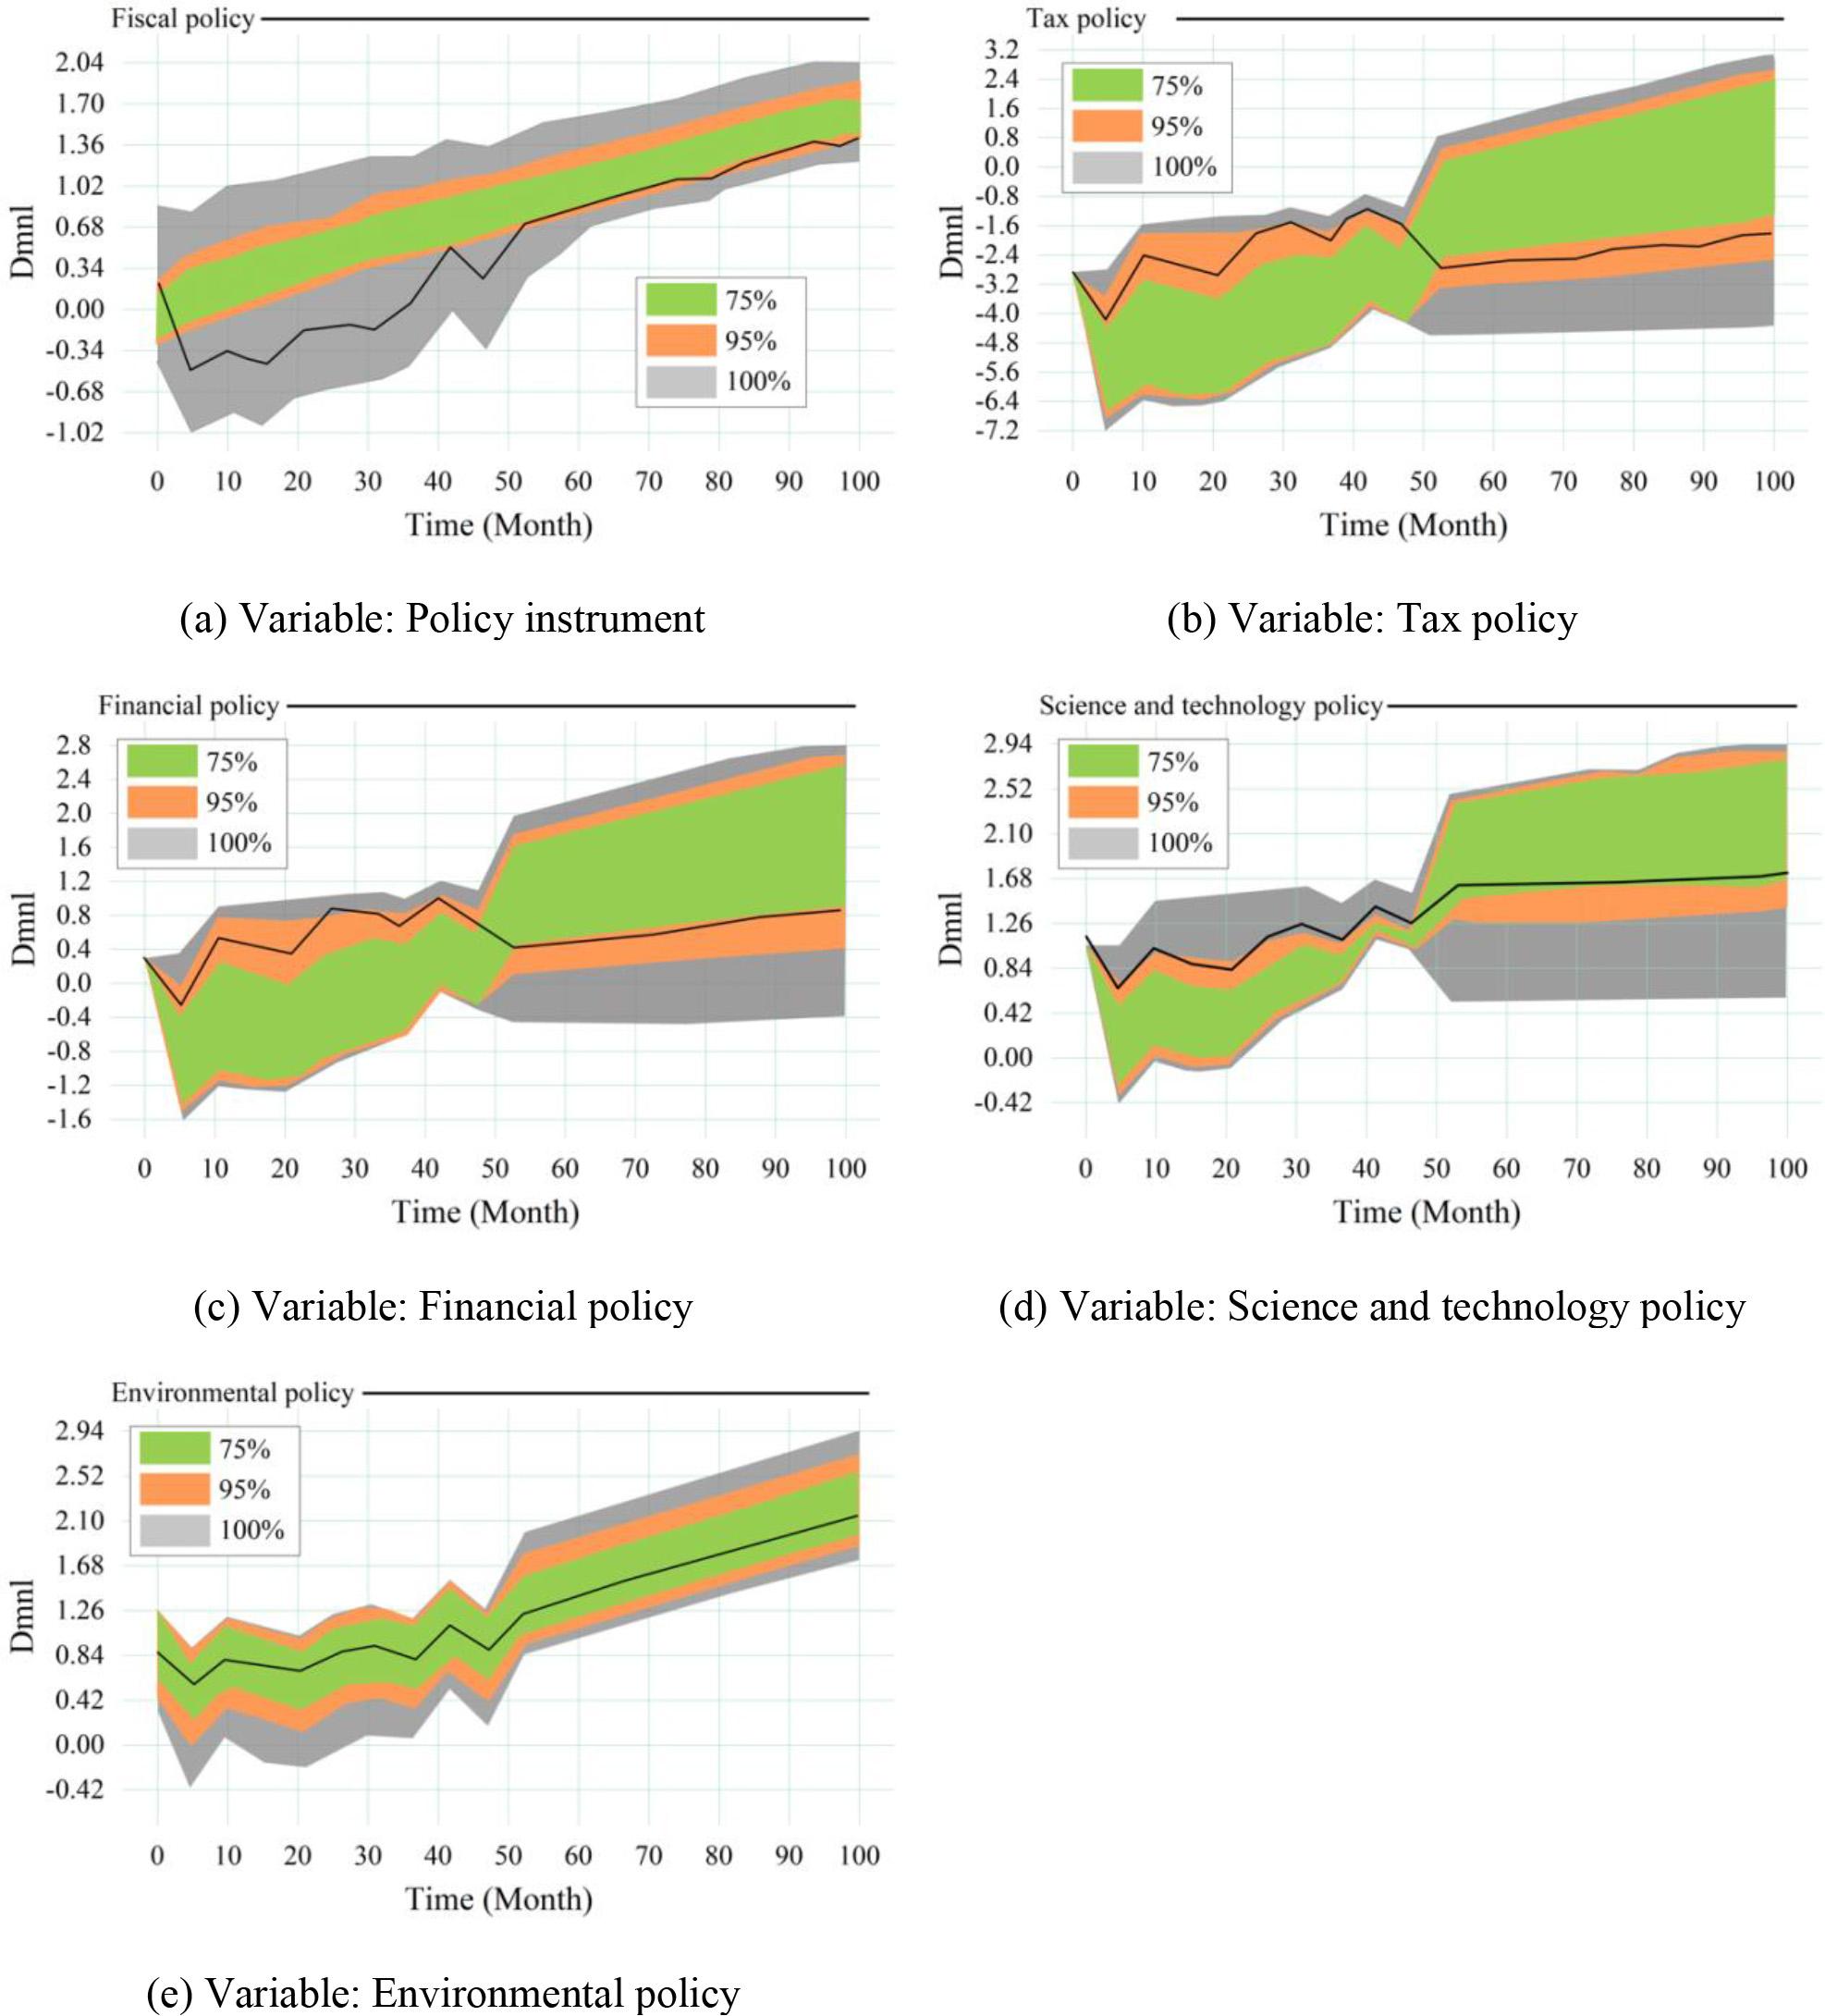
Parameters setting for the sensitivity test
| Policy instrument | Argument | Initial value | Range of variation |
|---|---|---|---|
| Fiscal policy | The proportion of industrial pollution control investment in GDP | 0.00098 | [0, 0.003] |
| Tax policy | Environmental tax rates fluctuate | 0 | [0, 0.1] |
| Financial policy | Green credit interest rate floating | 0 | [-0.05, 0.05] |
| Science and technology policy | Government R&D expenditure as a percentage of GDP | 0.13288 | [0, 0.03] |
| The proportion of enterprise capital to GDP in enterprise R&D investment | 0.13315 | [0, 0.02] | |
| Environmental policy | The transaction price of waste water discharge branch fluctuates | 0 | [0, 0.04] |
| The trading price of waste emission rights fluctuates | 0 | [0, 0.04] |