The Effect of Educational Resource Allocation on Teaching and Teaching Ability in Colleges and Universities Based on BP Neural Networks
17 mar 2025

O artykule
Data publikacji: 17 mar 2025
Otrzymano: 04 lis 2024
Przyjęty: 08 lut 2025
DOI: https://doi.org/10.2478/amns-2025-0188
Słowa kluczowe
© 2025 Qian Wei, published by Sciendo
This work is licensed under the Creative Commons Attribution 4.0 International License.
Figure 1.
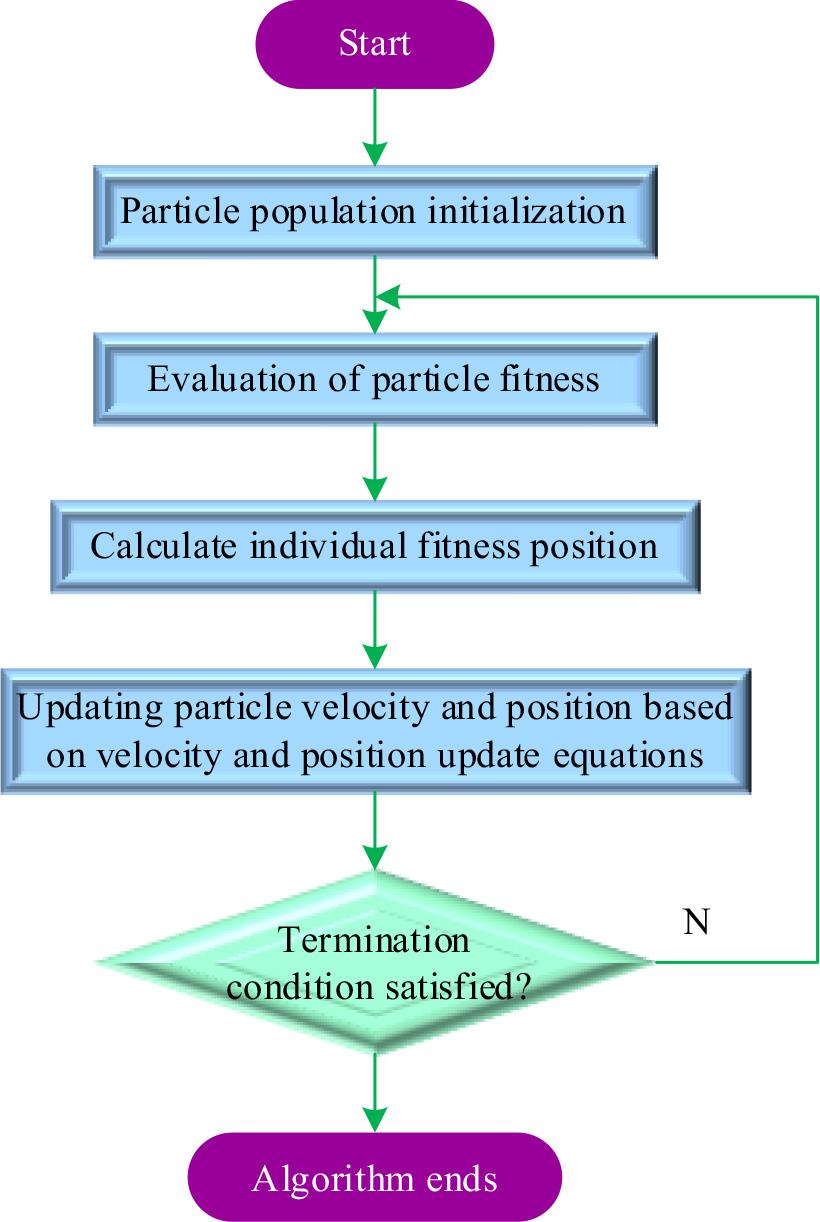
Figure 2.
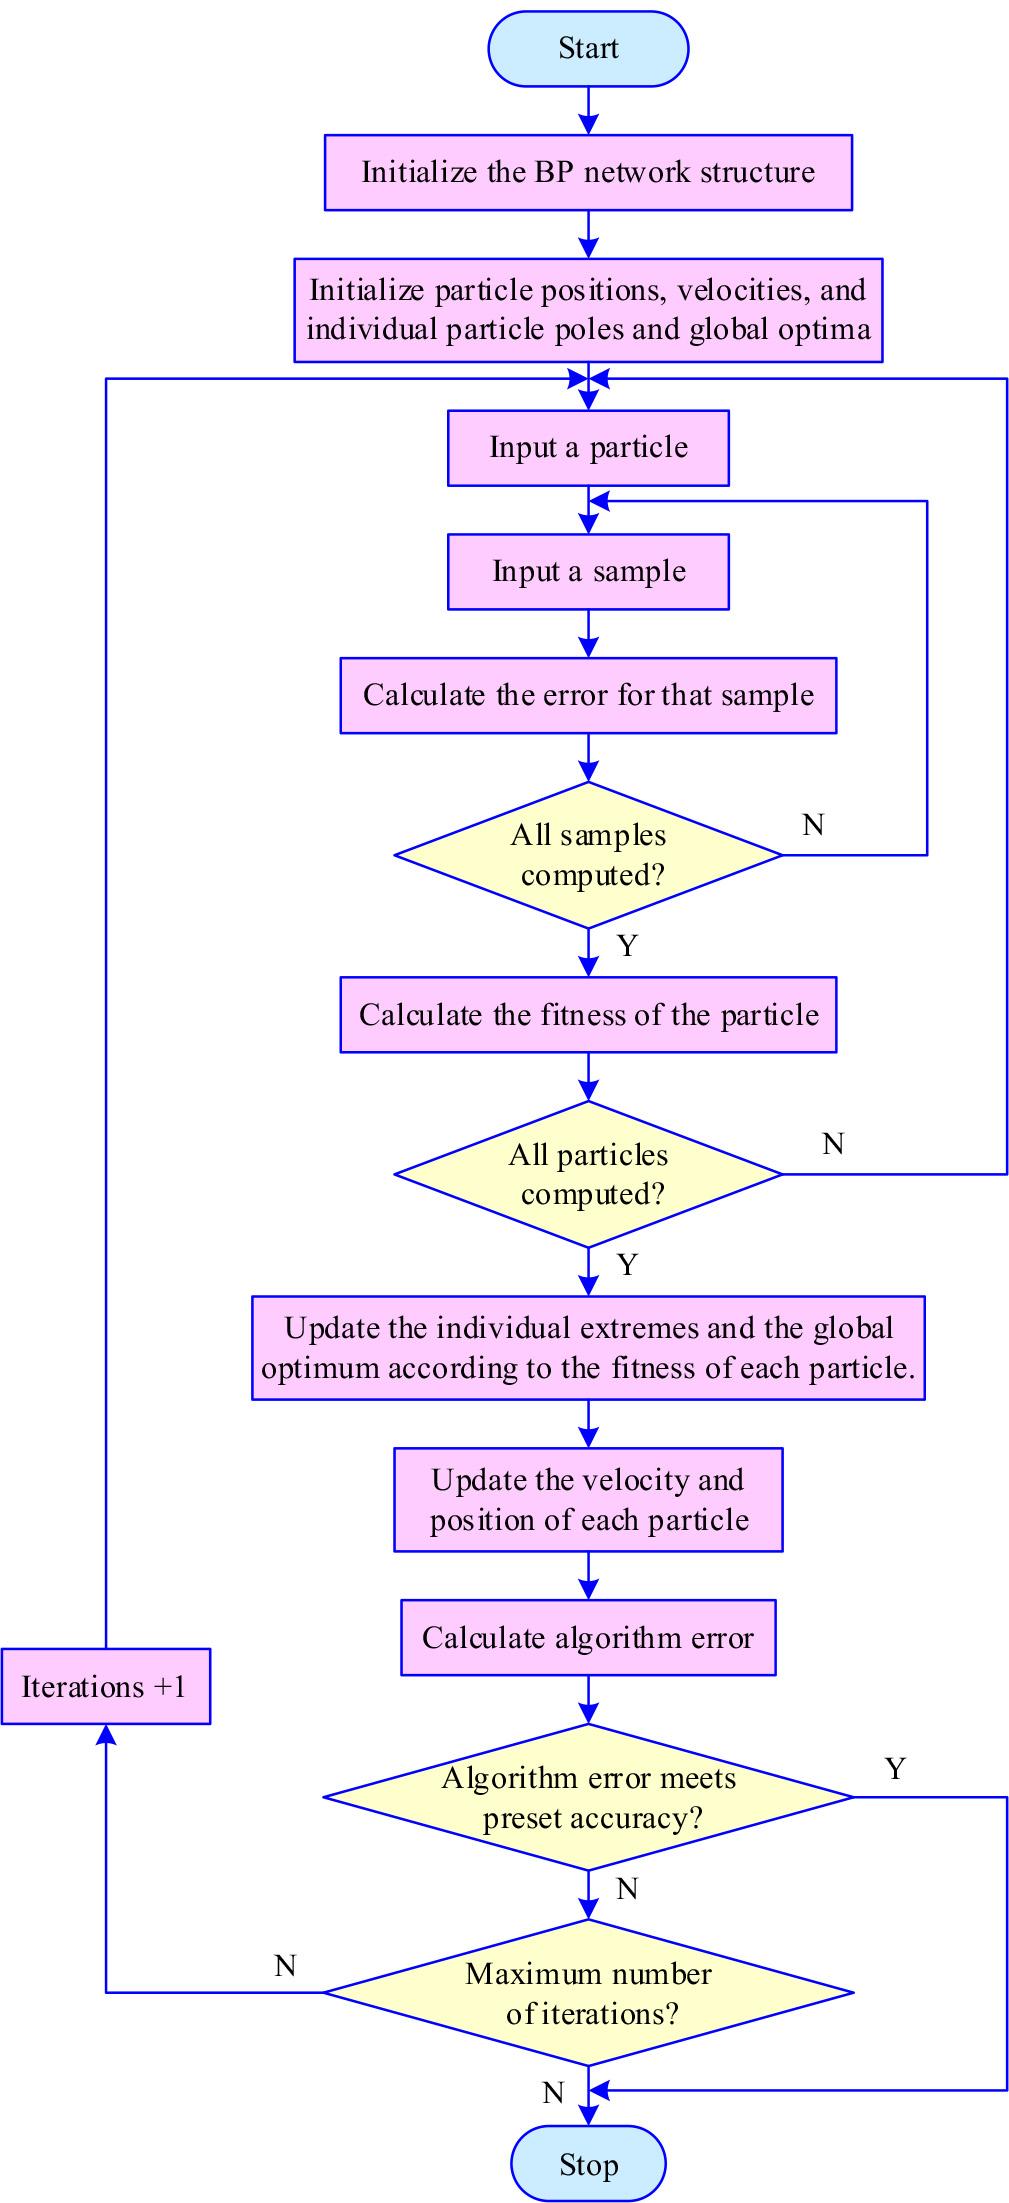
Figure 3.

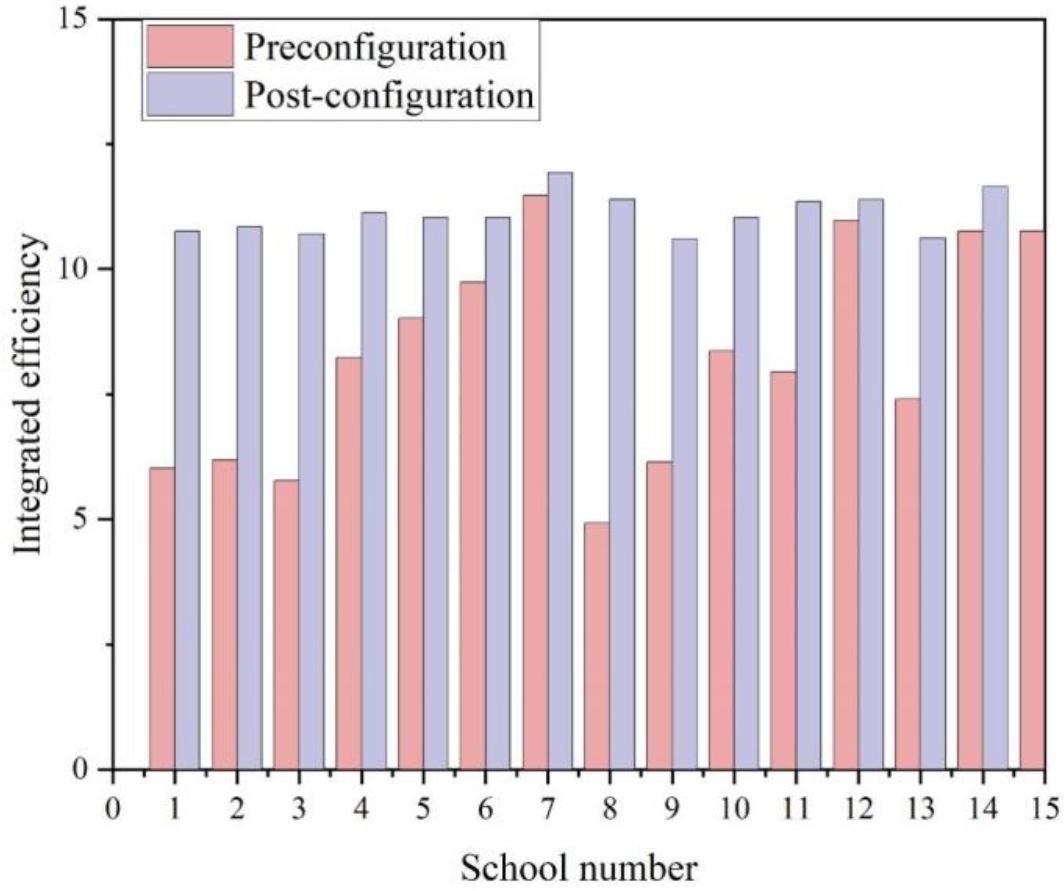
Figure 4.
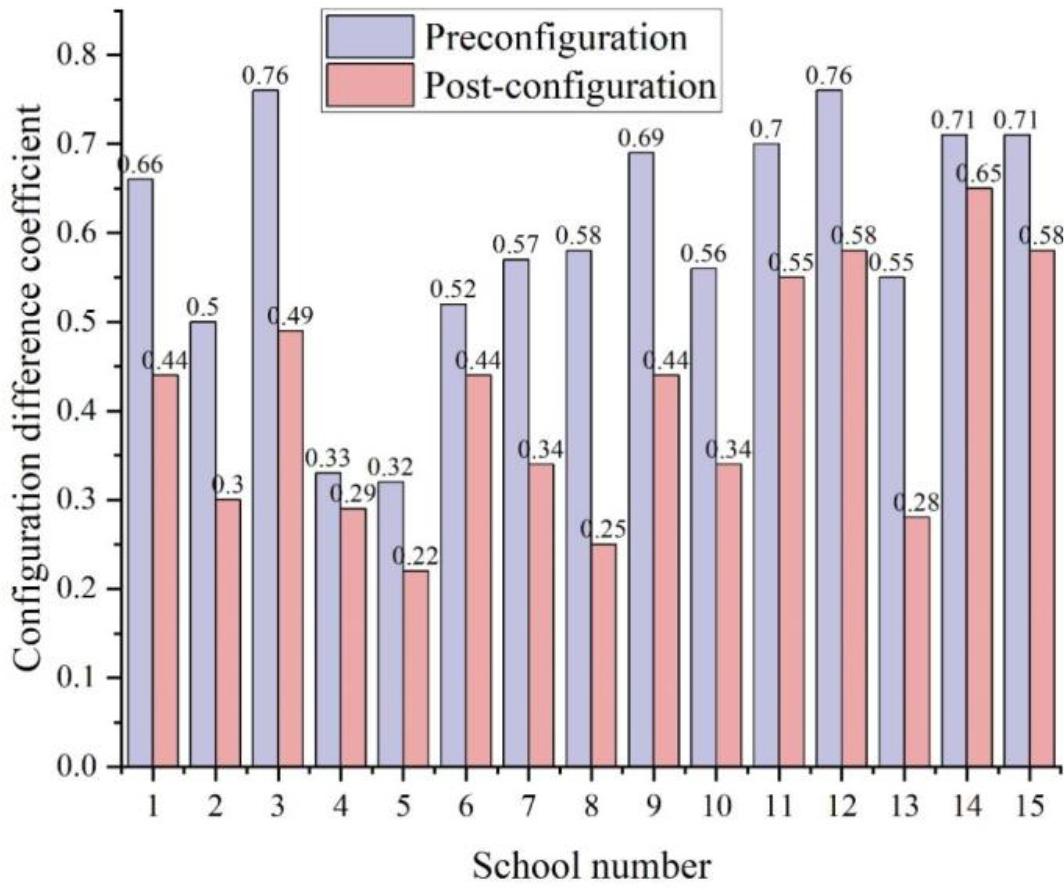
Figure 5.
Independent sample inspection
| Levin variance equivalence test | Average equivalent t test | 95% Confidence Interval of the Difference | |||||||
| F | Sig. | t | Freedom | Sig.(2-tailed) | Mean difference | Standard error difference | Lower | Upper | |
| Assumed equal variance | 1.325 | 0.257 | 4.341 | 75 | 0.000 | 8.4526 | 1.8365 | 4.235 | 12.56 |
| Unassuming equal variance | - | - | 4.332 | 73.245 | 0.000 | 8.4526 | 1.8324 | 4.136 | 12.59 |
Education resource allocation optimization results
| A | B | C | D | E | |
| 1 | 22368 | 342978 | 1142 | 1115 | 1876 |
| 2 | 25139 | 326393 | 1027 | 1209 | 1902 |
| 3 | 33283 | 443335 | 1606 | 1741 | 2183 |
| 4 | 33047 | 401181 | 2162 | 1444 | 3438 |
| 5 | 33208 | 328174 | 1181 | 726 | 2795 |
| 6 | 27016 | 345810 | 1257 | 2164 | 1888 |
| 7 | 20200 | 200206 | 795 | 1380 | 1272 |
| 8 | 29730 | 319980 | 1185 | 1279 | 1964 |
| 9 | 17174 | 397496 | 1222 | 1450 | 954 |
| 10 | 23559 | 274153 | 1143 | 1549 | 2558 |
| 11 | 25792 | 269829 | 1391 | 1278 | 1496 |
| 12 | 31220 | 282596 | 1419 | 2744 | 1612 |
| 13 | 14444 | 169864 | 1265 | 909 | 1121 |
| 14 | 80203 | 796287 | 4204 | 8546 | 6377 |
| 15 | 93035 | 643165 | 4286 | 7520 | 7336 |
Evaluate the hierarchical class
| Level | v | g | a | b |
| Content | Very good | Good | Acceptable level | Differ from |
| Desired Output | [1,0,0,0] | [0,1,0,0] | [0,0,1,0] | [0,0,0,1] |