Study on the impact of optimal design of internal space layout of pre-assembled substation on the stability of equipment operation
, , , e
17 mar 2025

INFORMAZIONI SU QUESTO ARTICOLO
Pubblicato online: 17 mar 2025
Ricevuto: 21 ott 2024
Accettato: 07 feb 2025
DOI: https://doi.org/10.2478/amns-2025-0195
Parole chiave
© 2025 Jingchao Guo et al., published by Sciendo
This work is licensed under the Creative Commons Attribution 4.0 International License.
Figure 1.

Figure 2.
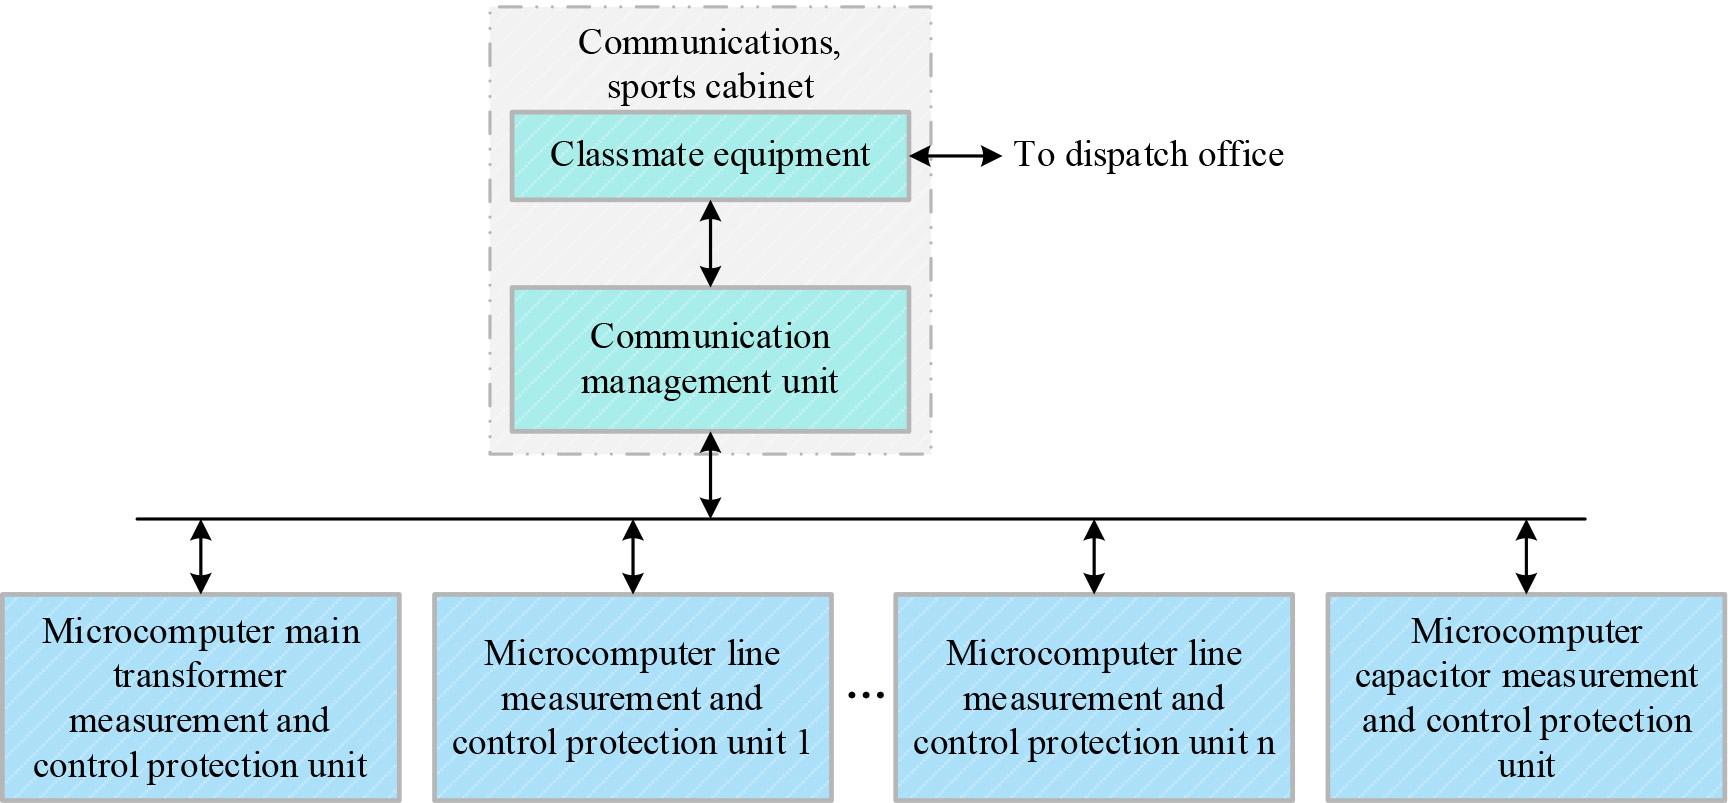
Figure 3.
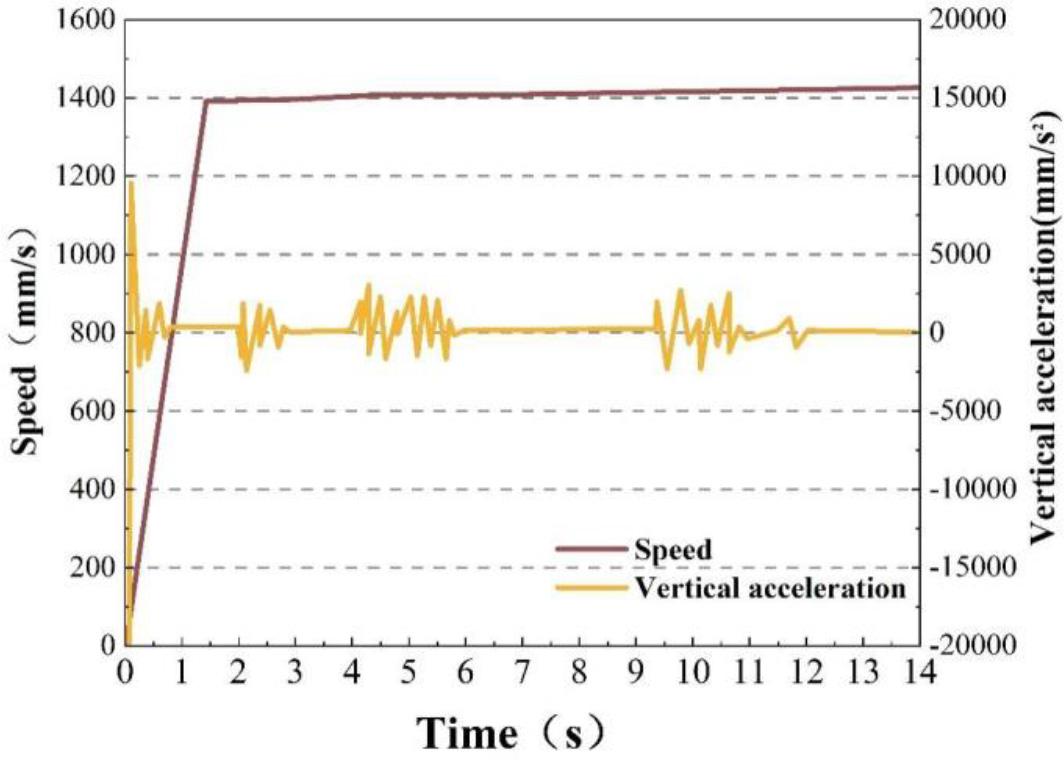
Figure 4.
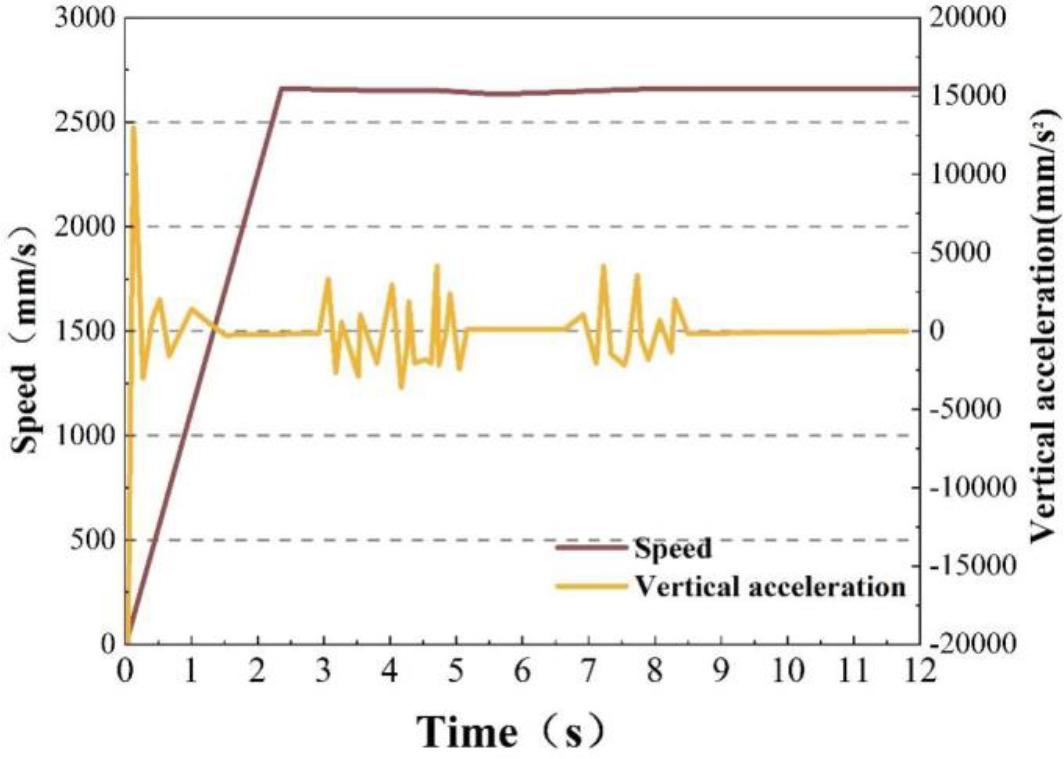
Figure 5.
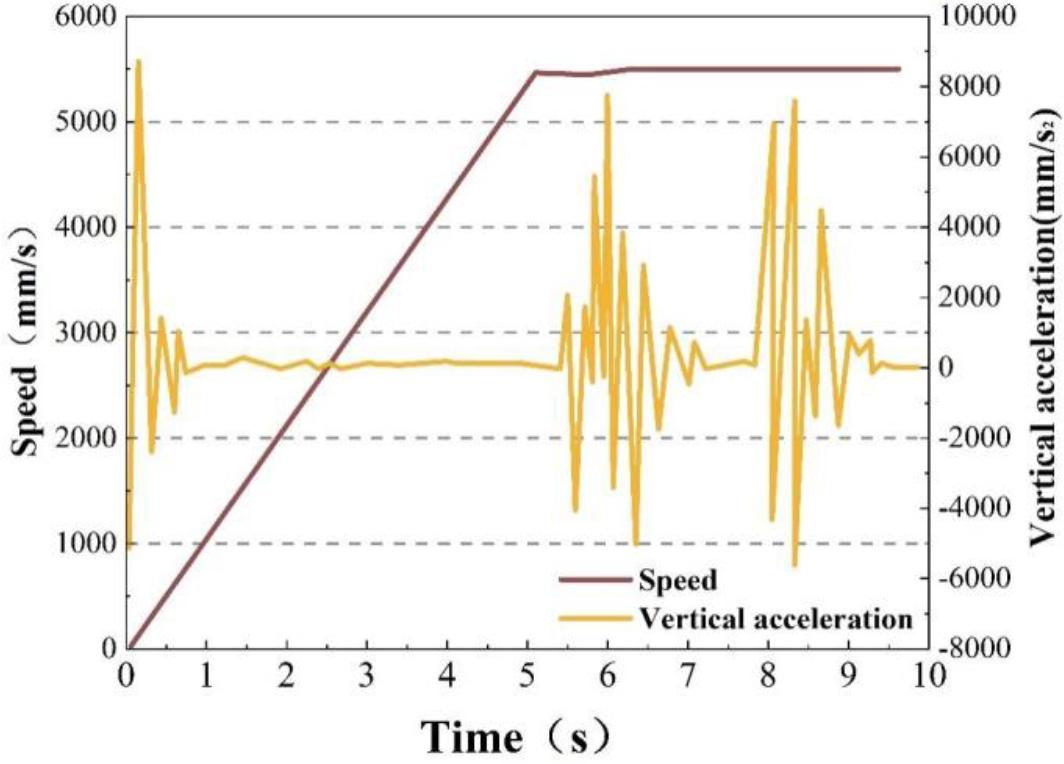
Figure 6.
Figure 7.

The comparison of main harmonic current values
| Major harmonic times | Filter pre-current current value | Filter post-current current value | Reduction rate(%) |
| 5th | 8.09 | 0.918 | 90.1 |
| 7th | 3.56 | 0.757 | 81.2 |
| 11th | 3.19 | 0.34 | 92.8 |
| 13th | 2.22 | 0.23 | 94.8 |
| 175th | 2.04 | 0.199 | 85.9 |
Compensation effect of different pulse shift Angle
| Pulse Angle | Active power(P/W) | Imaginary power(Q/Var) | power factor(ph) | |||
| Before | Later | Before | Later | Before | Later | |
| 55° | 9556 | 27236 | 16858 | 337 | 0.6685 | 0.99 |
| 60° | 8203 | 25878 | 15995 | 108 | 0.6311 | 0.99 |
| 65° | 7226 | 12913 | 15159 | 29 | 0.6045 | 1 |
| 70° | 4847 | 20326 | 13287 | 30 | 0.5152 | 1 |
| 75° | 3168 | 14925 | 11063 | 104 | 0.4455 | 1 |
| 80° | 1628 | 10229 | 7673 | 42 | 0.3725 | 1 |
| 85° | 631 | 2653 | 4072 | 17 | 0.3038 | 1 |