A Study on the Dual Benefits of Ecotourism Resource Management Intelligent Decision Making System for Environment and Economy

Pubblicato online: 17 mar 2025
Ricevuto: 30 ott 2024
Accettato: 20 feb 2025
DOI: https://doi.org/10.2478/amns-2025-0173
Parole chiave
© 2025 Ying Yu, published by Sciendo
This work is licensed under the Creative Commons Attribution 4.0 International License.
With the increasing concern for the natural environment and cultural heritage, ecotourism has received widespread attention as a form of sustainable tourism. Ecotourism resource management plays an important role in protecting the ecological environment, inheriting culture and promoting community development [1-2]. However, the current ecotourism resource management faces a series of challenges and problems, such as the lack of clear management ideas, insufficient resource development concepts and backward management tools [3-5]. The intelligent decision-making system relying on big data and artificial intelligence technology can promote ecotourism towards sustainable development, realize the coordinated development of the economy, environment and society, and make ecotourism an excellent way for people’s tourism and leisure [6-7].
An intelligent decision-making system for ecotourism resource management is an intelligent management approach based on the premise of protecting and restoring the ecological environment, aiming to realize the sustainable development of the economy, society and the environment through rational planning, effective management and scientific monitoring [8-11]. Its primary goal is to balance tourism development and ecological protection, minimize the impact of tourism activities on the ecological environment, and promote the sustainable development of forest ecotourism resources by strengthening protection and management [12-14]. In addition, rational planning and effective management are needed, including the assessment and development of tourism resources, the establishment of management organizations and teams, and supervision and law enforcement to seize development opportunities in order to form a good tourism economic development situation [15-16].
Establishing a reasonable ecotourism resource development and management system can promote ecotourism to move forward in the direction of more sustainable development. Eddyono, F. et al. constructed a dynamic model of ecotourism elements integrating artificial intelligence and big data based on the competitive performance of geographic regions and empirically analyzed the competitiveness performance of tourist destinations and the performance of ecotourism elements implementation by carrying out simulation experiments in order to discover innovative methods for expanding competitiveness [17]. Wang, H. showed that the rural ecotourism industry takes natural terrain and humanistic customs as development resources, which positively affects the economic development of rural areas, and proposed to establish a multi-attribute decision-making method based on single-valued neutrosophic number power generalized BM operator and sustainable development of rural ecotourism is evaluated and decision-making, which promotes the dual development of environment and economy [18]. Zabihi, H. et al. integrated GIS and fuzzy hierarchical analysis to establish a reliable model for the identification of ecotourism attraction suitability, which provides decision-makers, planners and practitioners with a theoretical support for assessing the relative importance of natural, physical, environmental and socio-economic factors [19]. Zhang, Y. et al. elaborated the concept of sustainable intelligent ecotourism, which is carried out through intelligent technology for tourism assessment and tourism management, to realize the improvement of operational efficiency while reducing the harm to natural and cultural ecosystems and promoting education and environmental protection [20]. Zhu, Y. et al. used SWOT and TOPSIS models to identify and evaluate the factors affecting the development of tourism destinations, and based on this. They formulated a positive strategy to promote the development of eco-tourism in the region, which can make a positive contribution to expanding and strengthening the economy of the region [21]. Mileti, F. A. et al. developed a geospatial decision support system based on a geospatial web infrastructure to provide users and decision-makers of ecotourism and rural tourism with a web-based operational tool that facilitates the use of the user community and improves the efficiency of decision-makers in the planning and management of sustainable tourism [22]. Talebi, M. et al. compared the performance of Artificial Neural Network (ANN) and Linear Discriminant Analysis (LDA) methods for ecological capacity identification in ecotourism areas, and experiments showed that ANN has higher accuracy in the process of predicting and ranking ecotourism capacity areas [23].
For ecotourism resource management, the study designed an intelligent decision management system that covers data entry, ecotourism environment evaluation, analysis, and prediction functions. With its core ecotourism environment evaluation for demonstration, the ecotourism suitability evaluation model is constructed using the XGBoost algorithm after selecting relevant characteristic factors from the ecological environment, geological landscape, socio-economic and resource endowment. The classification performance of the model is explored through the analysis of the confusion matrix and ROC curve, as well as the measurement of relevant evaluation indexes. On this basis, the intelligent decision-making system of ecotourism resource management is taken as the independent variable, and its dependent variables on economic and environmental dimensions are refined, respectively, so as to construct the theoretical model of the study and put forward relevant hypotheses. The questionnaire survey is adopted to collect data, and the collected data are input into the structural equation model to obtain the analysis results of each hypothetical pathway so as to dig deeper into the effect of the ecotourism resource management intelligent decision-making system on the environment and the economy.
Ecotourism management is a complex concept, the content of which not only includes the protection of the ecological environment and human resources by the main body of the management of tourist attractions but also includes the monitoring and evaluation, service management and operation management related to this. Ecotourism resource management intelligent decision-making system is for ecotourism resources long-term positioning mining, research mining and statistics mining, the use of modern ecological theory, principles of systems analysis, software engineering, statistics, and mining, artificial intelligence, computers and other technologies, based on demand analysis, combined with the characteristics of the intelligent decision support system, ecotourism resource management intelligent decision-making system of the top design and sub-layer design, to determine the system of the intelligent decision-making system. and sublayer design, determine the functions and performance of the system, and effectively solve the problems of qualitative and quantitative evaluation, analysis, and prediction of intelligent decision-making of ecotourism resource management intelligent decision-making system.
The front-end functional structure of the intelligent decision-making system is shown in Figure 1, which mainly includes data entry and management, ecotourism environment evaluation, analysis, and prediction functions.
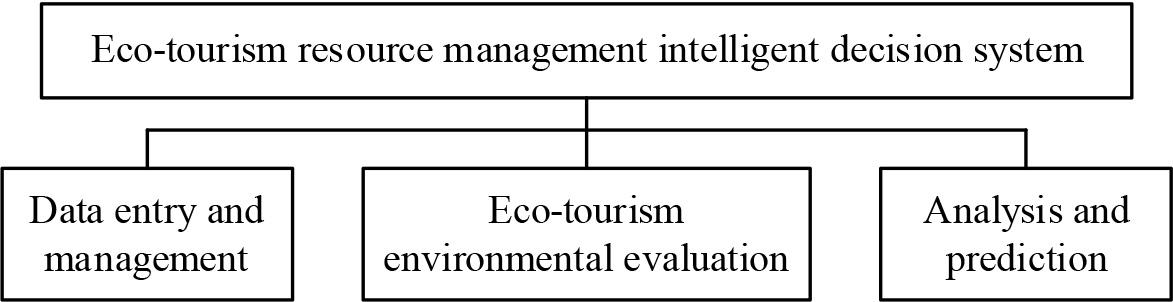
The functional structure of the intelligent decision system
Data entry and management function module
This module mainly enters and effectively manages all the data in the system, providing an effective data basis for evaluation, prediction, and intelligent decision-making. This function module enters the historical data, spatial data, indicators and parameters related to service value evaluation, analysis and prediction into the database, and at the same time, sets the parameters of evaluation indicators, and carries out the corresponding data browsing and query management.
Ecotourism environment evaluation function module
This module is one of the core functions of the system. Evaluation of the ecotourism environment is a process of discovering and solving problems. Its starting point is to promote tourist attractions to obtain better protection and development space. The evaluation content mainly includes the geographical environment of the tourist attractions, characteristic resources and the corresponding development direction, development means, etc., but also includes the change rule of the environment of the tourist attractions as well as the impacts of tourism development on the local ecological environment.
Analysis and prediction function module
Analysis and prediction function module is one of the important target functions of the system. On the basis of ecotourism environment evaluation, it carries out the analysis of each environmental value ranking of ecotourism resources. In order to comprehensively and systematically understand the comprehensive strength of the environment of different ecological types, it is necessary to consider many indicators reflecting the characteristics of the ecotourism environment from different sides and carry out a retrospective evaluation by comprehensively analysing the principal components of different ecotourism environments.
According to the characteristics of ecotourism environmental resources, the evaluated data are subjected to cluster analysis, association rule analysis, decision tree analysis, and prediction in data mining. The functional classification of ecotourism resources was carried out through the hierarchical cluster analysis method in cluster analysis. The algorithm in association rule analysis analyzes the association between ecotourism resource information to determine potential laws. Generate classification rules using the algorithm in decision tree analysis.
The structure of the core functional components of the system backend is shown in Figure 2. The core functional components of the system backend include system management, statistical analysis, data mining, decision support, and result output.
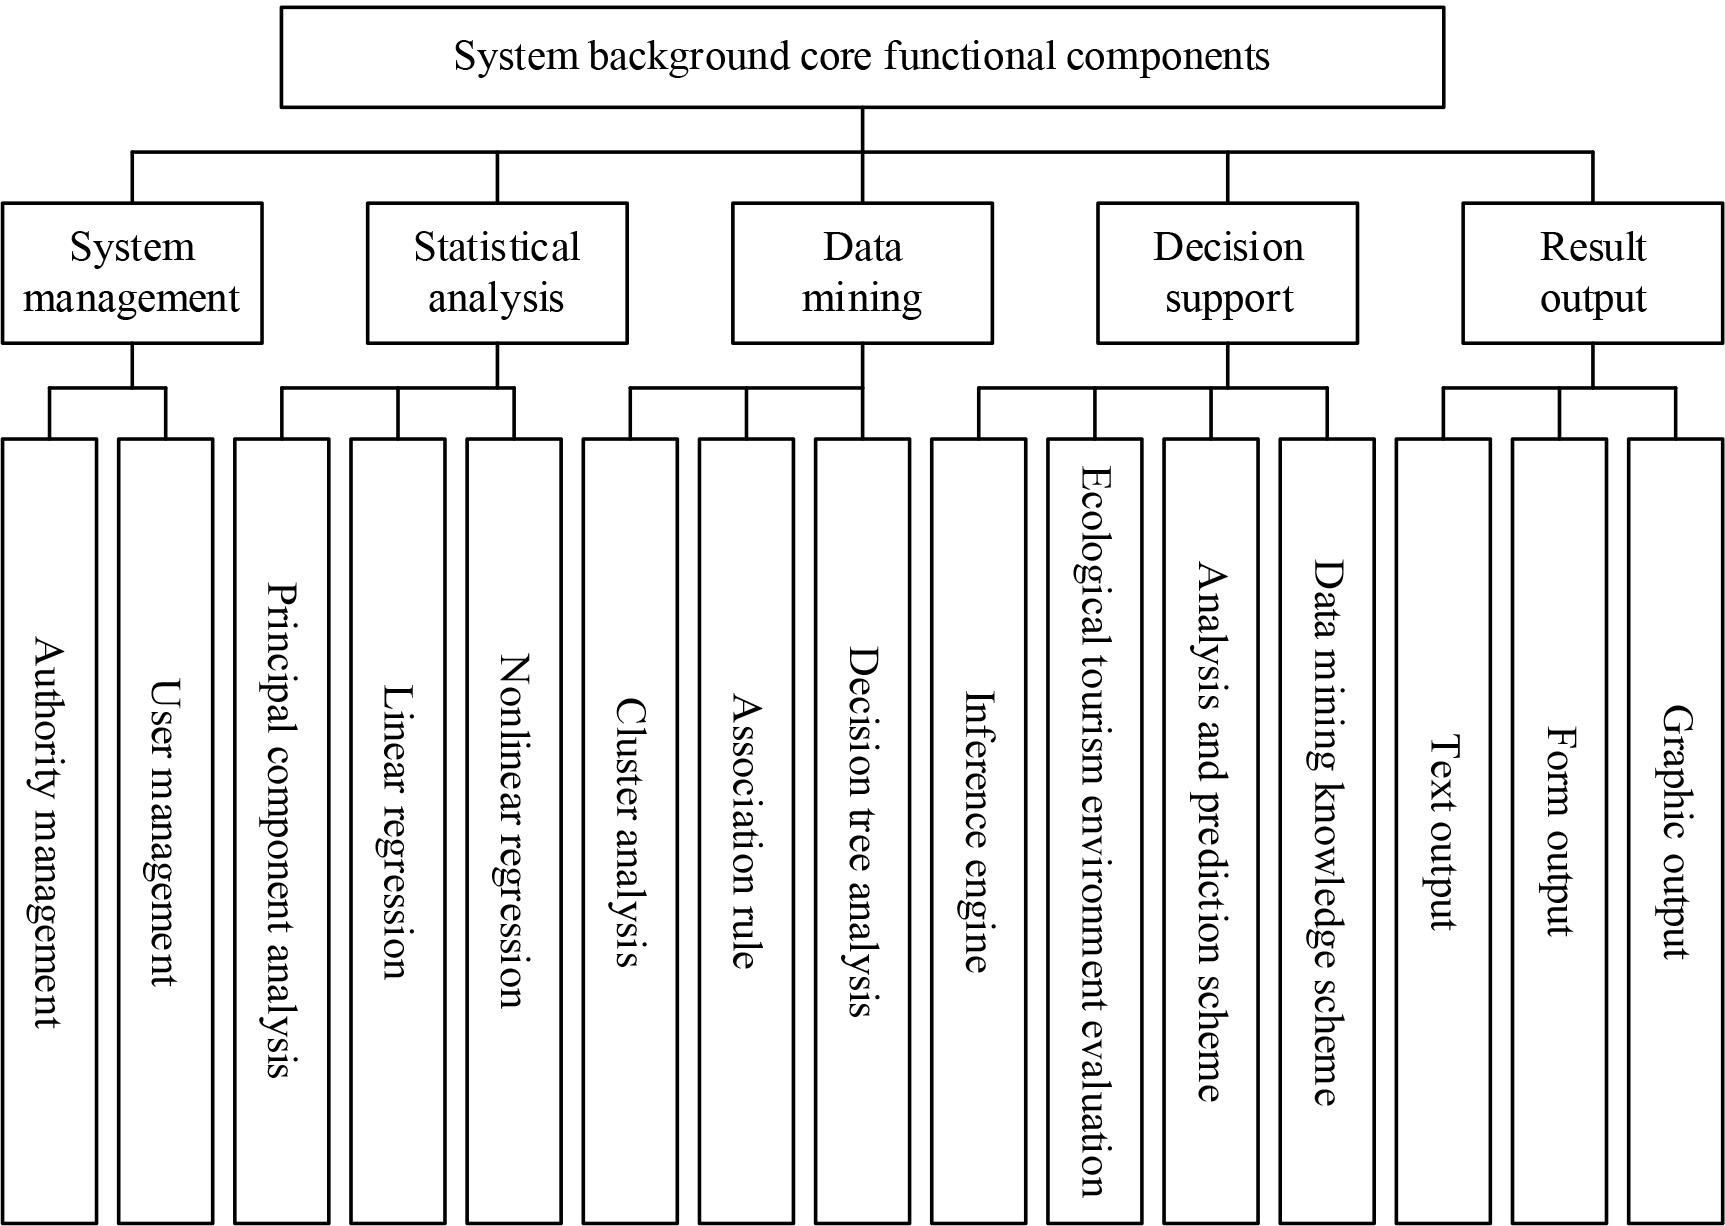
Core functional component structure of the system background
System management function module
User management can add, delete and edit users, users are divided into system administrators and ordinary users. The system administrator has the power to assign and regulate the rights of the logged-in users, and the system can create a variety of users with different privileges to log in and operate. Ordinary users are typically data entry or knowledge engineers and have the authority to add, delete, check, change, and perform other operations on the data. Users have the ability to modify the password to suit their needs.
Statistical analysis function module
This functional module applies the principal component analysis, linear and non-linear regression analysis in statistical analysis technology to provide principal component analysis, quantitative prediction analysis and driving force analysis of the value of different eco-tourism resources sub-types of service functions.
Data Mining Function Module
Based on the information on the ecological environment, geological landscape, social economy and resource endowment of ecotourism resources, this functional module applies the technical support of clustering analysis, association rule analysis and decision tree analysis in data mining to analyse and predict the data, and excavate the intrinsic relationship between the features and the classification characteristics, so as to obtain the knowledge, provide the decision-making support, and assist the management and decision-making.
Decision support function module
This function module provides a scheme for evaluating the ecotourism environment, analysis, and prediction, based on the complex characteristics of ecotourism resources evaluation and prediction. Generative rules are used to represent, organise and store the knowledge acquired through cluster analysis, association rule analysis and decision tree analysis. Combined with database technology, the knowledge base and rule base of the system are established. Then, combine the reasoning machine to achieve the decision support function of qualitative and quantitative evaluation, analysis, prediction and intelligent decision support system for ecotourism resources, and integrate the elements of ecotourism resources into evaluation, analysis, prediction and decision making.
Result output function module
This functional module outputs the results of qualitative and quantitative evaluation, analysis and prediction of service function value, data mining and decision support in a man-machine-friendly way, which can be presented in the form of text, tables, diagrams, etc. The query conditions and combinations are flexible to provide management, analysis, and decision-makers with the outputs of data visualisation and analysis from multiple perspectives.
This subsection takes the ecotourism environment evaluation module at the core of the intelligent decision-making system as the deduction object, establishes the ecotourism adaptability evaluation model based on XGBoost, and analyses the performance of the ecotourism environment evaluation model by feature construction and data mining, taking an ecotourism attraction as an example.
According to the principles of scientificity, systematicity, representativeness and accessibility of feature selection, four dimensions of ecotourism resource features, namely, ecological environment A1, geological landscape A2, socio-economic A3 and resource endowment A4, were selected.
For the ecological environment, six characteristic factors were selected: land use A11, normalised vegetation index (NDVI) A12, normalised difference water body index (MNDWI) A13, average annual temperature A14, average annual precipitation A15 and distance from river A16.
For geological and geomorphological aspects, four characteristic factors, elevation A21, slope A22, slope direction A23 and geology A24, were selected.
For socio-economic aspects, 4 characteristic factors were selected, namely distance from road A31, road network density A32, distance from residents A33 and spatial distribution of population A34.
For resource endowment, the four characterisation factors of biodiversity A41, aesthetic landscape value A42, environmental purification value A43 and maintenance of nutrient cycling A44 were selected.
The basic idea of integrated learning is to combine a series of weak learning models into a strong learning model to improve the performance of machine learning and thus provide better prediction results than a single model. As an integrated learning method based on the Boosting method, the XGBoost method integrates these weak classifiers by increasing the weights of samples with high error rates and weak classifiers with small classification errors, and selecting the classifier that makes the smallest loss function as a new classifier in each iteration and integrating these weak classifiers in a certain way until reaching the end-of-iteration condition.
XGBoost can be called an emerging branch of the boosting algorithm, which can literally be understood as extreme gradient boosting. The rough workflow of the XGBoost algorithm is as follows:
For a training set given
Where
Where
Where
Where
To construct the final XGBoost model to calculate the
The objective function can take a uniquely determined minimum value if and only if
The results of the decision tree are evaluated using this objective function, with smaller values representing a better tree structure. In general, setting the threshold value in advance during the calculation process prevents the tree from growing too deep and is used to control the overfitting of the model. When the information gain cost exceeds the set threshold, the decision tree stops splitting, and the final objective function is the structural evaluation score of the decision tree. The objective function is solved optimally to obtain the optimal sub-model
Multi-source geospatial data were aggregated from relevant websites, and the data were preprocessed according to the geographic factors characterised by the feature factors, uniformly aggregated into a raster with a spatial resolution of 30 m × 30 m and constructed into a feature matrix. The feature values corresponding to the sample points are extracted, and 70% of the samples are randomly extracted as a training set to be imported into the pre-training model (of which the positive samples are 300 existing ecotourism attractions, and the negative samples are 300 manually interpreted feature points), and the remaining 30% of the data are used as a test set for validation.
Evaluation of the classification performance of the model in the binary classification problem mainly focuses on the confusion matrix. The traditional method mainly considers the accuracy and Kappa coefficient, but this will ignore the extent of the a posteriori probability size of the machine learning algorithm, so it can not reflect the real performance of the classifier. Based on this, this paper uses the confusion matrix, along with the ROC curve, and AUC area, to assess the classification performance of the ecotourism adaptive evaluation model. The confusion matrix can be used to calculate multi-dimensional measures such as model accuracy, precision, recall, F1 score, specificity, and false positive rate (FPR).
By setting different classification thresholds, each classification metric under different thresholds is measured and supplemented with a visual display. Table 1 displays the evaluation indexes for every classification of the model under various thresholds, and Fig. 3 shows the confusion matrix under different probability thresholds. (a) to (h) are the confusion matrices with the thresholds taken from 0.1 to 0.9, respectively. With the increase of the threshold value, the overall classification accuracy of the XGBoost model first rises and then falls and reaches the peak at 0.6, and the F1 value at this time also performs the best (0.9344), the recall rate with the increase of the threshold value shows a decreasing trend, and the overall accuracy and the classification accuracy of the negative class samples (specificity) continue to rise. In order to ensure the overall classification accuracy of the model and try to judge the positive class samples correctly, it is necessary to find a balance between recall and precision, and at the same time, reduce the FPR.
Evaluation indicators for each classification of the model under different thresholds
| Probability threshold | Accuracy | Precision | Recall | F1 | Specificity | FPR |
|---|---|---|---|---|---|---|
| 0.1 | 0.8483 | 0.7743 | 0.9833 | 0.8664 | 0.7133 | 0.2867 |
| 0.2 | 0.8833 | 0.8212 | 0.9800 | 0.8936 | 0.7867 | 0.2133 |
| 0.3 | 0.9117 | 0.8665 | 0.9733 | 0.9168 | 0.8500 | 0.1500 |
| 0.4 | 0.9300 | 0.8981 | 0.9700 | 0.9327 | 0.8900 | 0.1100 |
| 0.5 | 0.9317 | 0.9085 | 0.9600 | 0.9335 | 0.9033 | 0.0967 |
| 0.6 | 0.9333 | 0.9194 | 0.9500 | 0.9344 | 0.9167 | 0.0833 |
| 0.7 | 0.9317 | 0.9274 | 0.9367 | 0.9320 | 0.9267 | 0.0733 |
| 0.8 | 0.9317 | 0.9390 | 0.9233 | 0.9311 | 0.9400 | 0.0600 |
| 0.9 | 0.9300 | 0.9510 | 0.9067 | 0.9283 | 0.9533 | 0.0467 |

Confusion matrix under different probability thresholds
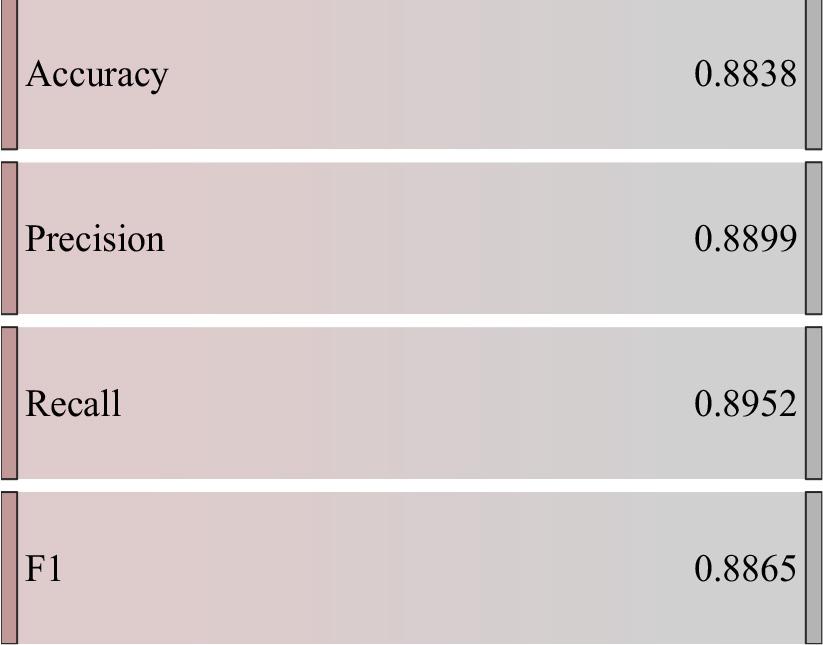
To further optimize the model and reduce the risk of model overfitting, this paper utilizes 10-fold cross-validation to comprehensively assess the model classification performance. In general, K taken as 10 has relatively low bias and variance, so this paper uses 10-fold cross-validation to assess the accuracy, precision, recall, and F1 score of the model during the modeling process.
Figure 4 shows the mean value of each assessment index of the model under 10-fold cross-validation. The overall classification accuracy reaches 88.38%, and the prediction accuracy of the minority class (positive class) samples reaches 88.99% and is combined with a high recall rate (89.52%), and the model has a low cost of mistakenly injuring the negative class samples in the process of capturing the positive class samples. In addition, the results of the F1 value also show that the precision and recall are well-balanced, and the overall classification performance of the model is excellent.
Mean values of each evaluation index of the modelunder 10-fold cross-validation
In order to further comprehensively measure the dynamics of the model in capturing the positive class samples while mistreating the negative class samples, this paper adopts the ROC curve and AUC area to measure it. The model fitting the ROC curve and AUC area is shown in Figure 5. The ROC curve for the left convex trend is obvious and far away from the ROC curve of the purely random classifier (grey dotted line in the figure). At this time, the AUC value is 0.9621, which indicates that the model classification performance is good and has reached the ideal state.
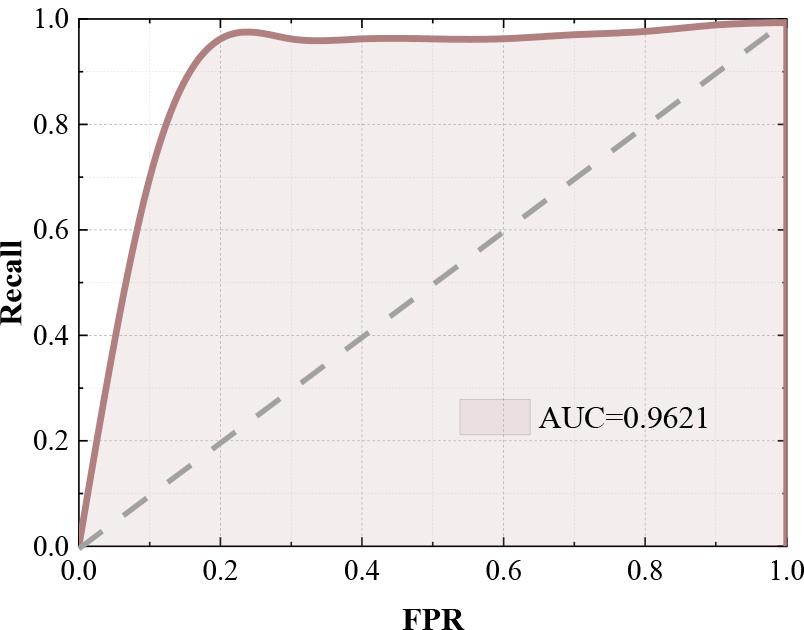
Model fitting ROC curve and AUC area
The results of the feature importance ranking returned by the model were analysed, and the feature importance ranking results are shown in Figure 6, which shows that the ecological factors have a great influence on the ecotourism suitability model. The NDVI A12 has the highest contribution (26.75%), followed by the average annual temperature A14 (12.70%) and the distance from the road A31 (8.25%), which are ranked the first, second and third among all the feature factors, third place. The development of ecotourism is highly dependent on the ecological environment, and the vegetation cover intuitively reflects the carrying capacity of the regional ecological environment, while the plant resources themselves are also rich ecotourism resources. The development of ecotourism relies on convenient transport conditions, which is a prerequisite for the development of ecotourism, but for ecologically sensitive areas rich in ecotourism resources, the blind construction of roads will damage the regional ecological environment, which should still be protected.
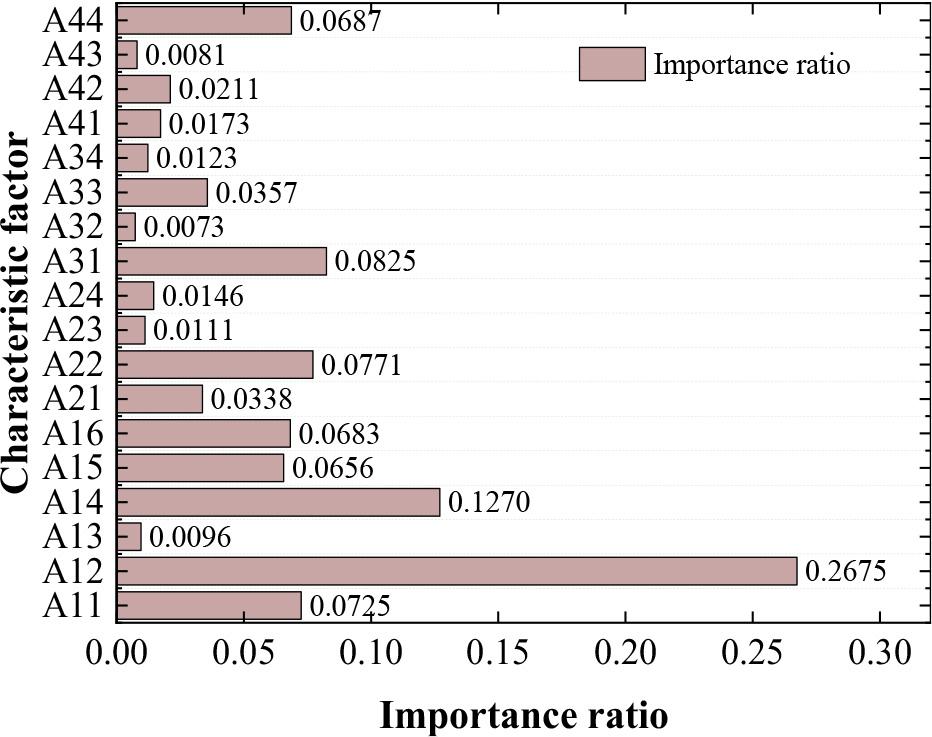
Feature importance ranking results
After building an intelligent decision-making system for ecotourism resource management in the previous section, a theoretical model of the study was established to explore its dual impact on the environment and economy using structural equation modeling.
Based on the summary of previous research, this chapter constructs a model of the relationship between the intelligent decision-making system for ecotourism resource management and the environment and the economy based on the cognitive-emotional-behavioral theory and formulates hypotheses.
The relationship model between the Ecotourism Resource Management Intelligent Decision Making System (ERMIDS) and the environment and economy is shown in Figure 7. Starting from the three dimensions of protecting natural resources X11, enhancing environmental monitoring X12, and promoting green technological innovation X13, the impact of ERMIDS, an intelligent decision-making system for ecotourism resource management, on the environment X1 is determined. The impact of ERMIDS, an intelligent decision-making system for ecotourism resource management, on the economy X2 is determined from the four dimensions of creating employment opportunities X21, promoting traditional cultural industries X22, developing training institutions X23, and promoting infrastructure development X24.

Research model design
Ecotourism resource management intelligent decision-making system has an impact on the existence of the environment
H1: Ecotourism resource management intelligent decision-making system has a significant positive impact on the conservation of natural resources.
H2: Ecotourism resource management intelligent decision-making system has a significant positive impact on enhancing environmental monitoring.
H3: Ecotourism resource management intelligent decision-making system has a significant positive impact on promoting green technology innovation.
Ecotourism resource management intelligent decision-making system has an impact on economic existence
H4: Ecotourism resource management intelligent decision-making system has a significant positive impact on job creation.
H5: The intelligent decision-making system of ecotourism resource management has a significant positive impact on promoting the development of traditional cultural industry.
H6: There is a significant positive impact of an intelligent decision-making system for ecotourism resource management on the development of training institutions.
H7: Ecotourism resource management intelligent decision-making system has a significant positive impact on promoting infrastructure development.
Questionnaire design is one of the important aspects of the empirical research in this paper, and it should be combined with the later data collation, proofreading, and statistics.Based on the literature review, this study refers to a number of mature questionnaire research results related to empirical research, and the preliminary design of the questionnaire contains the following four main parts:
Questionnaire for the part of intelligent decision-making system for ecotourism resource management, containing 25 items. Questionnaire on environmental impacts, containing 15 questions. The questionnaire for the economic impact section contains 20 items. The basic information of the questionnaire fillers, mainly including gender, age, education, occupation, years of working experience, job position, and monthly income, in 7 items. The first two parts of the questionnaire are measurement items using a 5-point Likert scale to measure the description of the management of the host destination, the view of sustainable tourism development, and the description of the awareness, with Option 1 indicating that the questionnaire filler completely disagrees, Option 2 indicating that the questionnaire filler does not agree, Option 3 indicating that the questionnaire filler is neutral, Option 4 indicating that the questionnaire filler is relatively agreeable, and Option 5 indicating that the questionnaire filler is strongly agreeable. The third section has a variety of options that do not overlap based on the question items.
The formal questionnaire survey of this paper was conducted from 1st August to 30th September 2023. The questionnaire was mainly distributed and collected at travel agencies, tourism enterprises, tourism colleges, and tourism authorities. This questionnaire is targeted at the survey population, mainly experts engaged in the tourism industry, including tour guides in travel agencies, teachers in tourism colleges and universities, executives in tourism enterprises and civil servants in tourism authorities. A total of 585 questionnaires were distributed in this research, and 527 questionnaires were finally recovered after eliminating the invalid questionnaires with fuzzy options, almost all of which chose the same answer or the answers were blank, with a recovery rate of 90.09%. 486 valid questionnaires were collected, with a validity rate of 92.22%.
Structural equation modelling (SEM) is a common analytical method that incorporates traditional multivariate statistics, i.e., an empirical, analytical model that measures multiple dependent variables, which includes regression analyses, factor analyses, t-tests, analyses of variance, and interaction models. This multivariate statistical method is based on a specific theory defining observable and unobservable variables in causal and relational models.
Structural equation modeling, also known as covariance structural analysis, is a method of analyzing the relationship between observed and latent variables using the covariance matrix. There are three main types of variables in the model: latent variables (which cannot be directly observed and measured), observed variables (which can be directly observed and measured), and error variables (the portion that fails to be explained). It consists of a measurement model (a total of two equations reflecting the relationship between the latent and observed variables) and a structural model (representing the causal relationship between the latent variables and the latent variables):
Where,
Structural equation modelling requires the steps of model setting (specifying variable relationships), model assumptions (establishing path relationships), model estimation, and model evaluation.
In addition, structural equation modelling is considered to be a robust statistical model because it can judge whether the model is acceptable or not by measuring the degree of compliance using different compliance metrics such as cardinality values (CMIN), cardinality degrees of freedom ratios (CMIN/DF), RMR, SRMR, RMSEA, GFI, AGFI, AIC, BIC, and CFI, among others, as its fitting metrics. Although there are a large number of fit indicators for structural equation modelling, different combinations of fit indicators can be used in different models to judge the fit of the model. In general, the fit acceptability of models is compared from the following 3 perspectives:
The chi-square value (CMIN) will be affected by the sample capacity. In general, the larger the sample size, the easier it is for the model to achieve a better fitting result. Therefore, in order to make up for this defect, the cardinal degrees of freedom ratio (CMIN/DF) is used as an alternative indicator. The smaller the CMIN/DF, the better the fit of the model. The specific fitting criteria for CMIN/DF are CMIN/DF<3, indicating that the model is a better overall fit. 3<CMIN/DF<5, indicating that the model is acceptable, but there is room for improvement. >10, indicates a very poor model fit. Asymptotic root mean square error (RMSEA) is less affected by the number of samples and is a better absolute fit indicator. The smaller the value of this indicator, the better the model fit. The fitting criterion of RMSEA is RMSEA>0.1, which indicates poor model fit.0.08<RMSEA<0.1, which indicates the acceptable model with common fit.0.05<RMSEA<0.08, which indicates good model fit.RMSEA<0.05, which indicates a very good model fit. Other fit indicators, such as goodness-of-fit indicator (GFI), comparative fit indicator (CFI) and adjusted goodness-of-fit indicator (AGFI). The values of these three fit indicators range from 0-1, and the standard is that the closer to 1, the better the fit of the model. Generally speaking, the value of these fit indicators is above 0.8, which can be regarded as an acceptable fit between the data and the theoretical model.
Structural equation modeling (SEM) analysis can roughly be divided into four processes: pre-determined model, constructed model, model fitting, and model correction. In this study, the structural equation model analysis was carried out by using AMOS24.0 software, and there are many methods for model parameter estimation, and this paper mainly used the great likelihood method to test the hypothetical constructed structural equation model in this study and to analyse the relationship between the hypothetical paths and the model fitness.
The initial model was tested by importing the questionnaire data into Amos 26.0, and the results of the model fit indices are shown in Table 2. Where the chi-square degrees of freedom ratio CMIN/DF = 1.692 < 3 is ideal. The main indices of the model fit GFI = 0.909, CFI = 0.872, AGFI = 0.898, which are all greater than 0.8, and RMSEA = 0.024 < 0.05. The model is generally well-fitted, so no further model corrections will be necessary.
Model fitting index results
| Fit index | Standard value | Statistical value | Suitability |
|---|---|---|---|
| CMIN/DF | CMIN/DF<3, ideal 3<CMIN/DF<5, acceptable | 1.692 | Yes |
| RMSEA | RMSEA <0.05, good RMSEA <0.08, acceptable | 0.024 | Yes |
| GFI | >0.8 | 0.909 | Yes |
| CFI | >0.8 | 0.872 | Yes |
| AGFI | >0.8 | 0.898 | Yes |
The results of the structural equation model path analysis are shown in Table 3, *** denotes p<0.001. The significance of the influence path is judged based on the p-value and the critical ratio (CR value). When p<0.05 and the absolute value of the critical ratio (CR value) is >1.96, it means that the influence of this relational path is significant. The seven hypotheses satisfy the test criteria, in which the ecotourism resource management intelligent decision-making system has the most significant positive impact on the conservation of natural resources. X11 has the most significant positive impact with a path coefficient of 0.559, followed by the impact on job creation X21 and enhanced environmental monitoring X12 with path coefficients of 0.491 and 0.487, respectively.
Analysis of the model path of the structural equation
| Path | Estimate | S.E. | C.R. | P | Hypothesis result |
|---|---|---|---|---|---|
| X11<---ERMIDS | 0.559 | 0.034 | 2.697 | *** | Support |
| X12<---ERMIDS | 0.487 | 0.011 | 2.362 | *** | Support |
| X13<---ERMIDS | 0.343 | 0.067 | 2.215 | *** | Support |
| X21<---ERMIDS | 0.491 | 0.068 | 2.347 | *** | Support |
| X22<---ERMIDS | 0.352 | 0.054 | 2.614 | *** | Support |
| X23<---ERMIDS | 0.374 | 0.019 | 2.293 | *** | Support |
| X24<---ERMIDS | 0.458 | 0.059 | 2.271 | *** | Support |
The combined test results show that the intelligent decision-making system for ecotourism resource management has a significant positive impact on both the environment and the economy. In terms of environmental benefits, the use of the ecotourism resource management intelligent decision-making system is conducive to the protection of natural resources, enhancement of environmental monitoring, and promotion of green technology innovation. In terms of economic benefits, ecotourism resource management can create employment opportunities, promote the development of local traditional cultural industries, promote the development of training institutions, and lead to infrastructure development.
Protection of natural resources and ecological environment
Protecting natural resources and the ecological environment is an important task for the sustainable development of human society. In the process of protecting natural resources and the ecological environment, the eco-tourism resource management intelligent decision-making system understands the status of natural resources and the quality of the ecological environment by strengthening environmental monitoring and data collection so as to provide the scientific basis for formulating reasonable protection measures. At the same time, it promotes the innovation and development of green technology to achieve sustainable economic development and environmental protection by reducing resource consumption and environmental pollution.
Promote economic development and provide employment opportunities
Ecotourism management can not only promote economic development but also create employment opportunities. The development of ecotourism drives the prosperity of tourism, promotes the development of related industries, and creates a large number of local employment opportunities. Ecotourism also promotes the protection and development of local cultural and traditional industries, providing residents with more employment opportunities. Ecotourism management has a greater demand for professional and skilled talents, which can promote the development of related education and training institutions, prompting them to cultivate more tourism professionals. The sustained development of ecotourism also drives the construction of related infrastructure, such as roads, transport, communications, etc., which creates a good environment for tourists to travel. Through scientific planning and effective management, the ecotourism resource management intelligent decision-making system can achieve the coordinated development of the economy, society and environment and improve the quality and competitiveness of ecotourism.
The study aims to design the function of the ecotourism resource management intelligent decision-making system, take the ecotourism environment evaluation of one of the core modules as an example, and use the XGBoost algorithm to construct the evaluation model for the study. On this basis, the theoretical model is established, and research hypotheses are put forward, combined with structural equation modelling to explore the impact of the ecotourism resource management intelligent decision-making system on the environment and economy.
Based on the data of ecotourism resources, the ecotourism resource management intelligent decision-making system combines statistics, data mining, computer technology and other travelogues, which can evaluate, analyse and predict the ecotourism resources, monitor the ecotourism environment and provide the basis for relevant decisions.
The accuracy and precision of the XGBoost ecotourism suitability evaluation model reached 88.38% and 88.99%, respectively, with an AUC value of 0.9621, reflecting improved performance in ecotourism environment assessment. In addition, the normalised vegetation index, average annual temperature and distance from the road were the three characteristic factors that contributed the most to the ecotourism environment evaluation, with importance level percentages of 26.75%, 12.70% and 8.25%, respectively.
The hypothesised paths of the structural equation model were all significant at the 0.001 level, and the hypotheses made in this paper were all verified, i.e., the intelligent decision-making system for ecotourism resource management has a dual-benefit impact on the environment and the economy. In the environmental dimension, it is reflected in the protection of natural resources, enhancement of environmental monitoring, and promotion of green technological innovation. The economic dimension manifests itself through the creation of employment opportunities, the promotion of traditional cultural industries, the development of training institutions, and infrastructure development. Among them, ecotourism resource management has the most obvious role in promoting natural resource conservation, with a path coefficient of 0.559.
The planning and management of ecotourism resources should be strengthened, tourist management and guidance should be carried out, community participation and cooperation should be mobilised, monitoring and evaluation should be emphasised, and coordination between environmental protection and ecotourism should be promoted to achieve sustainable development of ecotourism.