A Study on the Psychological and Behavioral Changes of Art Consumption in the Age of Artificial Intelligence
et
29 sept. 2025

À propos de cet article
Publié en ligne: 29 sept. 2025
Reçu: 14 janv. 2025
Accepté: 19 avr. 2025
DOI: https://doi.org/10.2478/amns-2025-1136
Mots clés
© 2025 Liwen Shi and Cong Peng, published by Sciendo.
This work is licensed under the Creative Commons Attribution 4.0 International License.
Figure 1.
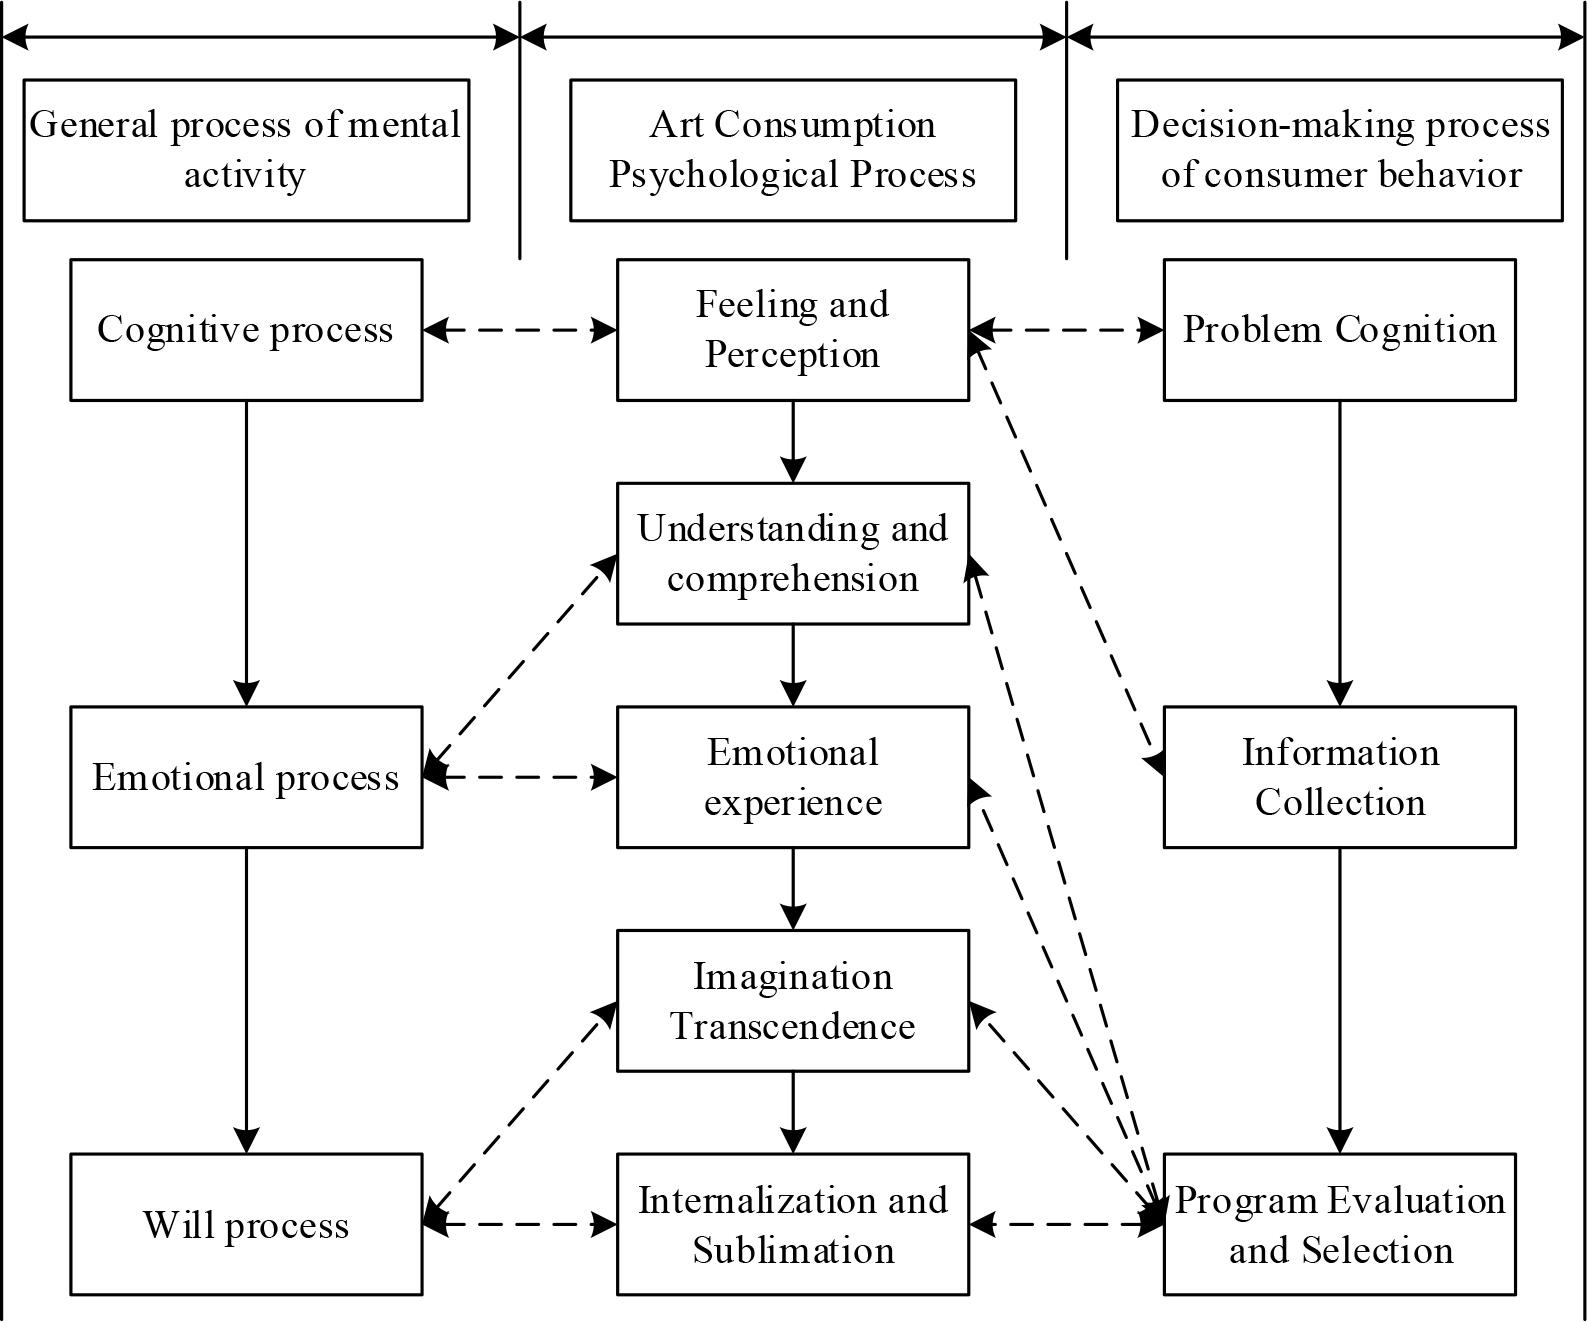
Figure 2.
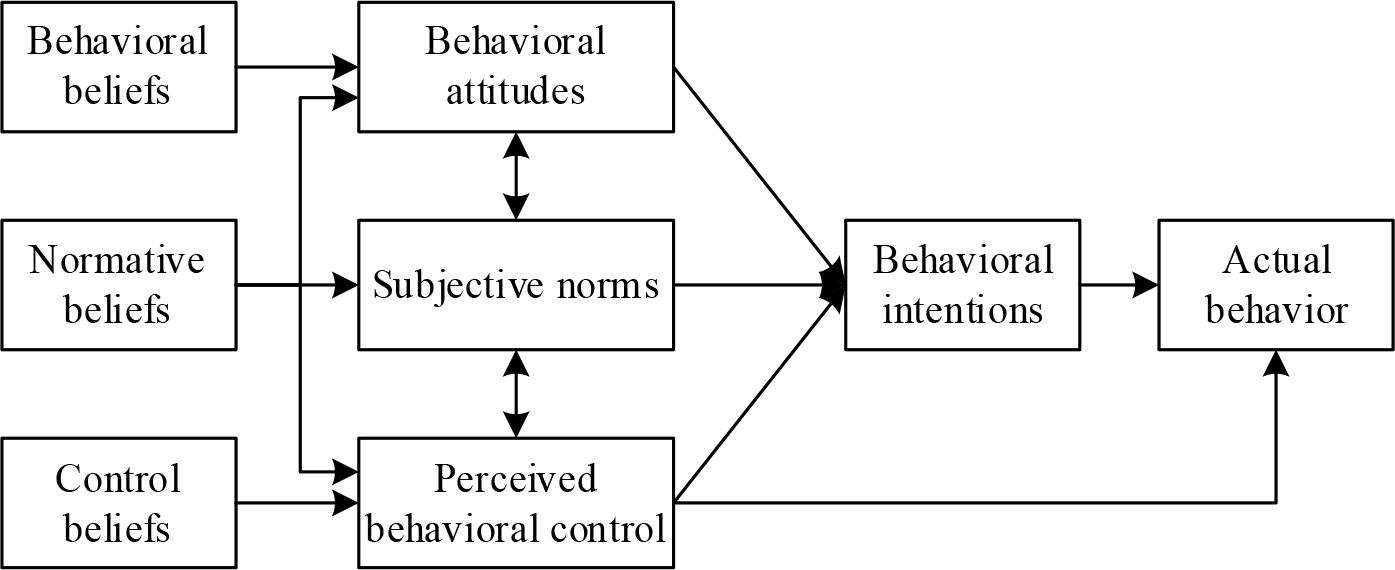
Figure 3.
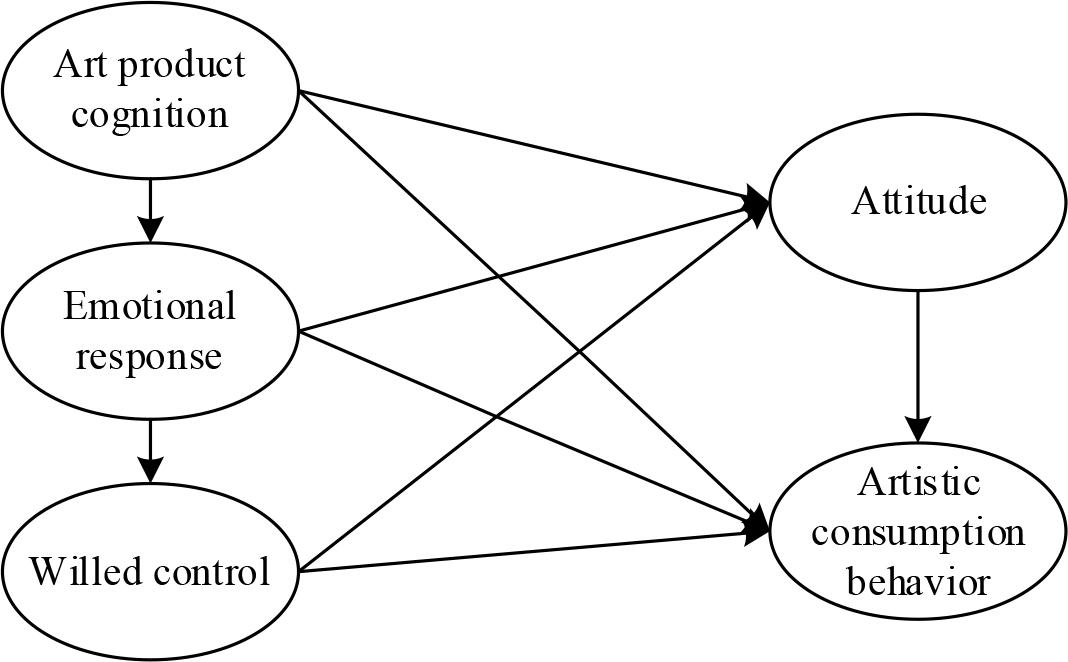
Figure 4.
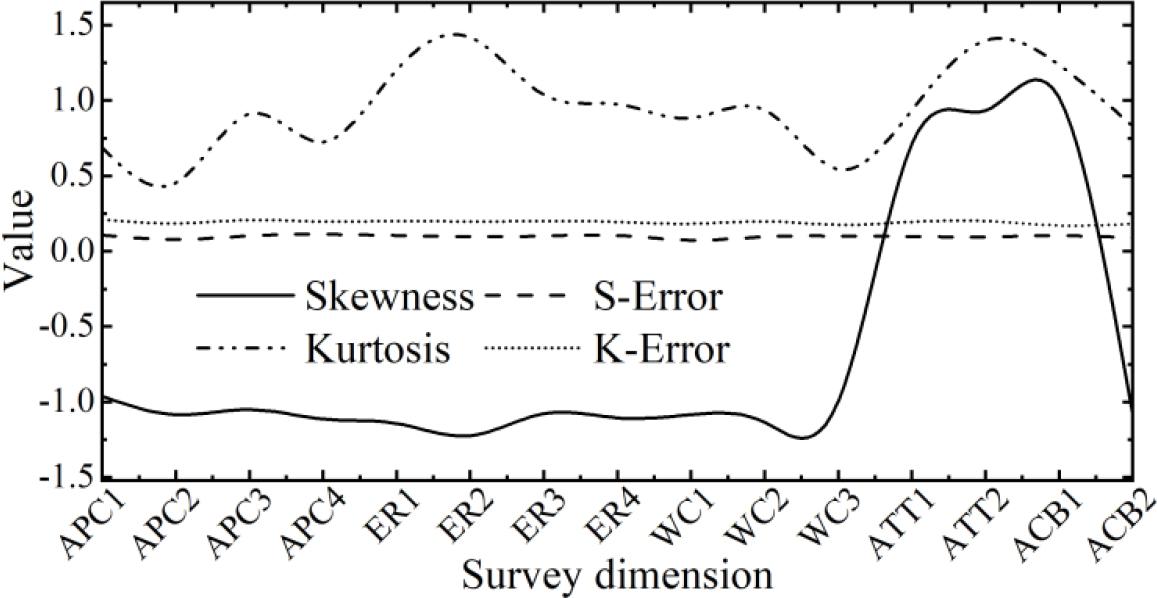
Figure 5.
The fitting degree of the structural equation model
| Index | Ideal value | Fitting value | Result |
|---|---|---|---|
| X2/df | <3.5 | 3.072 | Good |
| RMSEA | <0.09 | 0.061 | Good |
| GFI | >0.85 | 0.948 | Good |
| AGFI | >0.85 | 0.925 | Good |
| CFI | >0.85 | 0.879 | Good |
| IFI | >0.85 | 0.884 | Good |
| TLI | >0.85 | 0.906 | Good |
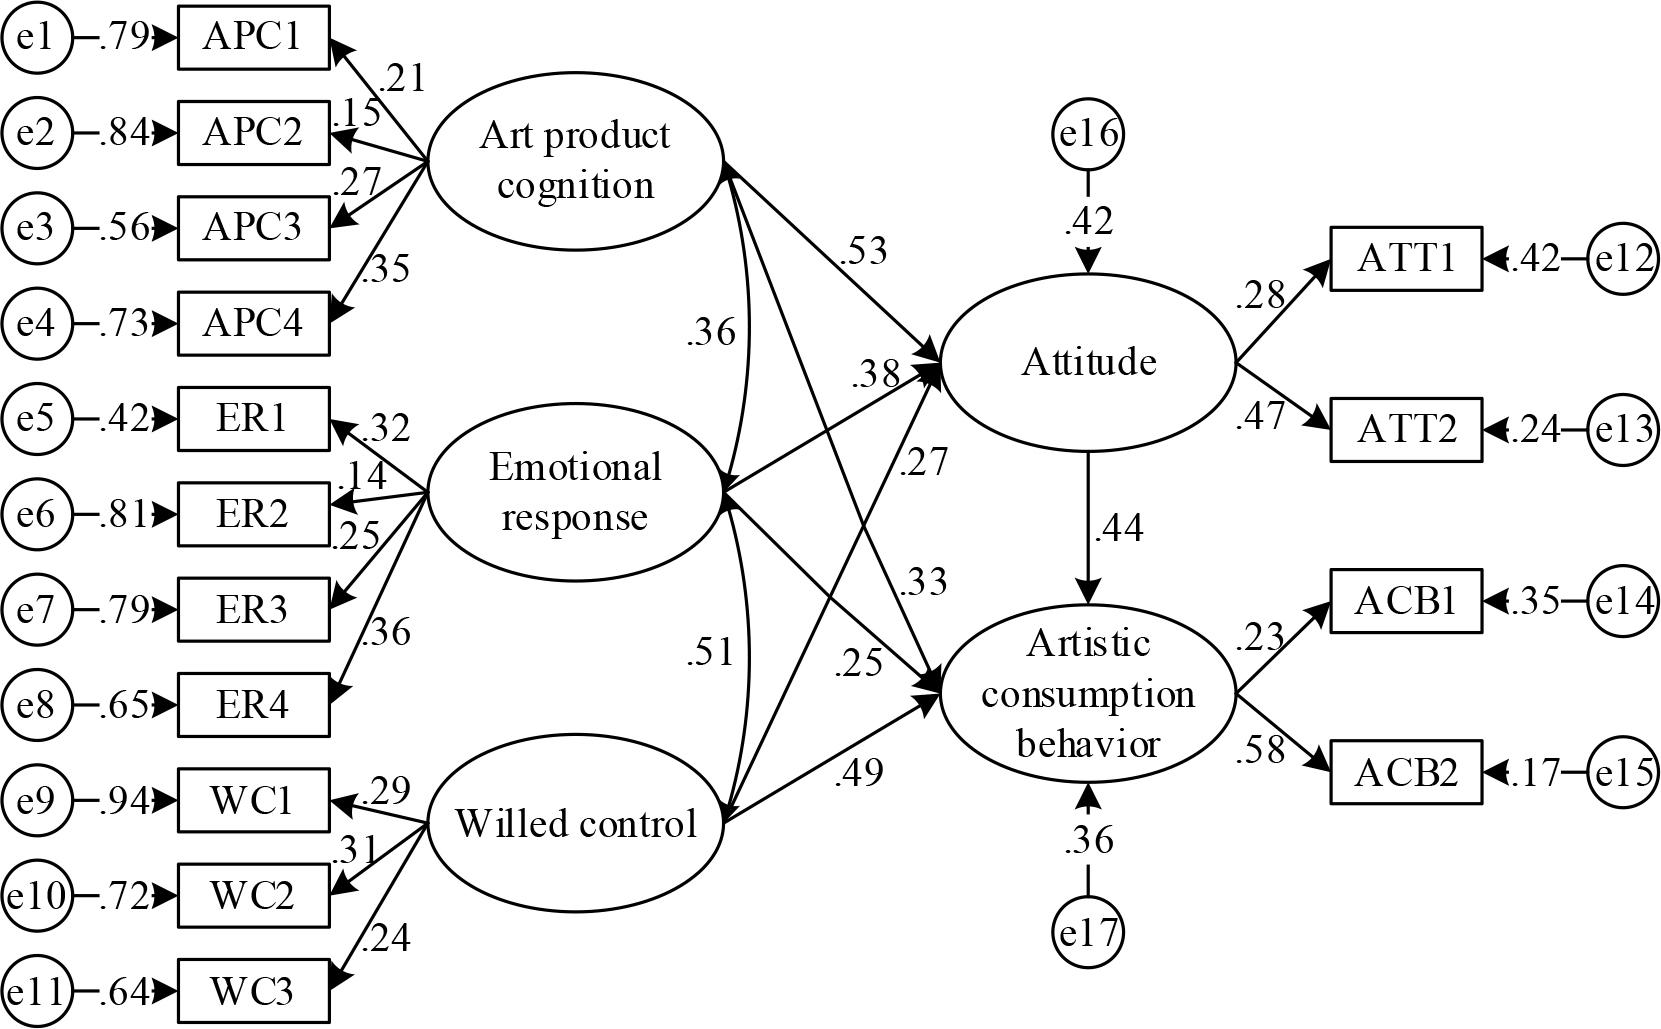
The path analysis of the structural equation
| Path | Effect | Estimate | S.E. | C.R. | P | Hypothe |
|---|---|---|---|---|---|---|
| APC→ATT | 0.528 | 0.272 | 0.057 | 9.728 | *** | Support |
| APC→ACB | 0.331 | 0.293 | 0.032 | 7.425 | *** | Support |
| APC→ER | 0.364 | 0.185 | 0.049 | 8.313 | ** | Support |
| ER→ATT | 0.379 | 0.368 | 0.061 | 7.904 | *** | Support |
| ER→WC | 0.512 | 0.176 | 0.043 | 7.672 | ** | Support |
| ER→ACB | 0.247 | 0.142 | 0.056 | 7.436 | ** | Support |
| WC→ATT | 0.273 | 0.157 | 0.048 | 8.141 | * | Support |
| WC→ACB | 0.486 | 0.194 | 0.034 | 7.617 | *** | Support |
| ATT→ACB | 0.439 | 0.126 | 0.051 | 9.473 | *** | Support |
Discriminant Validity results
| APC | ER | WC | ATT | ACB | |
|---|---|---|---|---|---|
| APC | - | - | - | - | |
| ER | 0.547*** | - | - | - | |
| WC | 0.505*** | 0.536*** | - | - | |
| ATT | 0.592*** | 0.528*** | 0.554*** | - | |
| ACB | 0.539*** | 0.591*** | 0.612*** | 0.636*** |
Indirect effect test results
| No. | Path | Effect value | S.E. | Bias-corrected 95%CI | ||
|---|---|---|---|---|---|---|
| Lower | Upper | P | ||||
| 1 | APC→ATT→ACB | 0.076 | 0.013 | 0.059 | 0.156 | 0.002 |
| 2 | ER→ATT→ACB | 0.083 | 0.021 | 0.101 | 0.183 | 0.005 |
| 3 | WC→ATT→ACB | 0.062 | 0.027 | 0.084 | 0.175 | 0.000 |
| 4 | APC→ER→WC | 0.094 | 0.038 | 0.136 | 0.428 | 0.001 |
Reliability analysis of questionnaire data
| Study variable | Code | CITC | Deletion | Cronbach α |
|---|---|---|---|---|
| Art product cognition (APC) | APC1 | 0.824 | 0.822 | 0.894 |
| APC2 | 0.721 | 0.845 | ||
| APC3 | 0.796 | 0.864 | ||
| APC4 | 0.748 | 0.816 | ||
| Emotional response (ER) | ER1 | 0.756 | 0.871 | 0.913 |
| ER2 | 0.827 | 0.908 | ||
| ER3 | 0.784 | 0.893 | ||
| ER4 | 0.851 | 0.885 | ||
| Willed control (WC) | WC1 | 0.709 | 0.932 | 0.948 |
| WC2 | 0.732 | 0.867 | ||
| WC3 | 0.758 | 0.898 | ||
| Attitude (ATT) | ATT1 | 0.812 | 0.861 | 0.885 |
| ATT2 | 0.864 | 0.872 | ||
| Artistic consumption behavior (ACB) | ACB1 | 0.896 | 0.847 | 0.862 |
| ACB2 | 0.763 | 0.835 |
Degree of model fit
| Study variable | Code | Std. | Estimate | S.E. | T | CR | AVE |
|---|---|---|---|---|---|---|---|
| Art product cognition (APC) | APC1 | 0.727 | 1.077 | 0.041 | 8.482*** | 0.866 | 0.702 |
| APC2 | 0.845 | 0.934 | 0.055 | 9.729*** | |||
| APC3 | 0.884 | 0.943 | 0.079 | 8.068*** | |||
| APC4 | 0.873 | 0.986 | 0.065 | 9.385*** | |||
| Emotional response (ER) | ER1 | 0.808 | 1.025 | 0.072 | 7.421*** | 0.892 | 0.689 |
| ER2 | 0.846 | 0.917 | 0.053 | 9.297*** | |||
| ER3 | 0.862 | 1.091 | 0.078 | 9.345*** | |||
| ER4 | 0.859 | 0.976 | 0.057 | 8.394*** | |||
| Willed control (WC) | WC1 | 0.773 | 0.967 | 0.079 | 8.883*** | 0.851 | 0.665 |
| WC2 | 0.806 | 1.079 | 0.063 | 8.569*** | |||
| WC3 | 0.835 | 0.983 | 0.051 | 8.627*** | |||
| Attitude (ATT) | ATT1 | 0.813 | 0.932 | 0.072 | 7.426*** | 0.873 | 0.714 |
| ATT2 | 0.722 | 0.997 | 0.045 | 8.652*** | |||
| Artistic consumption behavior (ACB) | ACB1 | 0.784 | 1.038 | 0.058 | 7.154*** | 0.904 | 0.683 |
| ACB2 | 0.741 | 0.946 | 0.063 | 7.645*** |
Direct effect test results
| Path | Effect value | S.E. | Bias-corrected 95%CI | ||
|---|---|---|---|---|---|
| Lower | Upper | P | |||
| APC→ATT | 0.528 | 0.057 | 0.083 | 0.189 | 0.005 |
| APC→ACB | 0.331 | 0.032 | 0.111 | 0.222 | 0.001 |
| APC→ER | 0.364 | 0.049 | 0.072 | 0.363 | 0.009 |
| ER→ATT | 0.379 | 0.061 | 0.089 | 0.214 | 0.002 |
| ER→WC | 0.512 | 0.043 | 0.064 | 0.157 | 0.004 |
| ER→ACB | 0.247 | 0.056 | 0.095 | 0.286 | 0.000 |
| WC→ATT | 0.273 | 0.048 | 0.051 | 0.181 | 0.001 |
| WC→ACB | 0.486 | 0.034 | 0.047 | 0.216 | 0.004 |
| ATT→ACB | 0.439 | 0.051 | 0.062 | 0.298 | 0.008 |
Frequency statistics of basic information
| Variable | Marking | Value | Frequency | Percentage |
|---|---|---|---|---|
| Sex | Male | 0 | 162 | 35.76% |
| Female | 1 | 291 | 64.24% | |
| - | Total | 453 | 100.00% | |
| Age | Under 20 | 0 | 93 | 20.53% |
| 20~28 | 1 | 277 | 61.15% | |
| 28~36 | 2 | 54 | 11.92% | |
| Over 36 | 3 | 29 | 6.40% | |
| - | Total | 453 | 100.00% | |
| Education level | Specialty | 0 | 62 | 13.69% |
| Undergraduate | 1 | 254 | 56.07% | |
| Master | 2 | 128 | 28.26% | |
| Doctor | 3 | 9 | 1.99% | |
| - | Total | 453 | 100.00% |
The specific content of the questionnaire
| Study variable | Measurement dimension | Code |
|---|---|---|
| Art product cognition (APC) | Marketing activities | APC1 |
| Past behavior | APC2 | |
| Aesthetic perception | APC3 | |
| Aesthetic demand | APC4 | |
| Emotional response (ER) | Aesthetic expectation | ER1 |
| Aesthetic understanding | ER2 | |
| Aesthetic creation | ER3 | |
| Aesthetic experience | ER4 | |
| Willed control (WC) | Subjective specification | WC1 |
| Perceived risk | WC2 | |
| Perceptual control | WC3 | |
| Attitude (ATT) | Cognitive attitude | ATT1 |
| Emotional attitude | ATT2 | |
| Artistic consumption behavior (ACB) | Purchase intention | ACB1 |
| Introductory intention | ACB2 |
Independent T-test on sex
| Dimension | Variance | Levene test of variance | T test of the mean variance | |||
|---|---|---|---|---|---|---|
| F | Sig | T | df | Sig(2-tailed) | ||
| APC | Equality | 3.487 | 0.072 | -3.127 | 226 | 0.002 |
| Inequality | - | - | -3.068 | 159.42 | 0.008 | |
| ER | Equality | 5.369 | 0.005 | -3.574 | 226 | 0.006 |
| Inequality | - | - | -3.329 | 161.28 | 0.001 | |
| WC | Equality | 8.523 | 0.047 | -3.306 | 226 | 0.006 |
| Inequality | - | - | -3.215 | 179.36 | 0.000 | |
| ATT | Equality | 4.759 | 0.003 | -3.768 | 226 | 0.007 |
| Inequality | - | - | -3.591 | 162.51 | 0.003 | |
| ACB | Equality | 9.612 | 0.000 | -4.035 | 226 | 0.000 |
| Inequality | - | - | -3.884 | 165.84 | 0.009 | |