A Study on the Psychological and Behavioral Changes of Art Consumption in the Age of Artificial Intelligence

Publié en ligne: 29 sept. 2025
Reçu: 14 janv. 2025
Accepté: 19 avr. 2025
DOI: https://doi.org/10.2478/amns-2025-1136
Mots clés
© 2025 Liwen Shi and Cong Peng, published by Sciendo.
This work is licensed under the Creative Commons Attribution 4.0 International License.
With the rapid development of China’s economy, people’s material life significantly improved, and began to tend to the development and improvement of the spiritual realm, culture and art consumption has become the main part of spiritual life [1]. Currently, the reality of the development of the art industry is focused on the pursuit of economic benefits effectiveness, ignoring the real psychology of the consumer’s heart for culture and art consumption, which is very unfavorable to the long-term development of the art industry [2]. In view of this situation, this paper analyzes the changes in the consumption psychology and behavior of art consumers in the era of artificial intelligence, the internal relationship between the two, understands the changes in the aesthetic concept of art among the mass consumer groups, grasps the characteristics of the psychological structure and behavior of mass cultural consumption, and tries to discover new “advantageous factors” that affect the production and consumption of the art industry, which can provide a new direction and more feasible suggestions for adapting to the current development of China’s art industry [3-7].
Artificial Intelligence, as a disruptive technological revolution, has had a great impact on people’s way of life and the way of thinking to perceive the world, because AI has the attribute of reducing uncertainty, which has made big data highly valued by governments, research organizations, the media, the business community, and the general public [8-11]. In the existing research, relatively few studies have combined art consumer psychology and behavior with artificial intelligence. And the research on consumer behavior and psychology relies too much on traditional theories and methods of marketing, psychology, and behavior, mostly in model exploration and its influencing factors [12-15]. The frontier of research on consumer psychology and behavior analysis models based on artificial intelligence focuses on the use of advanced technologies such as deep learning, natural language processing, and recommender systems to reveal the changes, laws, and trends behind consumer behavior [16-18]. On the one hand, researchers have leveraged deep learning technology to perform deep learning and feature extraction on massive consumer data to achieve deep understanding and modeling of consumer behavior [19-21]. On the other hand, sentiment analysis and theme modeling of consumer comments and feedback are performed by natural language processing technology to mine consumer preferences and needs, providing powerful support for personalized recommendation and marketing strategy optimization [22-25].
The public in the art consumption behavior shows the consumption characteristics of pushing individuality, the vast majority of people will pursue personal spontaneous freedom, often can be able to intuitively reflect their psychological and personality characteristics. This paper proposes a research method of art consumption psychology and behavioral change based on the theory of planned behavior and structural equation modeling. Based on the Theory of Planned Behavior, it quantifies the art consumption psychology from three dimensions: art product cognition, emotional response and volitional control, and introduces attitude as a mediator variable, so as to explore the correlation between the art consumption psychology and the change of consumption behavior. Based on the data obtained from the questionnaire, the quantitative analysis of the data was carried out in terms of the dimensions of reliability and validity, model fit, influence path, and mediating effect.
China’s society and economy are undergoing profound changes in the transition to a market economy, and the impact of the market economy on art is a quiet revolution that realizes a profound transformation of people. Art production exists for spiritual consumption, and it is more influenced by people’s subjective art consumption psychology, thus affecting the changes of their consumption behavior.
As a part of the socialization process of art production, art consumption has an inseparable relationship with social psychology. On the surface, art consumption behavior seems to be determined by the subjective tendency of consumers, but in fact it contains a very complex social and cultural background. Each consumer lives in a certain social and cultural environment, its aesthetic concepts, consumer interest, consumer psychology, consumer behavior and so on inevitably by the influence of the social and cultural environment [26]. Therefore, the emergence of a certain consumption tendency has its specific social psychology, cultural atmosphere, values and other reasons.
The herd mentality of art consumption. Herd is a social psychological and behavioral phenomenon prevalent in social life. Social psychology is a kind of group psychology popular in the society, once formed, it will quickly diffuse in the society, and become a kind of general psychological tendency and psychological state. The group’s behavior, values, aesthetic interests and emotional state will force individuals to show attitudes and behaviors consistent with the group. Reverse psychology of art consumption. The so-called reverse psychology of art consumption is a kind of negative aesthetic psychological reaction between the psychological demand of the consumer subject and the contradiction between the psychological supply of art works or art producers. If the art consumption of crowd psychology is a kind of “with the crowd” of consumer behavior, then the reverse psychology reflects the consumer and social opinion “against” the independent consciousness. In the art consumption activities, consumers of works of art to produce the phenomenon of reverse psychology is often occurring. The psychology of seeking differences in art consumption. Art consumption of the psychology of seeking differences, requires that works of art must have originality, novelty and other characteristics, from the content to the form should give people a different and fresh feeling. In the art consumption activities, consumers show the consumer psychology and aesthetic interest of constantly seeking new changes, the evolution of the development of art and popular trends have a role that can not be ignored.
Art consumption behavior is different from the general commodity consumption behavior, the general commodity consumption results mainly in the use of goods, wear and tear, loss and transfer, the consumer does not require high, the use of the utility of the change is not big. Art consumption is both a material consumption, he needs to pay money and so on in order to get the right of ownership or use. At the same time, art consumption is also spiritual consumption. Most of the art consumer goods are the precipitation of culture, history, thinking, etc. or the condensation of spiritual culture, with very strong cultural and social information. Art consumers need to have a certain degree of professionalism and experience, with the help of the consumer’s analysis, reasoning, association, imagination and experience and other logical or image thinking, through the consumer’s re-creation to complete the final consumer experience. At the same time, consumers through the experience of art consumer goods, can form their own thoughts and understandings, so as to subconsciously influence the thinking and behavior of consumers.
Art consumption is characterized by spirituality, abstraction, conceptualization, symbolism, etc. What consumers buy is often not the art object itself, but the symbolic meaning behind it. The shallow motivation of art consumption is personal preference, and the deeper motivation is to show off one’s own distinctive personality or reflect one’s own social class, economic wealth, education, cultural wealth and art social circle, etc., which has the characteristic of showing off.
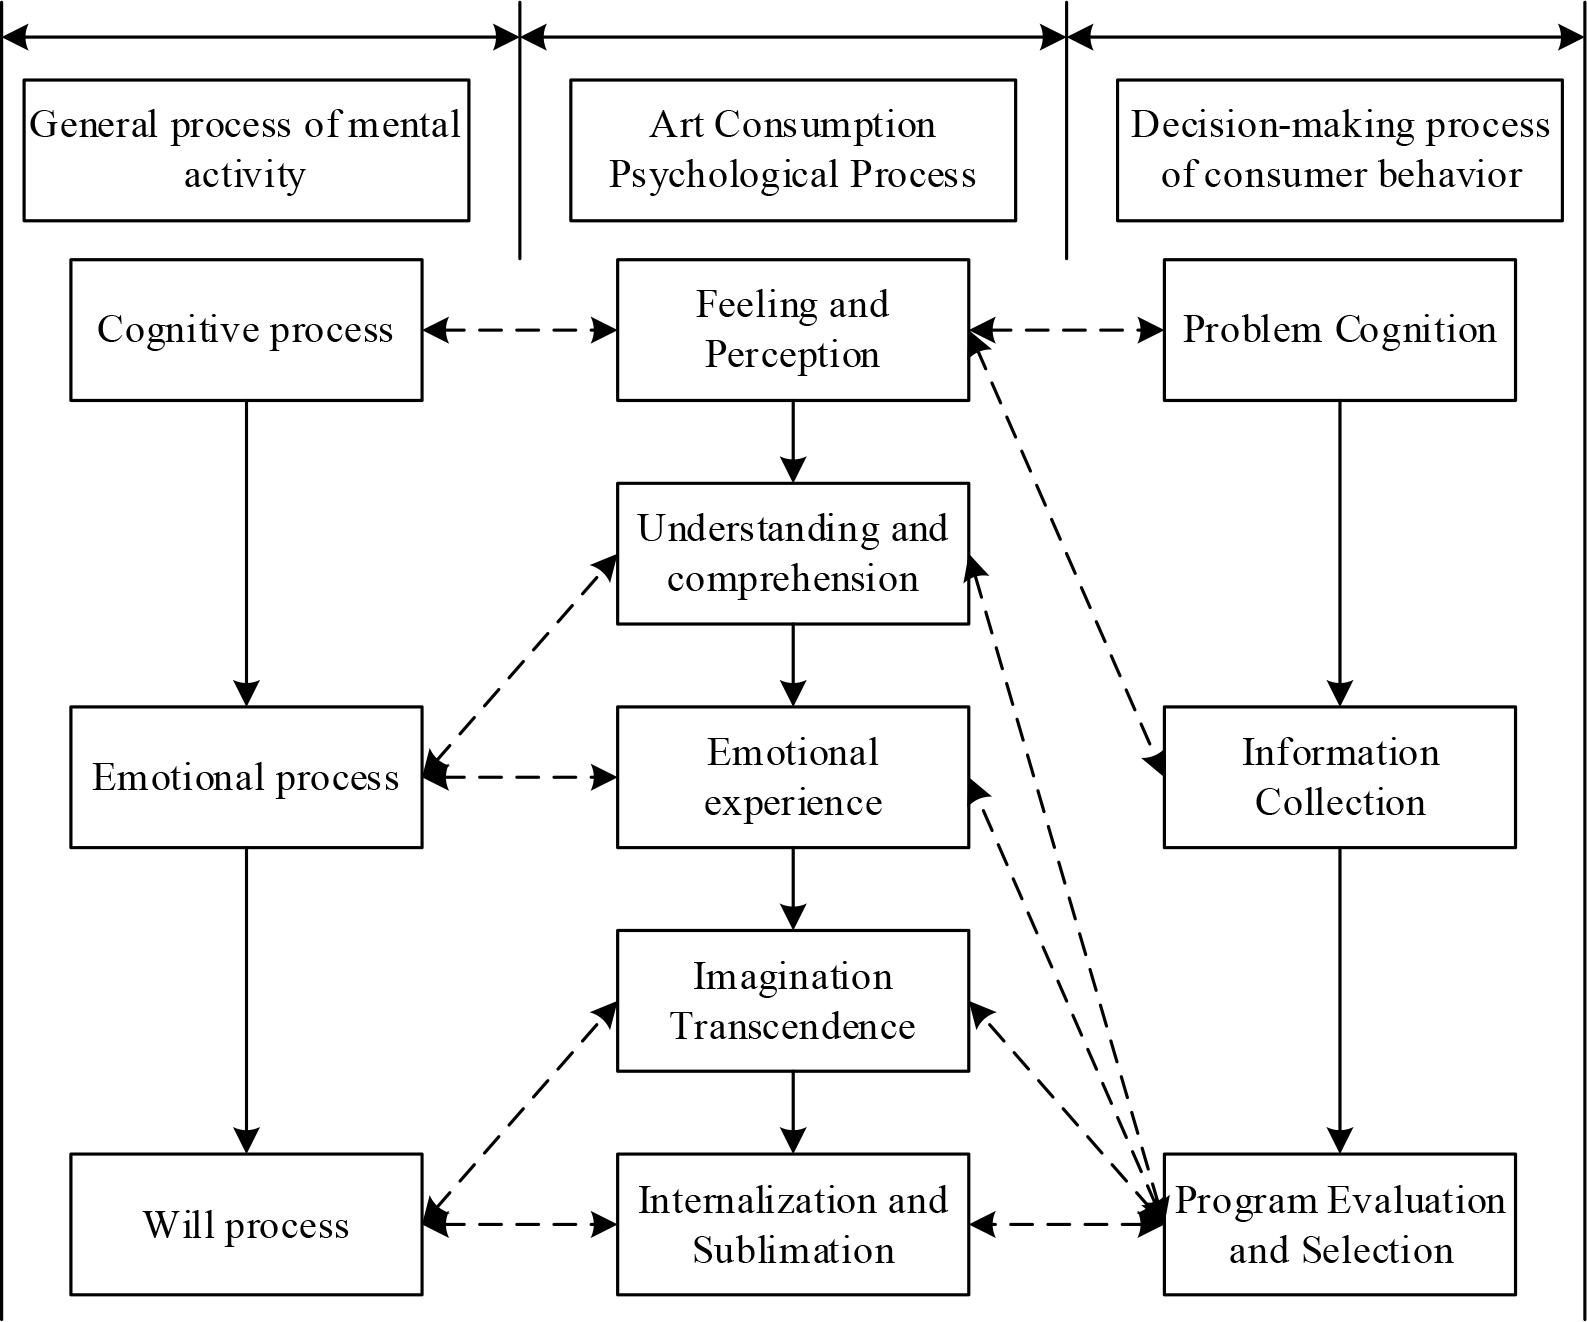
Art consumption is a kind of spiritual product consumption activity, and there are both close links and significant differences between the psychological process of art consumption and the psychological process of general consumer behavior decision-making. Therefore, comparing the psychological process of art consumption and the psychological process of general consumption behavior decision-making is very useful for the study of the psychological process of art consumption. Figure 1 shows the mapping relationship between the psychological process of art consumption and the change of consumption behavior. There is a mapping relationship between the “perception” stage of the psychological process of art consumption and the “problem recognition” and “information gathering” stages of the psychological process of decision-making in consumer behavior. The stage of “option evaluation and selection” in the psychological process of decision-making in consumer behavior can be divided into two stages: “option evaluation” and “option selection”.
Changes in the psychology and behavior of art consumption
Art consumer objects bring art consumers aesthetic information, and art consumers’ perception of aesthetic information can be obtained through the physical form of art consumer objects. Art consumers’ perception of aesthetic information can be obtained through the physical form of the art consumption object, or through art consumers’ existing internal aesthetic psychological stereotypes and aesthetic mindset, as well as past aesthetic experience, or from the marketing activities of art marketers. The “problem cognition” in the decision-making process of consumer behavior includes the cognition of aesthetic needs and the recognition of art product attributes. Based on problem cognition, consumers collect information to complete the information needed to satisfy their needs.
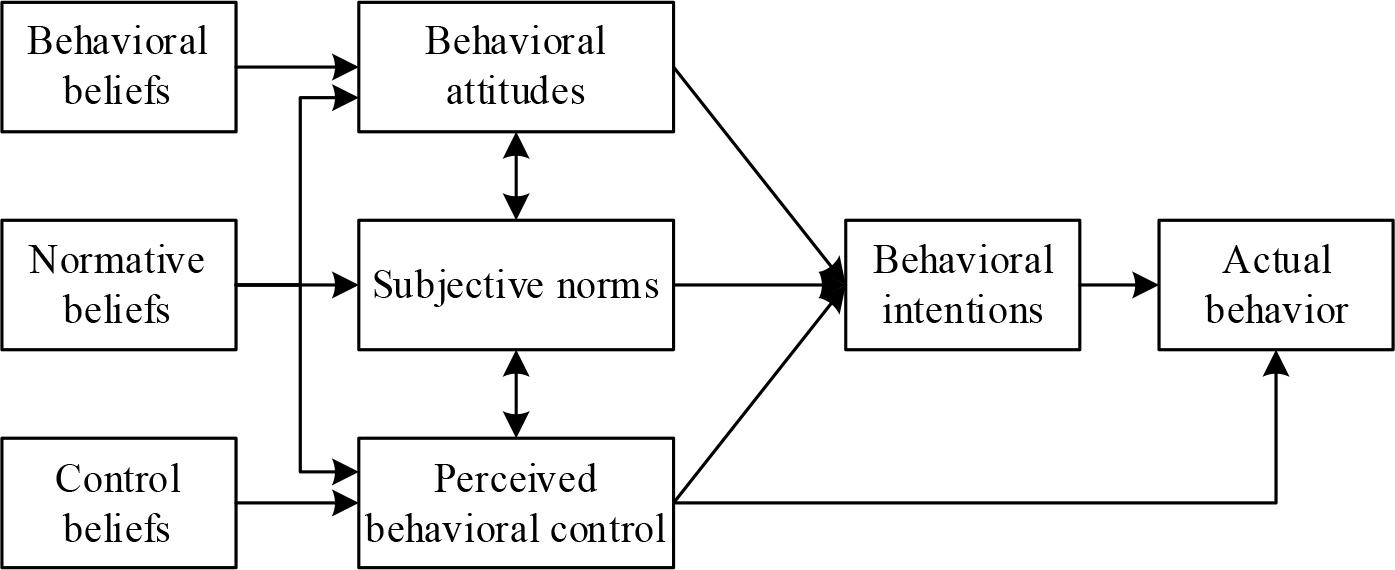
Social psychology was first defined as the science of attitudes, and attitudes are central to the study of this discipline. In the early research literature, the idea that behavioral attitudes determine individual behavior was unquestioned. The Theory of Planned Behavior (TPB) suggests that behavior is not only explained and predicted by behavioral attitudes, but also depends on behavioral intentions and perceptual behavioral control, and that behavioral attitudes, subjective norms, and perceptual behavioral control influence behavioral intentions [27]. At the same time, the degree of actual control over behavior can largely influence an individual’s behavior, and thus perceptual-behavioral control also directly affects individual behavior. The structural model of TPB is shown in Figure 2.
TPB structure model
TPB argues that behavioral intentions are primarily determined by behavioral attitudes and perceptual-behavioral control, and are also influenced by subjective norms. Behavioral attitudes are an individual’s assessment of how much he or she likes or dislikes performing a particular behavior and are primarily influenced by behavioral beliefs. Perceived behavioral control is the perception of the factors involved in performing a behavior, including control beliefs and perceived intensity. Subjective norms are the subjective pressures that individuals feel when deciding whether or not to perform a particular behavior and are determined by normative beliefs.
Structural Equation Modeling (SEM) is a widely used multivariate statistical technique, where the researcher is able to describe the variables and parameters of interest through a statistical model, and then estimate and analyze them, which is the so-called model definition of SEM. Through model definition, the researcher can clarify the relationship between theories and concepts, and complete all the evaluation and statistical decisions through statistical analysis procedures [28].
A structural equation model usually contains both structural and measurement modeling components. The interrelationships between latent variables are represented in the structural model, and the causal relationships between latent variables are discussed through path analysis. The interrelationships between observed variables and latent variables are represented in the measurement model to come to each other, which can measure the relationship between observed variables and latent variables and constitute a validated factor analysis in the mathematical model.
In the structural model, the causal relationship between the outer and inner latent variables is solved by a series of linear equations. The external and internal latent variables are expressed as follows:
where
The measurement model is a correlation between observed and structural variables and generally contains two forms, namely the relationship between the inner latent variable
where Reactivity indicator path The linear expression for the correlation between the latent and observed variables is:
This is based on the fact that latent variables are a substrate construct that produces certain phenomena or things that are observed and are indicators that reflect such latent variables.
Formative indicator path Formative indicator path, is the latent variable is affected by the observed variable, that is, the latent variable is the effect caused by the observed variable. Its expression is:
There are many kinds of methods to assess the changes in art consumption psychology and consumption behavior, and structural equation modeling better reflects the theory of planned behavior, the causal relationship between art consumption psychology and the relevant variables of consumption behavior, and is closer to the essence of art consumption psychology and behavioral changes.
Consumers with herd mentality always hold the attitude and thought of “law is not responsible for the masses”, and lack of their own identification of the required items, and choose to blindly follow the trend in the process of consumption. For art consumption behavior, it will also be affected by a certain crowd psychology, and art consumption psychology includes the crowd psychology. There is an obvious correlation between art consumption psychology and changes in consumption behavior, and exploring the relationship between the two can help further standardize art consumption behavior.
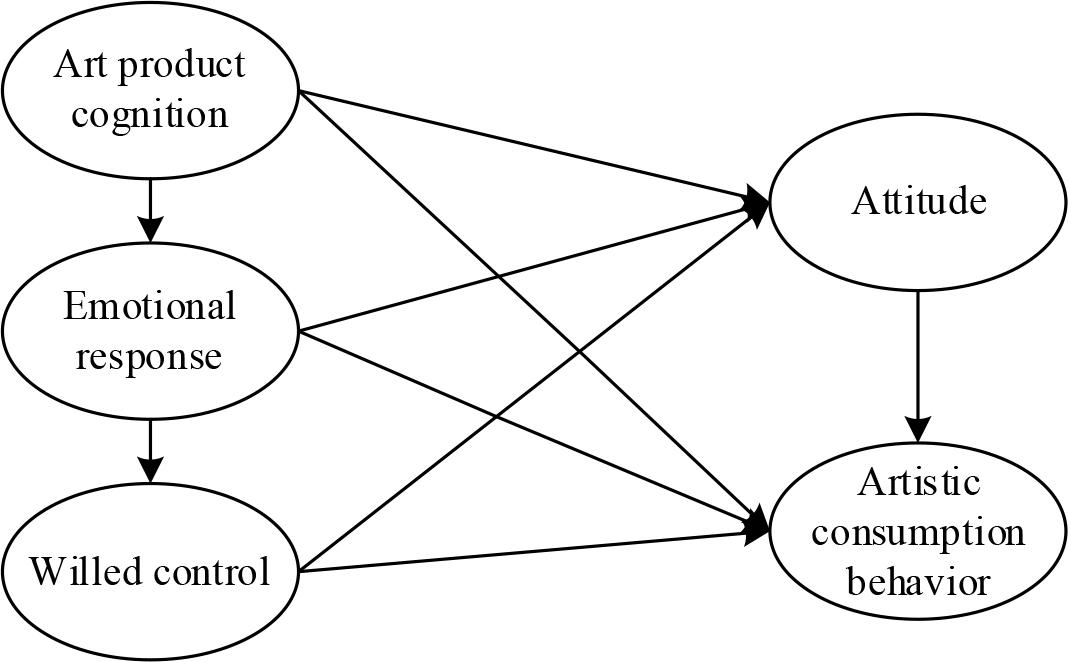
Art product cognition is the consumer’s awareness of art products, which is more supported by the consumer’s subjective consciousness. Attitude is the effective performance of consumers in the cognition of art products, which can make consumers in the process of art product cognition can be effectively enhanced. Emotional response is based on consumers’ art product cognition, combined with the herd mentality, the psychology of seeking differences and other mechanisms to produce a psychological response to the attitude and art consumption behavior intention. Will control is the efforts made by consumers to realize the intention of consumption behavior under the change of art consumption psychology, and the change of art consumption behavior intention can be realized only by combining the will control after the cognition of art products and emotional reaction. Combined with the relevant analysis of the previous paper, this paper puts forward the following hypotheses:
H1: There is a positive influence of art product cognition on attitude.
H2: There is a positive influence of art product cognition on art consumption behavior intention.
H3: There is a positive influence of art product cognition on emotional response.
H4: There is a positive effect of emotional reaction on attitude.
H5: There is a positive effect of emotional reaction on volitional control.
H6: There is a positive effect of emotional response on art consumption behavioral intention.
H7: There is a positive effect of volitional control on attitude.
H8: There is a positive effect of volitional control on art consumption behavioral intention.
H9: There is a positive influence of attitude on art consumption behavior intention.
H10: There is a mediating effect of attitude between art product awareness, emotional reaction, volitional control and art consumption behavior intention.
H11: There is a mediating effect of emotional reaction between art product cognition and volitional control.
Based on the above analysis of the assumptions about art consumption psychology and consumption behavior, combined with the theory of planned behavior and structural equation modeling given in the previous section, this paper constructs a conceptual model of art consumption psychology and consumption behavior change, and its specific framework is shown in Figure 3. The factor of “attitude” is not only an art consumption behavior factor that can be measured independently, but also a comprehensive factor that is closely related to the preceding psychological factors of consumption behavior, and at the same time has a connection with some of the subsequent factors of consumption behavior. Therefore, the variable of “attitude” is extracted separately and included in the structural model of the formation mechanism of art consumption behavioral intention.
The mechanism of the formation of art consumption behavior
In order to effectively analyze the relationship between art consumption psychology and changes in consumption behavior, this paper is based on the theory of planned behavior as the basis for questionnaire design, with reference to the questionnaire design experience of existing related studies, so as to construct a questionnaire on art consumption psychology and changes in consumption behavior, whose specific content is shown in Table 1. In order to avoid consumers’ boredom with filling out the questionnaire, and also to ensure the validity of the study, thus this study designed more than three question items for each variable, and a total of five latent variables such as art product cognition, emotional response, volitional control, attitude, and art consumption behavioral intention were designed.
The specific content of the questionnaire
| Study variable | Measurement dimension | Code |
|---|---|---|
| Art product cognition (APC) | Marketing activities | APC1 |
| Past behavior | APC2 | |
| Aesthetic perception | APC3 | |
| Aesthetic demand | APC4 | |
| Emotional response (ER) | Aesthetic expectation | ER1 |
| Aesthetic understanding | ER2 | |
| Aesthetic creation | ER3 | |
| Aesthetic experience | ER4 | |
| Willed control (WC) | Subjective specification | WC1 |
| Perceived risk | WC2 | |
| Perceptual control | WC3 | |
| Attitude (ATT) | Cognitive attitude | ATT1 |
| Emotional attitude | ATT2 | |
| Artistic consumption behavior (ACB) | Purchase intention | ACB1 |
| Introductory intention | ACB2 |
The questions in the questionnaire used Likert’s five-point scale, and the response options were designed according to the specific questions, and because the direction of the influence of each question on the intention to consume art is positive, they were assigned a value from 1 to 5, where 1 represents the least relevant and the lowest influence on the intention to consume art positively, and 5 represents the highest influence on the intention to consume art.
The survey object of this paper is consumers who have purchased calligraphy and painting artworks, and considering that the selected samples should be representative to avoid problems such as overly homogeneous user characteristics, the objects of this survey mainly include enterprise employees, government or institutional employees, professionals and so on.
The distribution time of the questionnaire in this paper mainly focuses on the period between August 15 and September 5, 2024, and the form of distribution is based on the field distribution of paper questionnaires, supplemented by online questionnaires. Among them, the field distribution of questionnaires is mainly in galleries, art museums, art fairs and other art consumption places. Meanwhile, during the field distribution of questionnaires, necessary communication was made to the respondents, and reasonable explanations were given to ensure the validity of the questionnaires. The online questionnaire survey utilizes the Questionnaire Star platform to create an electronic version of the questionnaire, and invites people who have purchased calligraphy and painting artworks to fill out the online questionnaire through WeChat, e-mail and other channels.
In order to ensure the validity of the data, the recovered questionnaires were screened:
Excluding the vast majority of questionnaires with the same answers. The questionnaires with incomplete answers were excluded. Excluding questionnaires that were filled out for too short a period of time.
A total of 300 paper questionnaires were distributed, 286 were recovered, and 272 were valid questionnaires. On the Internet, 200 questionnaires were filled out, 189 were recovered, and 181 were valid. In total, 500 questionnaires were distributed, 475 questionnaires were recovered, and 453 questionnaires were valid, the recovery rate of the questionnaires was 95%, and the recovery rate of the valid questionnaires was 90.6%.
Accompanied by the development of the Internet intelligent era, art products have rapidly become a phenomenal fashion product chased and consumed by the public. Art products in the process of development to better meet the public aesthetic, to a certain extent, breaking the barriers between traditional art and modern life. Art consumption to attract the public to better carry out consumption behavior, for the innovation of art consumption mode has a profound significance of the times and social value.
After organizing and entering the collected art consumption behavior questionnaire data, SPSS software was used to statistically analyze the basic information of the data, and the basic information count frequency statistics were obtained as shown in Table 2. Among the subjects participating in the survey, the number of male and female students is 162 and 291 respectively, each accounting for 35.76% and 64.24% of the proportion of the overall sample. In terms of age, there are 93 survey respondents under 20 years old, 277 survey respondents aged 20 to 28 years old, accounting for the largest proportion of 61.15%, 54 survey respondents aged 28 to 36 years old, and the smallest proportion of survey respondents aged 36 years old or older, only 6.4%. Considering that the main survey respondents are the group of college students, the age group of 20 to 28 years old is in line with the age characteristics of the college student group. It is reasonable that the age of junior students is below 20 years old, and since the survey respondents include master’s degree students and doctoral students, the sample of 20 to 28 years old has a certain size, which is also reasonable. In terms of education level, the number of undergraduates and masters is relatively large, which also indicates to a certain extent that the group with higher education level has more artistic literacy and will also carry out certain changes in art consumption behavior driven by art consumption psychology.
Frequency statistics of basic information
| Variable | Marking | Value | Frequency | Percentage |
|---|---|---|---|---|
| Sex | Male | 0 | 162 | 35.76% |
| Female | 1 | 291 | 64.24% | |
| - | Total | 453 | 100.00% | |
| Age | Under 20 | 0 | 93 | 20.53% |
| 20~28 | 1 | 277 | 61.15% | |
| 28~36 | 2 | 54 | 11.92% | |
| Over 36 | 3 | 29 | 6.40% | |
| - | Total | 453 | 100.00% | |
| Education level | Specialty | 0 | 62 | 13.69% |
| Undergraduate | 1 | 254 | 56.07% | |
| Master | 2 | 128 | 28.26% | |
| Doctor | 3 | 9 | 1.99% | |
| - | Total | 453 | 100.00% |
In AMOS, various estimation methods such as maximum likelihood estimation, asymptotic distribution-free estimation, and generalized least squares are provided for structural equation estimation. Maximum likelihood estimation achieves the smallest standard error of the parameters among many estimation methods as the sample size increases, but it is not suitable when the data are extremely distributed and seriously deviate from normality. The asymptotic distribution-free estimation method is a parameter robust estimation method that does not need to consider the distribution of the variables in the case of large samples, and the generalized least squares method can be used for non-normal data with a relatively short computing time.
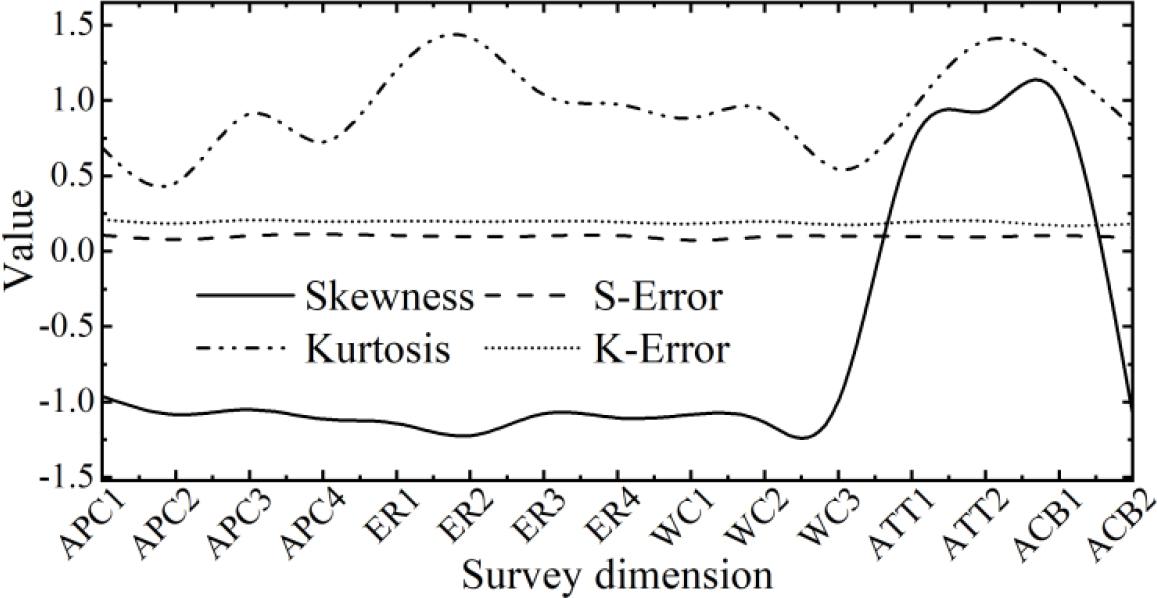
In this paper, the effective sample data obtained in the survey process is 453, which is not a large sample, and it is not appropriate to use the asymptotic distribution-free estimation method to estimate the parameters, and then carry out the normality test on the questionnaire data in order to choose the appropriate parameter estimation method. The results of the normality test are shown in Figure 4. For the determination of normality of the survey data, if the absolute value of the skewness coefficient of the variable is greater than 2 and the absolute value of the kurtosis coefficient is greater than 6, the sample data is determined to be non-normally distributed. As can be seen from the figure, this paper in the art consumption behavior survey data acquisition, the absolute value of the skewness coefficient of all variables in the questionnaire is less than 2, and the absolute value of the kurtosis coefficient is much less than 6. Therefore, it can be determined that the sample data of the art consumption behavior acquired in this paper passes the normality test, and the data is approximately normally distributed, and the maximum likelihood method is selected to estimate the parameters of the structural equation model in the latter part of the paper.
Normal test results
When the answers to the question options are less than or equal to two questions, the independent samples t-test is generally chosen in order to study the differences. When the level of significance of the analyzed results, i.e. Sig is less than 0.05 then it indicates that the data does not have variance chi-square and Sig value is greater than 0.05 indicates variance chi-square. Therefore read the value of Sig (two-sided) in which variance chi-square is assumed, and this value less than 0.05 indicates that there is a significant difference, and greater than 0.05 does not exist. Since there are only two options for the answer to the question of gender only in the questionnaire of art consumption behavior intention, an independent samples t-test was conducted for gender, and the specific results are shown in Table 3.
Independent T-test on sex
| Dimension | Variance | Levene test of variance | T test of the mean variance | |||
|---|---|---|---|---|---|---|
| F | Sig | T | df | Sig(2-tailed) | ||
| APC | Equality | 3.487 | 0.072 | -3.127 | 226 | 0.002 |
| Inequality | - | - | -3.068 | 159.42 | 0.008 | |
| ER | Equality | 5.369 | 0.005 | -3.574 | 226 | 0.006 |
| Inequality | - | - | -3.329 | 161.28 | 0.001 | |
| WC | Equality | 8.523 | 0.047 | -3.306 | 226 | 0.006 |
| Inequality | - | - | -3.215 | 179.36 | 0.000 | |
| ATT | Equality | 4.759 | 0.003 | -3.768 | 226 | 0.007 |
| Inequality | - | - | -3.591 | 162.51 | 0.003 | |
| ACB | Equality | 9.612 | 0.000 | -4.035 | 226 | 0.000 |
| Inequality | - | - | -3.884 | 165.84 | 0.009 | |
Based on the results in the table, it can be seen that the confidence level of gender and art product awareness is 0.072>0.05, indicating that there is a chi-square between the two independent samples, so the sig (two-sided) value corresponding to the assumption of equal variance is chosen, and the result is 0.002<0.01, indicating that there is a significant difference in the awareness of art products among individuals of different genders. The confidence level of gender and emotional response is 0.005<0.01, which indicates that there is an inconsistency between the two independent samples, so the sig (two-sided) value corresponding to the assumption of unequal variance is chosen, and the result is 0.001, which indicates that there is a significant difference in the emotional response of individuals of different genders to art consumption behavior. The confidence level of the factor of gender and volitional control of art consumption behavior is 0.047<0.05, which indicates that the two independent samples have unequal variance, so the Sig (two-sided) value corresponding to the assumption of unequal variance is chosen, and the result is 0.000<0.01, which indicates that there is a significant difference between individuals of different genders in their volitional control of art consumption behavior. The confidence levels of gender and art attitudes and art consumption behavior intentions are 0.003 and 0.000 respectively, both less than 0.01. Indicating that the two independent samples have unequal variances, the Sig (two-sided) values corresponding to the assumption of unequal variances were chosen, and the results were 0.003 and 0.009, respectively, which are less than 0.01, indicating that there is a significant difference in the attitudes and intentions of individuals of different genders towards art consumption behaviors.
Reliability is a measure to detect the stability and authenticity of the questionnaire data and whether it can objectively reflect the reality. In this paper, the reliability of the scale is measured by two indexes: Cronbach’s alpha coefficient and Corrected Item Total Correlation Coefficient (CITC). Cronbach’s alpha coefficient is a widely used reliability test in the academic world, and a value of alpha coefficient greater than 0.75 means that the internal consistency is acceptable, and the larger the alpha coefficient value, the higher the internal consistency is, and the better the reliability of the data is. At the same time, the total correlation coefficient after correction term reflects the correlation coefficient between the question items and other question items within the dimension to a certain extent, if the CITC value reaches 0.6 or above, it indicates that the questionnaire items have good consistency and can reflect the latent variables better. The specific Cronbach α coefficients and CITC values are shown in Table 4, where Deletion indicates the Cronbach α coefficients after deleting the items.
Reliability analysis of questionnaire data
| Study variable | Code | CITC | Deletion | Cronbach α |
|---|---|---|---|---|
| Art product cognition (APC) | APC1 | 0.824 | 0.822 | 0.894 |
| APC2 | 0.721 | 0.845 | ||
| APC3 | 0.796 | 0.864 | ||
| APC4 | 0.748 | 0.816 | ||
| Emotional response (ER) | ER1 | 0.756 | 0.871 | 0.913 |
| ER2 | 0.827 | 0.908 | ||
| ER3 | 0.784 | 0.893 | ||
| ER4 | 0.851 | 0.885 | ||
| Willed control (WC) | WC1 | 0.709 | 0.932 | 0.948 |
| WC2 | 0.732 | 0.867 | ||
| WC3 | 0.758 | 0.898 | ||
| Attitude (ATT) | ATT1 | 0.812 | 0.861 | 0.885 |
| ATT2 | 0.864 | 0.872 | ||
| Artistic consumption behavior (ACB) | ACB1 | 0.896 | 0.847 | 0.862 |
| ACB2 | 0.763 | 0.835 |
From the table, it can be seen that the Cronbach α coefficient values of each dimension range from 0.862 to 0.948, which are all greater than 0.75, and the CITC coefficient values range from 0.709 to 0.896, which are all greater than 0.6, which indicates that the reliability of the data of the questionnaire is good. From the results of Cronbach α coefficient after deleting items, the Cronbach α coefficients after deleting items of all questions are smaller than the Cronbach α coefficient of the dimension, which need not be deleted. Therefore, the art consumption behavior data obtained through the questionnaire in this paper has a high degree of reliability, which can lay the foundation for analyzing the changes in art consumption psychology-driven consumption behavior.
Validation factor analysis (CFA) is an advanced statistical technique used to test the structure of a measurement model, i.e., the relationship between the expected latent variables and the measured variables, and can verify that a prespecified model matches the actual data. If the results of the validation factor analysis do not match the theoretical model, the researcher can modify the model to improve its fit. This helps to improve the theoretical framework of the study so that it better explains the data.
Convergent validity Convergent validity refers to the degree to which the items within a factor are centralized to the factor, and responds to whether the question items represent the factor. Convergent validity is usually assessed by the following two values, i.e., the higher the value of combinatorial validity (CR), reflecting the internal consistency of the constructs, which is generally required to be greater than 0.75, and the average variance extracted (AVE), reflecting the average of the explanatory power of the latent variables on the measured variables, which is generally required to be greater than 0.55, with the range of 0.35 to 0.55 indicating that it can be barely acceptable. The higher the value of CR and the value of AVE, the higher the degree of convergence, which means the better the validity. That is, the better the validity. Table 5 shows the results of the convergent validity test. CR value and AVE value will be affected by the factor loading coefficient, combined with the data in the table, we can see that the standardized factor loading coefficient (Std.) is higher than 0.72, and the CR value and AVE value are greater than 0.85 and 0.65 respectively. i It shows that the internal consistency of the data collected in this paper is better, and the convergent validity of the overall data is higher. Discriminant validity Distinguishing validity refers to the degree of difference between different factors, i.e., the external correlation of the factors. The degree of correlation between the items within the factors can be regarded as the internal correlation of the factors. It is generally believed that there is good differentiation between factors when the external correlation is less than the internal correlation. Table 6 shows the results of discriminant validity, where the diagonal diagonal bolded numbers are the square root of the AVE and *** in the table indicates P<0.01. Based on the data in the table, it can be seen that the standardized coefficients between each dimension and the other dimensions are smaller than the square root of the AVE value of the dimension, which indicates that there is a good discriminant validity between the dimensions. In addition, the correlation coefficients between the dimensions range from 0.505 to 0.636, which also indicates that the dimensions have some correlation between the pages.
Degree of model fit
| Study variable | Code | Std. | Estimate | S.E. | T | CR | AVE |
|---|---|---|---|---|---|---|---|
| Art product cognition (APC) | APC1 | 0.727 | 1.077 | 0.041 | 8.482*** | 0.866 | 0.702 |
| APC2 | 0.845 | 0.934 | 0.055 | 9.729*** | |||
| APC3 | 0.884 | 0.943 | 0.079 | 8.068*** | |||
| APC4 | 0.873 | 0.986 | 0.065 | 9.385*** | |||
| Emotional response (ER) | ER1 | 0.808 | 1.025 | 0.072 | 7.421*** | 0.892 | 0.689 |
| ER2 | 0.846 | 0.917 | 0.053 | 9.297*** | |||
| ER3 | 0.862 | 1.091 | 0.078 | 9.345*** | |||
| ER4 | 0.859 | 0.976 | 0.057 | 8.394*** | |||
| Willed control (WC) | WC1 | 0.773 | 0.967 | 0.079 | 8.883*** | 0.851 | 0.665 |
| WC2 | 0.806 | 1.079 | 0.063 | 8.569*** | |||
| WC3 | 0.835 | 0.983 | 0.051 | 8.627*** | |||
| Attitude (ATT) | ATT1 | 0.813 | 0.932 | 0.072 | 7.426*** | 0.873 | 0.714 |
| ATT2 | 0.722 | 0.997 | 0.045 | 8.652*** | |||
| Artistic consumption behavior (ACB) | ACB1 | 0.784 | 1.038 | 0.058 | 7.154*** | 0.904 | 0.683 |
| ACB2 | 0.741 | 0.946 | 0.063 | 7.645*** |
Discriminant Validity results
| APC | ER | WC | ATT | ACB | |
|---|---|---|---|---|---|
| APC | - | - | - | - | |
| ER | 0.547*** | - | - | - | |
| WC | 0.505*** | 0.536*** | - | - | |
| ATT | 0.592*** | 0.528*** | 0.554*** | - | |
| ACB | 0.539*** | 0.591*** | 0.612*** | 0.636*** |
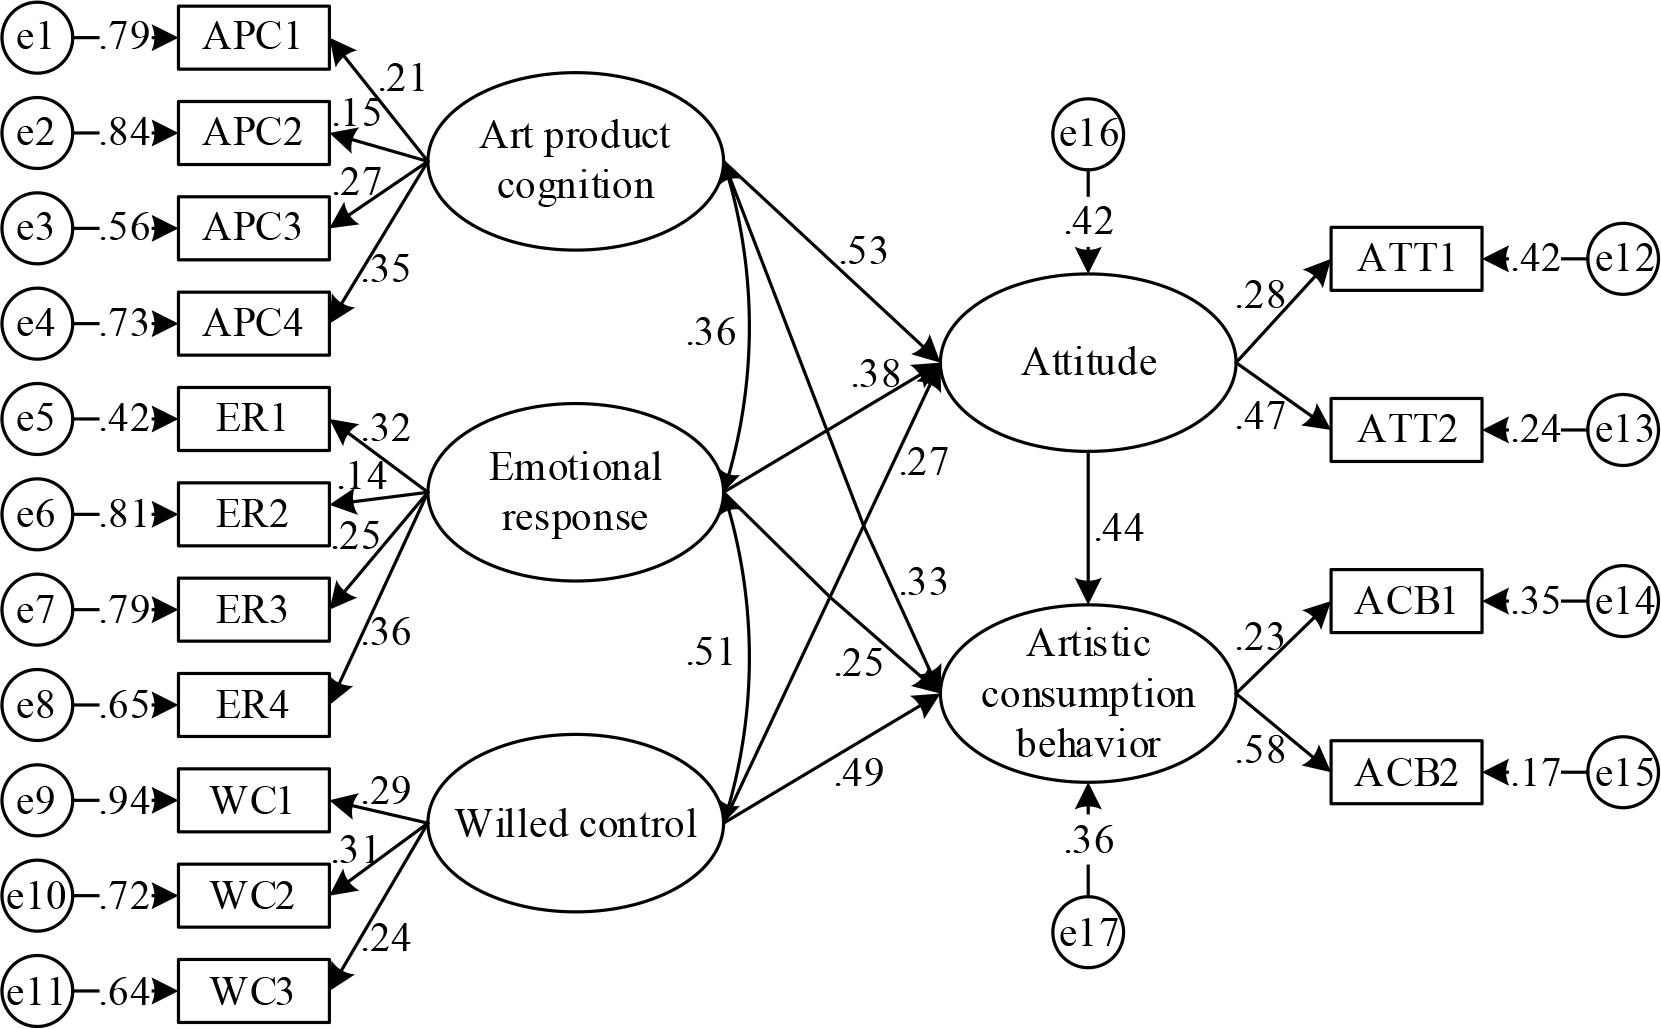
In this section, AMOS software is used and structural equation modeling is employed to test the research hypotheses proposed above and finally determine the mechanism of the role of different influencing factors on art consumption behavioral intentions. Based on the literature review, the model is fitted by the maximum likelihood method, and the initial structural equation model diagram is obtained by defining and testing according to the reference values. Then the fit index of the theoretical model is tested to confirm the fitness of the model. Figure 5 shows the results of fitting the structural equation model and Table 7 shows the fit of the structural equation model.
The model of the structure equation is matched
The fitting degree of the structural equation model
| Index | Ideal value | Fitting value | Result |
|---|---|---|---|
| X2/df | <3.5 | 3.072 | Good |
| RMSEA | <0.09 | 0.061 | Good |
| GFI | >0.85 | 0.948 | Good |
| AGFI | >0.85 | 0.925 | Good |
| CFI | >0.85 | 0.879 | Good |
| IFI | >0.85 | 0.884 | Good |
| TLI | >0.85 | 0.906 | Good |
According to the ideal fit index, the value of chi-square divided by degrees of freedom is equal to 3.072, which is less than the critical value and reaches the standard of less than 3.5, and the index has a good fit. The index of RMSEA is 0.061, which reaches the standard of less than 0.09, and the index has a better fit. The fitted values of GFI and AGFI are 0.948 and 0.925, which are both greater than 0.85, and the two indexes have a better fit. The fitted values of CFI, IFI, and TLI are 0.879, 0.884, and 0.906, respectively, which all reach the criterion of greater than 0.85, and the fitting degree of the two indicators is good. According to the above fitting indicators, a total of seven indicators meet the standard, indicating that the structural equation model of art consumption behavioral intention established in this paper has a better fit, and it can be considered that the data fitting of the model is at a good level, which can provide reliable fitting results for analyzing the change of art consumption behavioral intention driven by art consumption psychology.
This paper is based on the study of path coefficients of structural equation modeling to observe the path changes and test whether the research hypotheses are valid. This paper analyzes the path effect of structural equations as shown in Table 8, where *,**,*** denotes P<0.05, P<0.01, P<0.001, respectively. art product cognition, emotional reaction, and volitional control have a positive and significant effect on attitude, art product cognition, emotional reaction, volitional control and attitude have a positive and significant effect on the intention to consume art behaviors, art product cognition has a positive and significant effect on Emotional reaction has a positive and significant effect on emotional reaction, and emotional reaction has a positive and significant effect on volitional control. That is, all paths are significantly less than 0.05, and all paths are significantly established. The analysis is as follows:
There is a positive and significant effect of art product cognition on attitude, with a standardized coefficient of 0.528 and P<0.001, and the H1 validation is passed. It indicates that the higher the consumer’s awareness of art products, the more positive the attitude towards art. There is a positive and significant effect of art product cognition on the intention of art consumption behavior, and its standardized coefficient is 0.331, and P<0.001, H2 validation passed. It indicates that when the degree of consumers’ art product cognition is higher, the change of consumers’ art consumption behavior intention is more obvious. There is a positive and significant effect of art product cognition on emotional response, with a standardized coefficient of 0.364 and P<0.01, and H3 validation passed. It indicates that the higher the degree of consumers’ cognition of art products, the greater their emotional response. There is a positive and significant effect of emotional reaction on attitude, with a standardized coefficient of 0.379 and P<0.001, and H4 validation passed. It indicates that the more pronounced the consumers’ emotional reaction to art consumption, the stronger their art attitude. In addition, there is also a positive and significant effect of emotional reaction on volitional control, with a standardized coefficient of 0.512 and P<0.01, and H5 validation passed. It indicates that the stronger the consumers’ emotional reaction to art consumption, the more positive their art attitude is. Emotional reaction has a positive effect on art consumption behavioral intention, its standardized coefficient is 0.247, and P<0.01, H6 validation passed. The greater the consumer’s emotional reaction to art consumption, the stronger the change in their art consumption behavioral intention. There is a positive effect of volitional control on attitude, and its standardized coefficient is 0.273, and P<0.05, H7 validation passed. It indicates that the stronger the consumers’ will control in the process of art consumption, the higher their art attitude. Will control has a positive and significant effect on art consumption behavioral intention, and its standardized coefficient is 0.486, and P<0.001, H8 validation passed. It indicates that the stronger the consumer’s volitional control is, the greater the likelihood of changes in his or her art consumption behavioral intention. Attitude has a positive and significant effect on art consumption behavior intention, its standardized coefficient is 0.439, and P<0.001, H9 validation passed. It indicates that the more positive the consumer’s art attitude is, the stronger his art consumption behavior intention is.
The path analysis of the structural equation
| Path | Effect | Estimate | S.E. | C.R. | P | Hypothe |
|---|---|---|---|---|---|---|
| APC→ATT | 0.528 | 0.272 | 0.057 | 9.728 | *** | Support |
| APC→ACB | 0.331 | 0.293 | 0.032 | 7.425 | *** | Support |
| APC→ER | 0.364 | 0.185 | 0.049 | 8.313 | ** | Support |
| ER→ATT | 0.379 | 0.368 | 0.061 | 7.904 | *** | Support |
| ER→WC | 0.512 | 0.176 | 0.043 | 7.672 | ** | Support |
| ER→ACB | 0.247 | 0.142 | 0.056 | 7.436 | ** | Support |
| WC→ATT | 0.273 | 0.157 | 0.048 | 8.141 | * | Support |
| WC→ACB | 0.486 | 0.194 | 0.034 | 7.617 | *** | Support |
| ATT→ACB | 0.439 | 0.126 | 0.051 | 9.473 | *** | Support |
In this study, the AMOS software was used to test and analyze whether there is a significant mediating effect between the variables in the data, and the Bootstrap method was used to select the 95% confidence interval, and then the mediating effect was calculated and tested by the 5000 rotational iterations built into the software. Whether there is a significant mediation effect is determined by observing the upper and lower limits of the 95% confidence interval and the significance P-value in the result table.
Direct effect On the basis of structural equation modeling, the Bootstrap method of AMOS is applied to repeat the sample 5000 times to calculate the 95% confidence interval. Table 9 shows the results of the direct effect test. As can be seen from the table, the 95% confidence intervals of the direct effects of art product cognition, emotional response and volitional control on attitude are positive and the significance P-value is less than 0.05, indicating that the direct effects of the above three paths are significant. The upper and lower 95% confidence intervals of the direct effects of art product cognition, emotional reaction, volitional control and attitude on art consumption behavioral intention are both positive and do not contain 0, and the significance P-value is less than the standard significant level of 0.05, indicating that the direct effects of the above four paths are significant. In addition, the 95% confidence intervals of art product cognition on emotional response and emotional response on volitional control are positive and do not contain 0, and the significance P-value is less than 0.05, indicating that the direct effects of the above two paths are significant. Indirect effects Table 10 shows the results of the indirect effect test. As can be seen from the table, mediation path 1 is in the model with art product awareness as the independent variable, attitude as the mediator variable, and art consumption behavior intention as the dependent variable, the effect value is 0.076, the 95% confidence upper and lower intervals are positive and do not contain 0, and the significance of the P-value is less than the criterion of the significance level of 0.01, which means that the mediation effect exists significantly. Mediation path 2 is to emotional response as the independent variable, attitude as the mediator variable, art consumption behavior intention as the dependent variable in the model, the effect value is 0.083, 95% confidence upper and lower intervals are positive, do not contain 0, and the significance of the P-value is less than the standard of the significant level of 0.01, indicating that the mediation effect is significant. Mediation path 3 is to will control as the independent variable, attitude as the mediator variable, art consumption behavior intention as the dependent variable in the model, the effect value is 0.062, 95% confidence upper and lower intervals are positive, do not contain 0, and the significance of the P-value is less than the standard of the significant level of 0.01, indicating that the mediation effect is significant. The synthesis of mediation path 1~3 can verify that the H10 proposed in this paper can be established. The indirect effect value of mediated path 4 (art product cognition → emotional response → volitional control) is 0.094, the 95% confidence upper and lower intervals are positive, do not contain 0, and the significance of the P-value is less than the criterion of the significant level of 0.01, which indicates that the mediation effect significantly exists, and so it proves that the hypothesis proposed in this study H11 is validated to be established.
Direct effect test results
| Path | Effect value | S.E. | Bias-corrected 95%CI | ||
|---|---|---|---|---|---|
| Lower | Upper | P | |||
| APC→ATT | 0.528 | 0.057 | 0.083 | 0.189 | 0.005 |
| APC→ACB | 0.331 | 0.032 | 0.111 | 0.222 | 0.001 |
| APC→ER | 0.364 | 0.049 | 0.072 | 0.363 | 0.009 |
| ER→ATT | 0.379 | 0.061 | 0.089 | 0.214 | 0.002 |
| ER→WC | 0.512 | 0.043 | 0.064 | 0.157 | 0.004 |
| ER→ACB | 0.247 | 0.056 | 0.095 | 0.286 | 0.000 |
| WC→ATT | 0.273 | 0.048 | 0.051 | 0.181 | 0.001 |
| WC→ACB | 0.486 | 0.034 | 0.047 | 0.216 | 0.004 |
| ATT→ACB | 0.439 | 0.051 | 0.062 | 0.298 | 0.008 |
Indirect effect test results
| No. | Path | Effect value | S.E. | Bias-corrected 95%CI | ||
|---|---|---|---|---|---|---|
| Lower | Upper | P | ||||
| 1 | APC→ATT→ACB | 0.076 | 0.013 | 0.059 | 0.156 | 0.002 |
| 2 | ER→ATT→ACB | 0.083 | 0.021 | 0.101 | 0.183 | 0.005 |
| 3 | WC→ATT→ACB | 0.062 | 0.027 | 0.084 | 0.175 | 0.000 |
| 4 | APC→ER→WC | 0.094 | 0.038 | 0.136 | 0.428 | 0.001 |
This paper establishes a research model of art consumption psychology and behavioral intention based on the theory of planned behavior and structural equation modeling, and explores the correlation between art consumption psychology and behavioral change by obtaining research data through questionnaires. It is found that art product cognition, emotional reaction and volitional control in art consumption psychology have a significant effect on art consumption behavioral intention change, with path coefficients of 0.331, 0.247, and 0.486, respectively, and there is a significant mediating effect of attitude between art product cognition, emotional reaction, volitional control, and art consumption behavioral change. The standardization of art consumption psychology in the era of artificial intelligence needs to start from the individual’s art product cognition, fully respect their emotional reaction and explore new ways to enhance their will control ability, in order to promote the normal development of individual art consumption behavioral changes in intention.