Social network analysis of the casual community: identifying key players and network structure
17 mars 2025

À propos de cet article
Publié en ligne: 17 mars 2025
Reçu: 21 oct. 2024
Accepté: 11 févr. 2025
DOI: https://doi.org/10.2478/amns-2025-0159
Mots clés
© 2025 Bo Ma, published by Sciendo
This work is licensed under the Creative Commons Attribution 4.0 International License.
Figure 1.
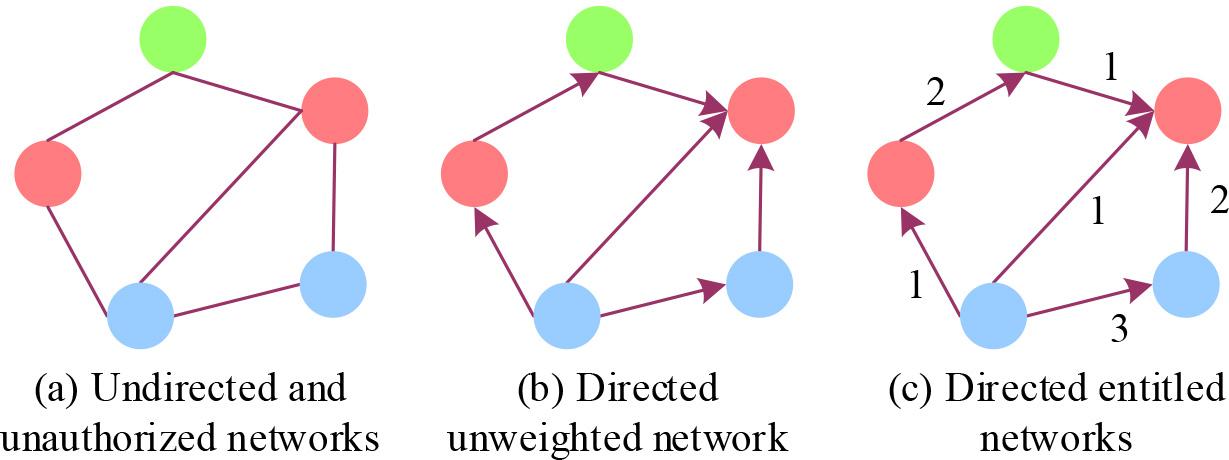
Figure 2.
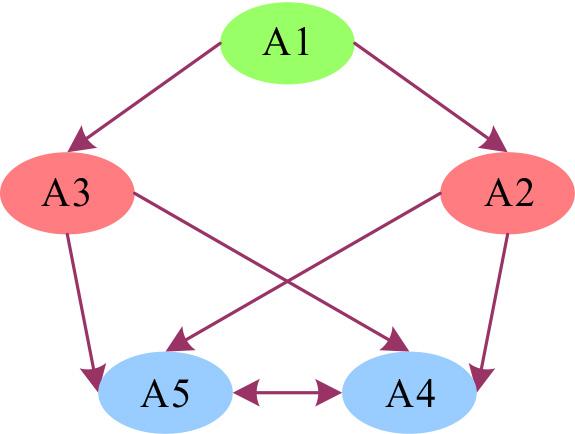
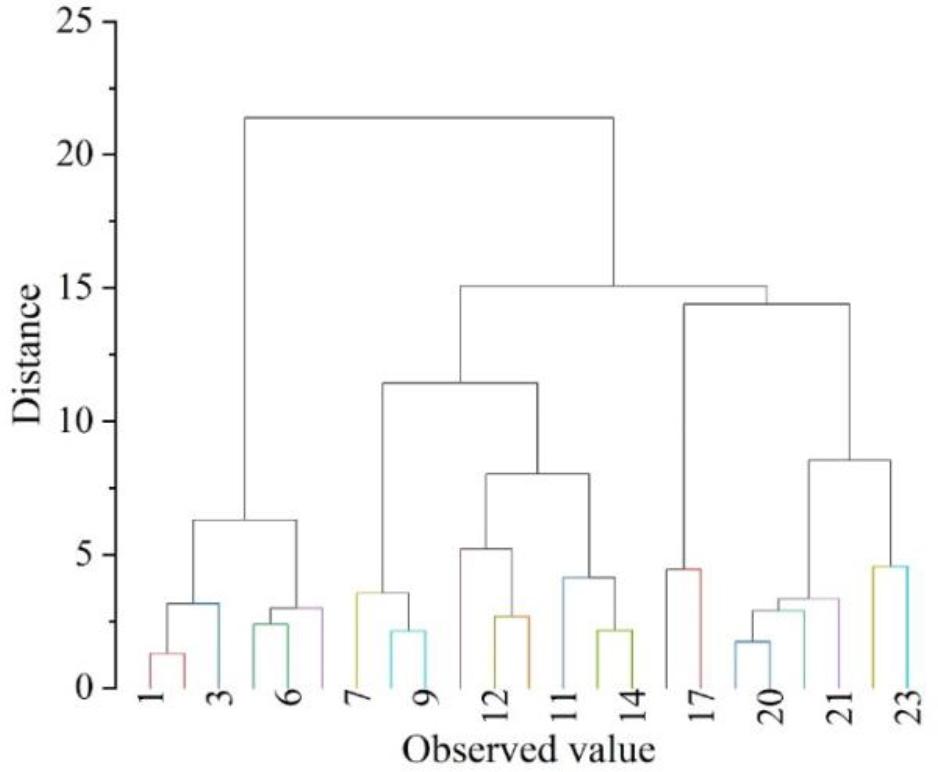
Figure 3.
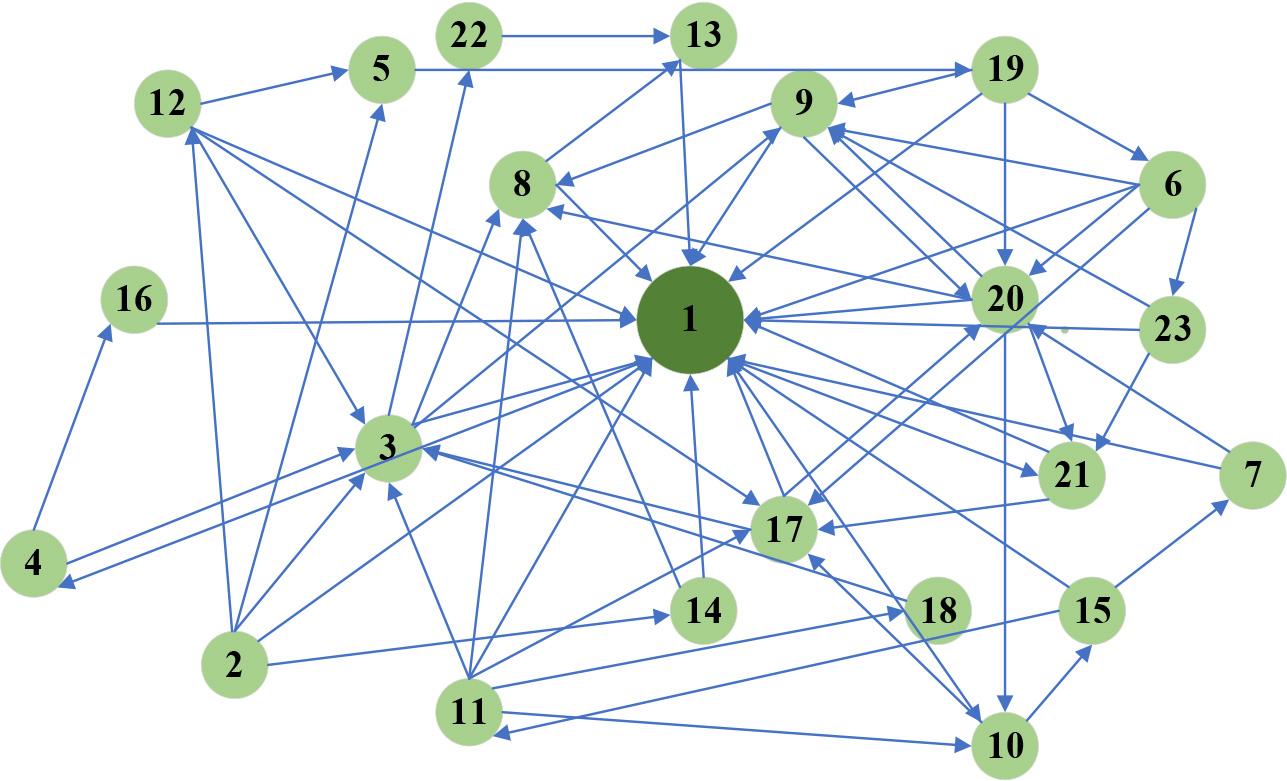
Figure 4.
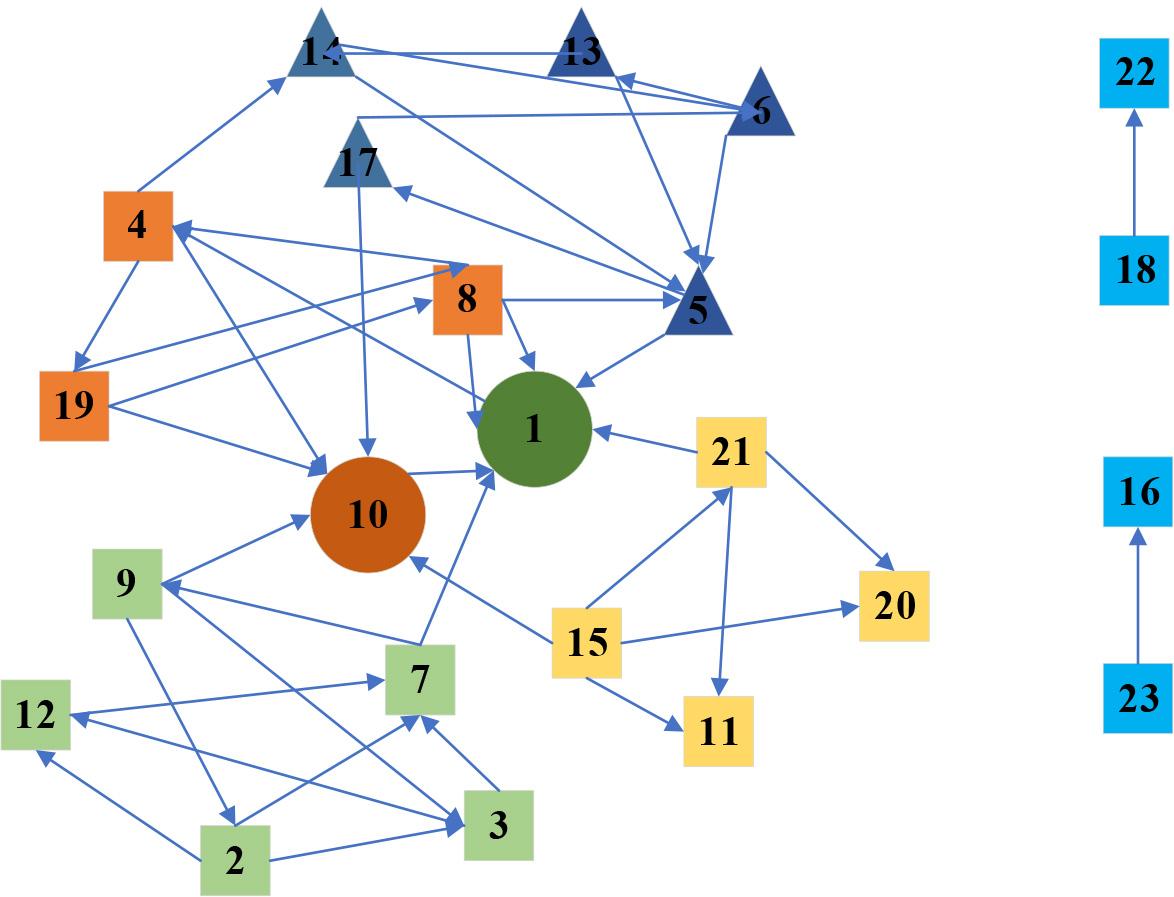
Figure 5.
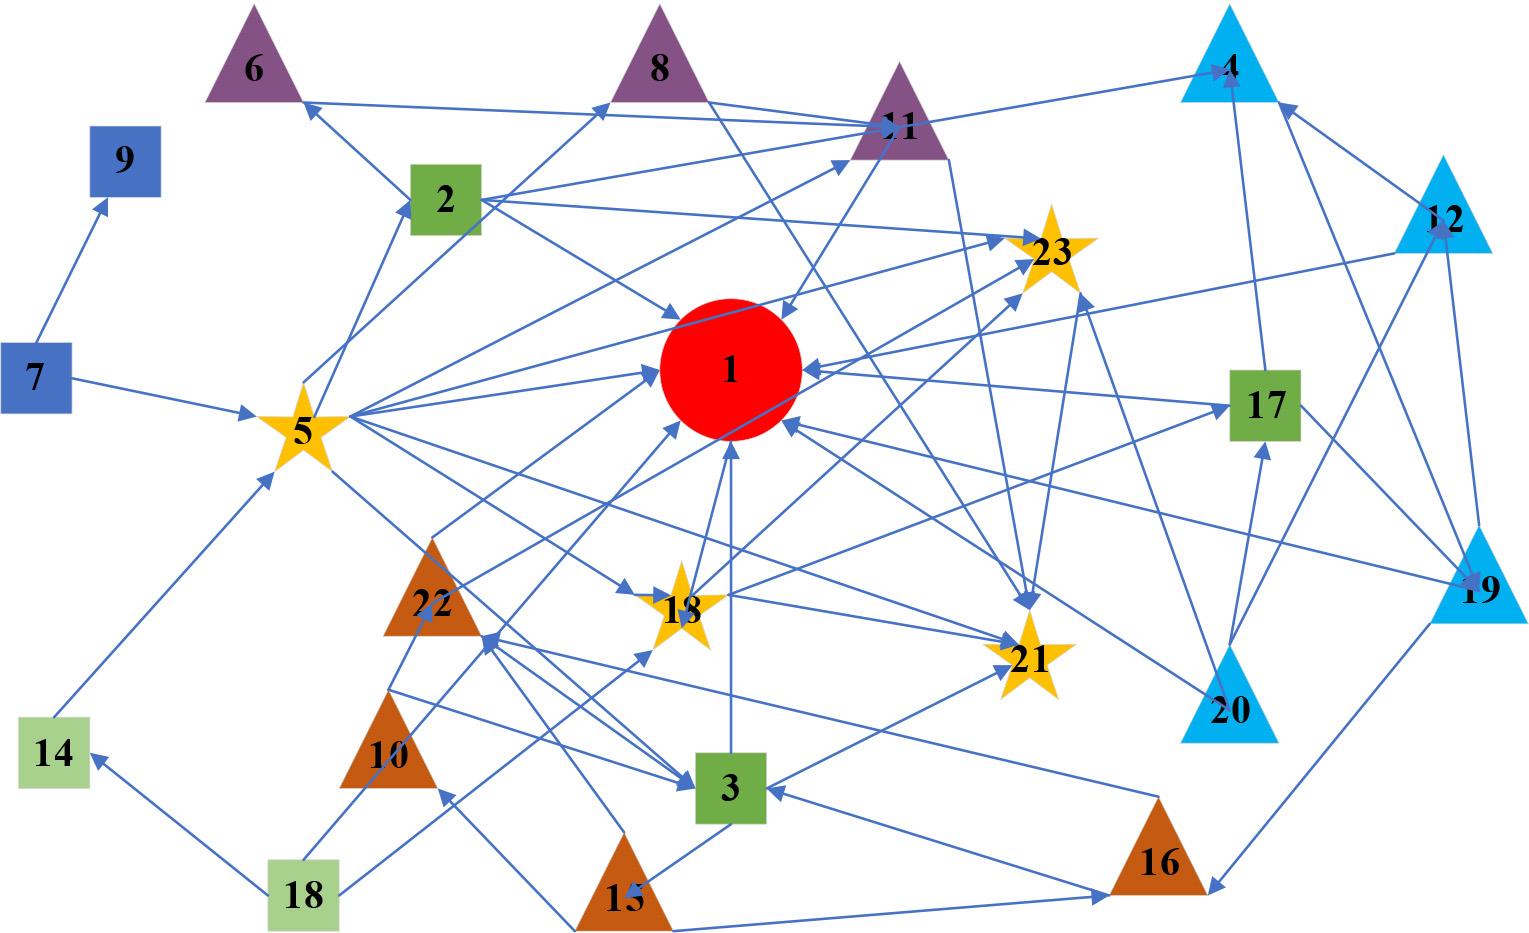
Figure 6.
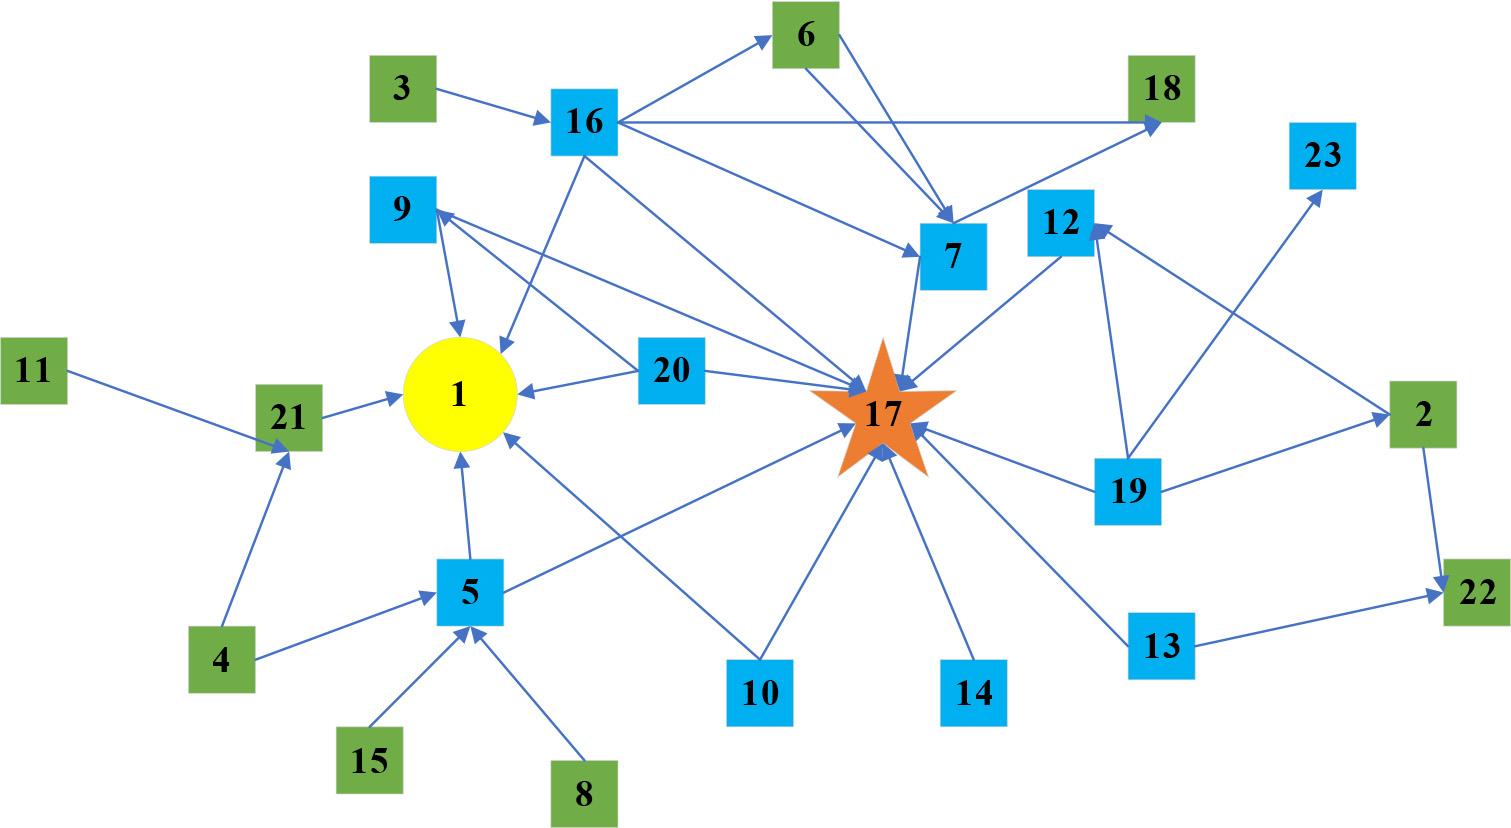
Figure 7.
The relative eigenvector center of the three dimensions
| Affective communication | Information transfer | Technical consultation | ||||||
| Member | Eigenvec | nEigenvec | Member | Eigenvec | nEigenvec | Member | Eigenvec | nEigenvec |
| 1 | 0.59 | 56.06 | 1 | 0.65 | 63.23 | 1 | 0.73 | 71.6 |
| 2 | 0.59 | 55.99 | 2 | 0.64 | 61.57 | 2 | 0.72 | 61.32 |
| 3 | 0.3 | 15.6 | 3 | 0.32 | 16.81 | 3 | 0.4 | 11.5 |
| 4 | 0.42 | 31.89 | 4 | 0.36 | 22.95 | 4 | 0.44 | 11.5 |
| 5 | 0.39 | 28.74 | 5 | 0.41 | 29.61 | 5 | 0.49 | 23.77 |
| 6 | 0.39 | 27.9 | 6 | 0.32 | 16.81 | 6 | 0.4 | 11.5 |
| 7 | 0.39 | 28.54 | 7 | 0.32 | 16.81 | 7 | 0.4 | 49.71 |
| 8 | 0.38 | 26.47 | 8 | 0.45 | 35.92 | 8 | 0.53 | 68.89 |
| 9 | 0.39 | 28.38 | 9 | 0.36 | 22.62 | 9 | 0.44 | 13.41 |
| 10 | 0.39 | 28.9 | 10 | 0.32 | 17.06 | 10 | 0.4 | 9.34 |
| 11 | 0.31 | 16.28 | 11 | 0.36 | 22.95 | 11 | 0.44 | 20.51 |
| 12 | 0.42 | 32.24 | 12 | 0.3 | 13.56 | 12 | 0.38 | 5.88 |
| 13 | 0.42 | 32.03 | 13 | 0.34 | 19.62 | 13 | 0.42 | 23.25 |
| 14 | 0.35 | 22.41 | 14 | 0.45 | 35.67 | 14 | 0.53 | 14.35 |
| 15 | 0.34 | 21.27 | 15 | 0.42 | 30.73 | 15 | 0.5 | 24.97 |
| 16 | 0.4 | 29.03 | 16 | 0.3 | 13.8 | 16 | 0.38 | 16.17 |
| 17 | 0.3 | 15.27 | 17 | 0.24 | 5.13 | 17 | 0.32 | 8.65 |
| 18 | 0.34 | 21.17 | 18 | 0.48 | 38.91 | 18 | 0.56 | 5.97 |
| 19 | 0.3 | 15.3 | 19 | 0.32 | 16.81 | 19 | 0.4 | 16.98 |
| 20 | 0.31 | 16.75 | 20 | 0.39 | 26.9 | 20 | 0.47 | 17.07 |
| 21 | 0.3 | 14.98 | 21 | 0.29 | 12.42 | 21 | 0.37 | 2.76 |
| 22 | 0.46 | 37.91 | 22 | 0.55 | 49.87 | 22 | 0.63 | 27.77 |
| 23 | 0.39 | 27.73 | 23 | 0.32 | 16.52 | 23 | 0.4 | 13.76 |
A list of points of point center for community participants
| Affective communication | Information transfer | Technical consultation | ||||||||||||
| Member | OD | ID | NOD | NID | Member | OD | ID | NOD | NID | Member | OD | ID | NOD | NID |
| 1 | 17 | 22 | 50.73 | 61.6 | 10 | 12 | 22 | 31.72 | 64.95 | 13 | 26 | 6 | 12.33 | 1.42 |
| 12 | 13 | 25 | 36.93 | 71.95 | 7 | 11 | 6 | 28.27 | 9.78 | 5 | 13 | 6 | 6.73 | 1.42 |
| 2 | 10 | 10 | 26.59 | 20.22 | 18 | 9 | 5 | 21.37 | 6.33 | 1 | 12 | 29 | 6.3 | 11.34 |
| 16 | 10 | 8 | 26.59 | 13.33 | 11 | 8 | 8 | 17.92 | 16.67 | 15 | 11 | 5 | 5.87 | 0.99 |
| 8 | 10 | 8 | 26.59 | 13.33 | 8 | 8 | 4 | 17.92 | 2.88 | 10 | 9 | 6 | 5.01 | 1.42 |
| 5 | 9 | 9 | 23.14 | 16.77 | 19 | 7 | 7 | 14.48 | 13.23 | 18 | 8 | 6 | 4.57 | 1.42 |
| 17 | 9 | 12 | 23.14 | 27.12 | 2 | 7 | 5 | 14.48 | 6.33 | 21 | 7 | 4 | 4.14 | 0.56 |
| 6 | 9 | 9 | 23.14 | 16.77 | 16 | 7 | 8 | 14.48 | 16.67 | 14 | 7 | 6 | 4.14 | 1.42 |
| 10 | 9 | 10 | 23.14 | 20.22 | 15 | 7 | 5 | 14.48 | 6.33 | 6 | 7 | 4 | 4.14 | 0.56 |
| 14 | 9 | 11 | 23.14 | 23.67 | 5 | 7 | 7 | 14.48 | 13.23 | 16 | 7 | 8 | 4.14 | 2.28 |
| 20 | 8 | 9 | 19.69 | 16.77 | 1 | 7 | 5 | 14.48 | 6.33 | 19 | 7 | 4 | 4.14 | 0.56 |
| 11 | 8 | 14 | 19.69 | 34.01 | 4 | 7 | 4 | 14.48 | 2.88 | 2 | 7 | 12 | 4.14 | 4.01 |
| 18 | 8 | 6 | 19.69 | 6.43 | 6 | 6 | 5 | 11.03 | 6.33 | 3 | 6 | 5 | 3.71 | 0.99 |
| 4 | 8 | 8 | 19.69 | 13.33 | 13 | 6 | 15 | 11.03 | 40.81 | 9 | 6 | 5 | 3.71 | 0.99 |
| 15 | 8 | 8 | 19.69 | 13.33 | 3 | 6 | 23 | 11.03 | 68.4 | 22 | 6 | 4 | 3.71 | 0.56 |
| 7 | 8 | 16 | 19.69 | 40.91 | 8 | 6 | 7 | 11.03 | 13.23 | 11 | 6 | 5 | 3.71 | 0.99 |
| 21 | 7 | 5 | 16.24 | 2.98 | 9 | 6 | 5 | 11.03 | 6.33 | 12 | 6 | 4 | 3.71 | 0.56 |
| 3 | 7 | 6 | 16.24 | 6.43 | 12 | 6 | 5 | 11.03 | 6.33 | 17 | 6 | 5 | 3.71 | 0.99 |
| 22 | 7 | 6 | 16.24 | 6.43 | 15 | 6 | 4 | 11.03 | 2.88 | 20 | 6 | 14 | 3.71 | 4.87 |
| 9 | 7 | 10 | 16.24 | 20.22 | 17 | 6 | 5 | 11.03 | 6.33 | 8 | 6 | 4 | 3.71 | 0.56 |
| 13 | 7 | 5 | 16.24 | 2.98 | 22 | 6 | 4 | 11.03 | 2.88 | 7 | 6 | 5 | 3.71 | 0.96 |
| 23 | 7 | 12 | 16.24 | 27.12 | 23 | 6 | 4 | 11.03 | 2.88 | 4 | 6 | 4 | 3.71 | 0.56 |
| 4 | 6 | 9 | 12.8 | 16.77 | 21 | 6 | 4 | 11.03 | 2.88 | 23 | 5 | 4 | 3.28 | 0.56 |
Matrix form of figure 2
| A1 | A2 | A3 | A4 | A5 | |
| A1 | 0 | 1 | 1 | 0 | 0 |
| A2 | 0 | 0 | 0 | 1 | 1 |
| A3 | 0 | 0 | 0 | 1 | 1 |
| A4 | 0 | 0 | 0 | 0 | 1 |
| A5 | 0 | 0 | 0 | 0 | 1 |
Social network correlation degree and hierarchy
| Index | Affective network | Information network | Consulting network | |
| First set | Connectedness | 1 | 1 | 1 |
| Hierarchy | 0 | 0 | 0.37 | |
| LUB | 1 | 1 | 0.92 | |
| Second group | Connectedness | 1 | 1 | 1 |
| Hierarchy | 0 | 0 | 0.28 | |
| LUB | 1 | 1 | 0.94 | |
| Third group | Connectedness | 0.78 | 1 | 1 |
| Hierarchy | 0.08 | 0.27 | 0.61 | |
| LUB | 1 | 0.97 | 0.71 | |
The community condensed subgroup
| Group | Numbering | Group | Numbering |
| 1 | 2 4 7 9 | 10 | 10 11 16 19 |
| 2 | 12 21 18 23 | 11 | 15 18 19 21 |
| 3 | 1 4 7 6 | 12 | 18 19 22 23 |
| 4 | 2 6 18 11 | 13 | 18 19 20 22 |
| 5 | 2 15 12 20 | 14 | 18 19 20 21 |
| 6 | 7 8 10 22 | 15 | 18 19 21 22 |
| 7 | 7 9 14 17 | 16 | 19 20 21 23 |
| 8 | 7 14 15 17 20 21 | 17 | 1 4 6 9 |
| 9 | 10 13 16 17 21 23 | 18 | 3 7 15 21 |
The center of the community is involved in the center of the community
| The center of the emotional network | The center of the emotional network | The center of the technical network | ||||||
| Member | Betweenness | nBetweenness | Member | Betweenness | nBetweenness | Member | Betweenness | nBetweenness |
| 2 | 240.14 | 32.85 | 1 | 260.32 | 36.28 | 5 | 278.1 | 28.64 |
| 1 | 148.54 | 21.57 | 3 | 160.32 | 21.14 | 9 | 231.48 | 23.83 |
| 23 | 68.09 | 11.66 | 5 | 121.06 | 16.8 | 2 | 127.5 | 11.97 |
| 8 | 67.13 | 11.54 | 12 | 46.28 | 6.44 | 16 | 58.21 | 5.79 |
| 10 | 29.82 | 6.95 | 19 | 36.34 | 6.11 | 11 | 41.65 | 3.59 |
| 11 | 28.39 | 6.77 | 15 | 30.44 | 4.55 | 20 | 35.44 | 3.05 |
| 21 | 25.5 | 6.41 | 21 | 20.78 | 1.78 | 19 | 27.11 | 1.9 |
| 6 | 25.36 | 6.4 | 9 | 18 | 1.55 | 21 | 20.21 | 1.3 |
| 22 | 24.3 | 6.27 | 11 | 18 | 1.11 | 15 | 11.55 | 1.12 |
| 19 | 20.21 | 5.76 | 20 | 9.45 | 1 | 14 | 3 | 0.19 |
| 14 | 19.95 | 5.73 | 4 | 9.21 | 0.98 | 17 | 2.1 | 0.18 |
| 16 | 19.67 | 5.69 | 6 | 2.51 | 0.16 | 4 | 0.5 | 0 |
| 5 | 19.61 | 5.69 | 17 | 1.12 | 0.09 | 22 | 0 | 0 |
| 4 | 18.25 | 5.52 | 16 | 0.23 | 0.04 | 1 | 0 | 0 |
| 13 | 16.9 | 5.35 | 2 | 0.23 | 0.04 | 7 | 0 | 0 |
| 20 | 16.53 | 5.31 | 7 | 0.23 | 0.04 | 8 | 0 | 0 |
| 15 | 14.88 | 5.11 | 13 | 0.23 | 0.04 | 18 | 0 | 0 |
| 18 | 14.63 | 5.07 | 8 | 0.23 | 0.04 | 3 | 0 | 0 |
| 12 | 13.86 | 4.98 | 23 | 0.18 | 0.03 | 13 | 0 | 0 |
| 17 | 12.55 | 4.82 | 9 | 0 | 0 | 6 | 0 | 0 |
| 3 | 8.61 | 4.33 | 10 | 0 | 0 | 23 | 0 | 0 |
| 7 | 8.54 | 4.32 | 14 | 0 | 0 | 10 | 0 | 0 |
| 9 | 6.21 | 4.04 | 13 | 0 | 0 | 12 | 0 | 0 |
| average value | 37.72 | 7.92 | 31.96 | 4.27 | 36.38 | 3.55 | ||
| (statistics) standard deviation | 51.25 | 6.88 | 65.21 | 9.51 | 72.51 | 10.81 | ||
The overall network interpersonal interaction distance analysis
| Loose beat community | Average interaction distance | Community cohesion |
| First set | 1.542 | 0.388 |
| Second group | 1.735 | 0.314 |
| Third group | 4.212 | 0.152 |