Experimental investigation on the influence of scale effects on the permeability coefficient of coarse-grained soil
, , , , und
27. Feb. 2025

Über diesen Artikel
Online veröffentlicht: 27. Feb. 2025
Eingereicht: 01. Okt. 2024
Akzeptiert: 08. Jan. 2025
DOI: https://doi.org/10.2478/amns-2025-0150
Schlüsselwörter
© 2025 Yong Yang et al., published by Sciendo
This work is licensed under the Creative Commons Attribution 4.0 International License.
Figure 1.
Figure 2.
Figure 3.
Figure 4.
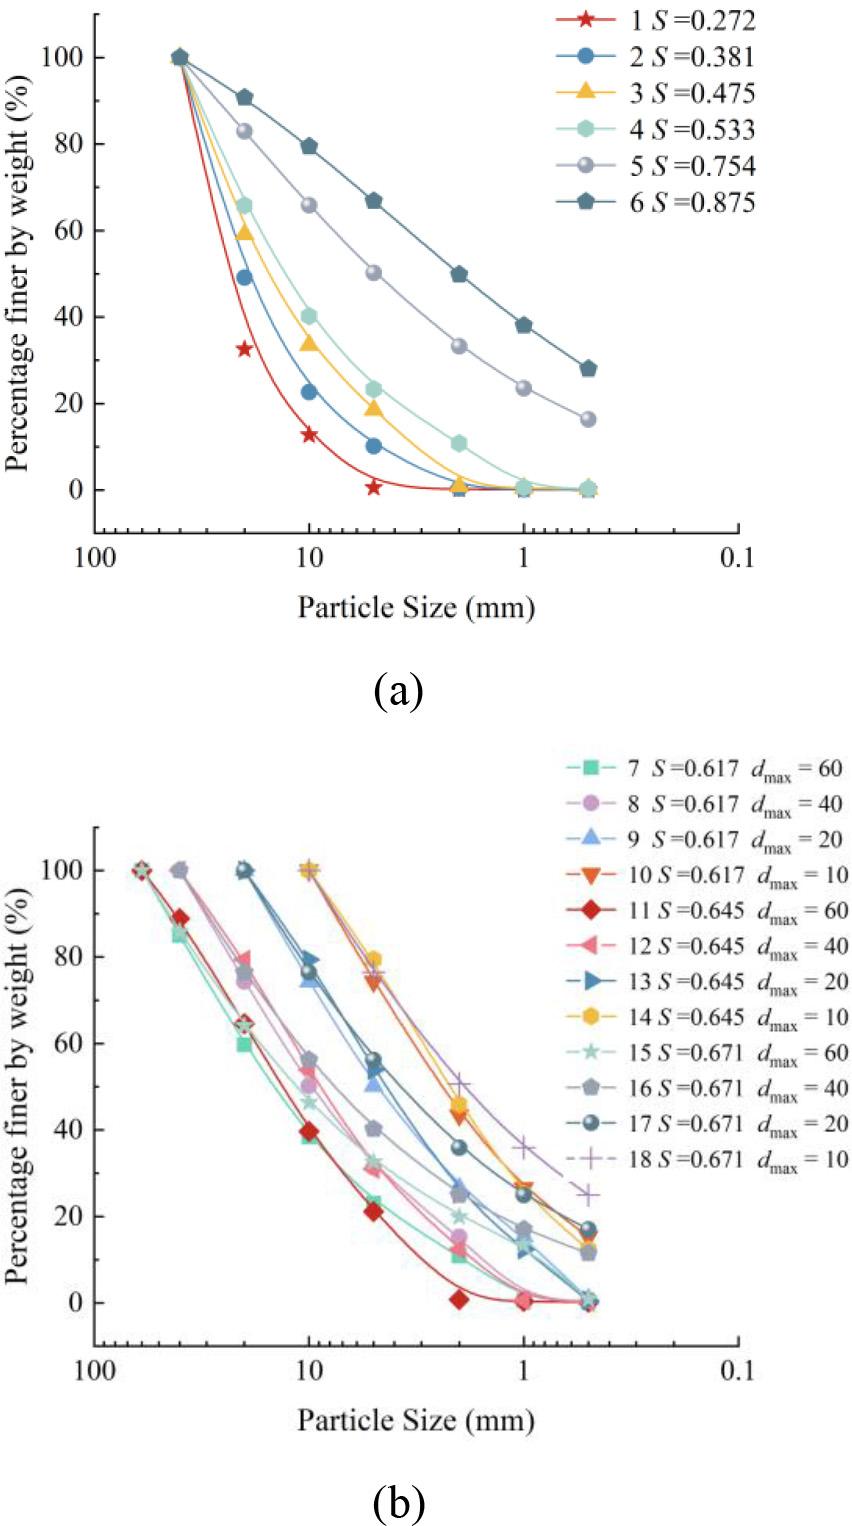
Figure 5.
Figure 6.
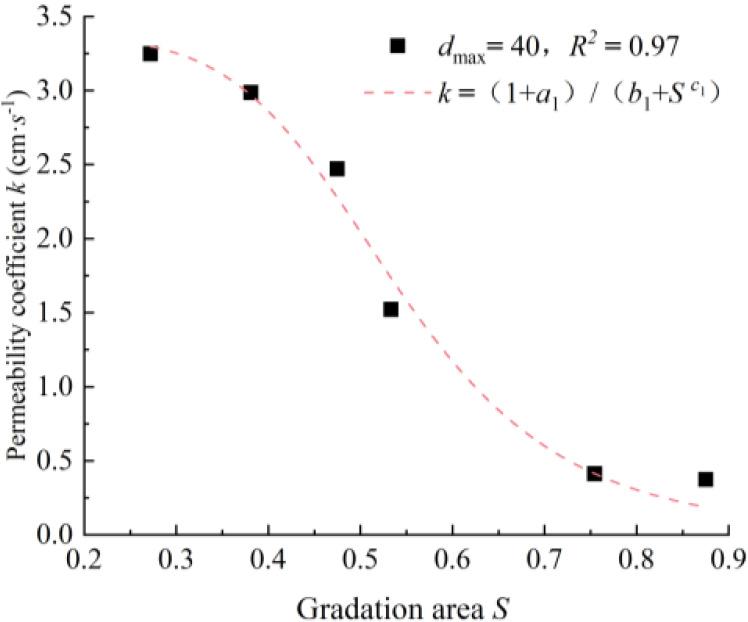
Figure 7.
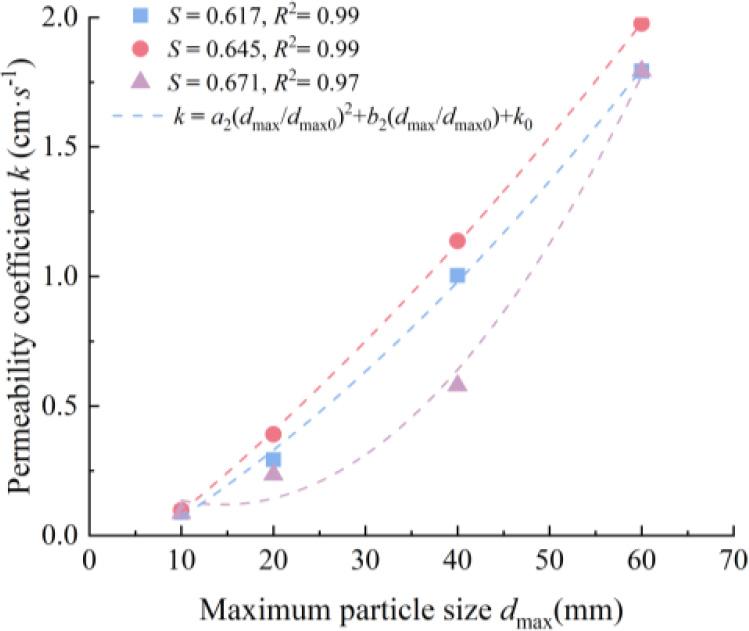
Figure 8.
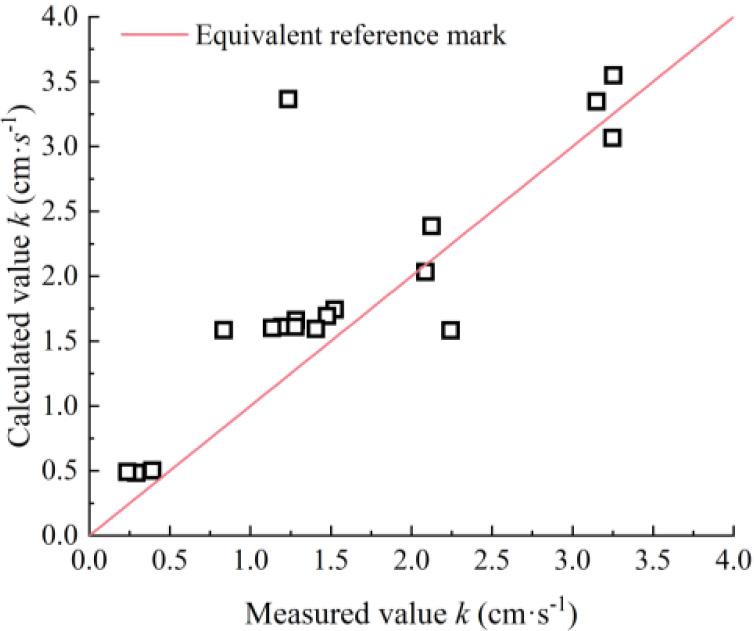
Figure 9.
![The relationship between the measured and fitted values of the permeability coefficient in literature [25] and the gradation area](https://sciendo-parsed.s3.eu-central-1.amazonaws.com/67b4bb00082aa65dea3f5570/j_amns-2025-0150_fig_009.jpg?X-Amz-Algorithm=AWS4-HMAC-SHA256&X-Amz-Content-Sha256=UNSIGNED-PAYLOAD&X-Amz-Credential=AKIA6AP2G7AKOUXAVR44%2F20251122%2Feu-central-1%2Fs3%2Faws4_request&X-Amz-Date=20251122T122100Z&X-Amz-Expires=3600&X-Amz-Signature=692bef1e21e0e0b623a334d3521f489766c61dab997c21ea191e15cc89c8372a&X-Amz-SignedHeaders=host&x-amz-checksum-mode=ENABLED&x-id=GetObject)
Fitting results of Equation (5) for samples 9 to 18
| S | a2 (10-4) | b2 | k0 | R2 |
|---|---|---|---|---|
| 0.617 | 7.983 | -0.023 | 0.287 | 0.99 |
| 0.645 | 1.594 | 0.026 | -0.192 | 0.99 |
| 0.671 | 2.148 | 0.020 | -0.147 | 0.97 |
Fitting results of Equation (6) for samples 1 to 18
| Fitting Parameters | Numerical Value |
|---|---|
| a | 0.020 |
| b | 0.036 |
| c | -0.977 |
| e | 8.566 |
| f | 0.020 |
| R2 | 0.833 |
Fitting literature [25] results
| Gradation Area |
Permeability Coefficient |
Error Values (%) | ||
|---|---|---|---|---|
| Measured values | Predicted values | |||
| 0.510 | 60 | 4.000 | 3.916 | 2.138 |
| 0.571 | 60 | 4.435 | 4.325 | 2.480 |
| 0.636 | 60 | 3.300 | 3.461 | 4.889 |
| 0.699 | 60 | 3.350 | 3.391 | 3.112 |
Fitting results of Equation (4) for samples 1 to 6
| Fitting Parameters | Numerical Value |
|---|---|
| -0.909 | |
| 0.027 | |
| 5.851 | |
| 0.973 |
Grading parameters
| Test Number | Gradation Area |
Grading Parameters | ||
|---|---|---|---|---|
| 1 | 0.272 | 40 | 1.2 | -0.6 |
| 2 | 0.381 | 40 | 1.2 | 0.2 |
| 3 | 0.475 | 40 | 0.9 | 0.2 |
| 4 | 0.533 | 40 | 0.9 | 0.4 |
| 5 | 0.754 | 40 | 0.6 | 0.6 |
| 6 | 0.875 | 40 | 0.6 | 0.8 |
| 7 | 0.617 | 60 | 0.9 | 0.6 |
| 8 | 0.617 | 40 | 0.9 | 0.6 |
| 9 | 0.617 | 20 | 0.9 | 0.6 |
| 10 | 0.617 | 10 | 0.9 | 0.6 |
| 11 | 0.645 | 60 | 1.2 | 0.8 |
| 12 | 0.645 | 40 | 1.2 | 0.8 |
| 13 | 0.645 | 20 | 1.2 | 0.8 |
| 14 | 0.645 | 10 | 1.2 | 0.8 |
| 15 | 0.671 | 60 | 0.6 | 0.4 |
| 16 | 0.671 | 40 | 0.6 | 0.4 |
| 17 | 0.671 | 20 | 0.6 | 0.4 |
| 18 | 0.671 | 10 | 0.6 | 0.4 |