Systematic Evaluation and Meta-analysis of Traditional Chinese Medicine in the Treatment of Diabetic Nephropathy
, , , and
Mar 17, 2025

About this article
Published Online: Mar 17, 2025
Received: Oct 12, 2024
Accepted: Jan 31, 2025
DOI: https://doi.org/10.2478/amns-2025-0211
Keywords
© 2025 Xu Huang et al., published by Sciendo
This work is licensed under the Creative Commons Attribution 4.0 International License.
Figure 1.
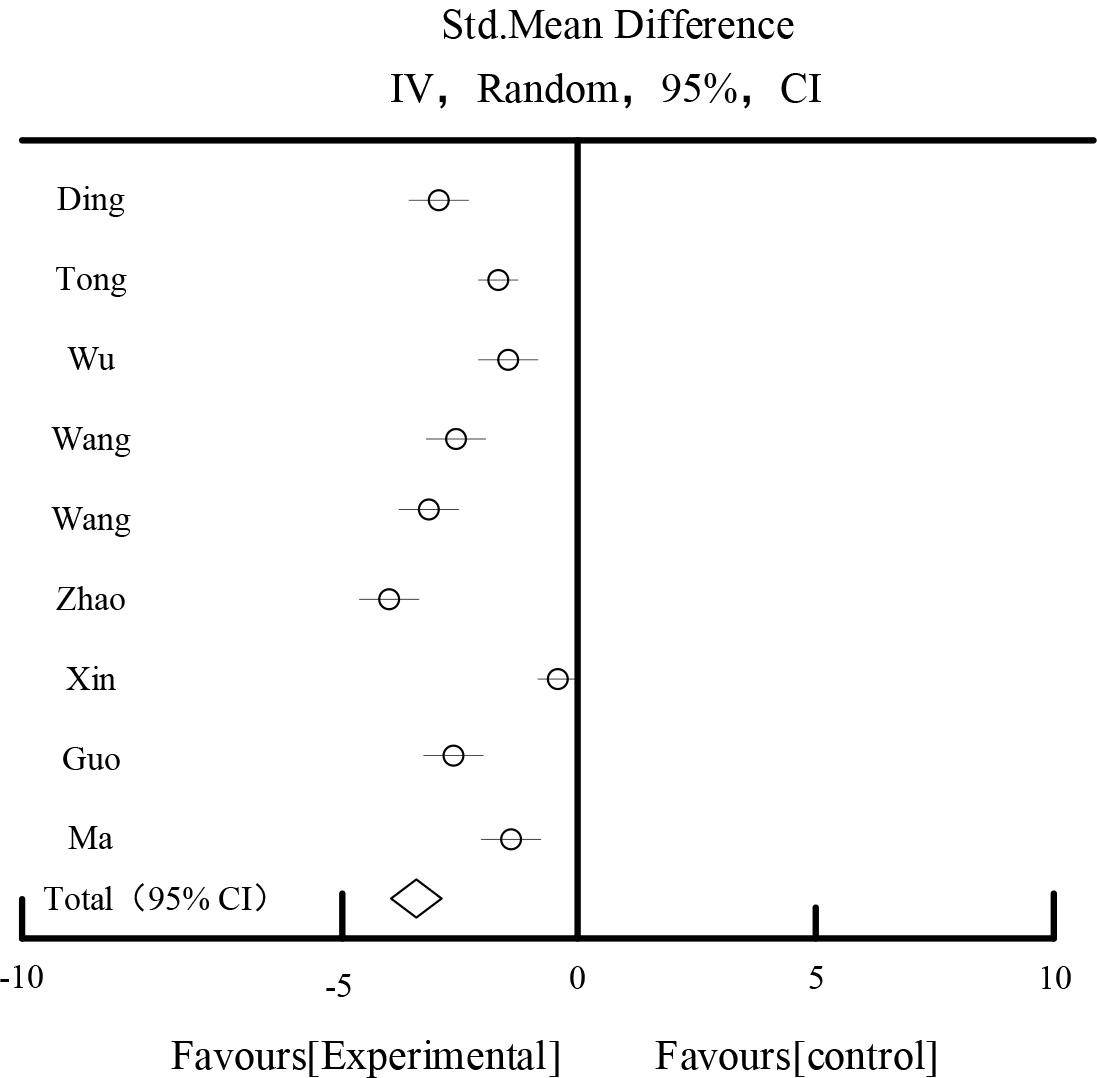
Figure 2.
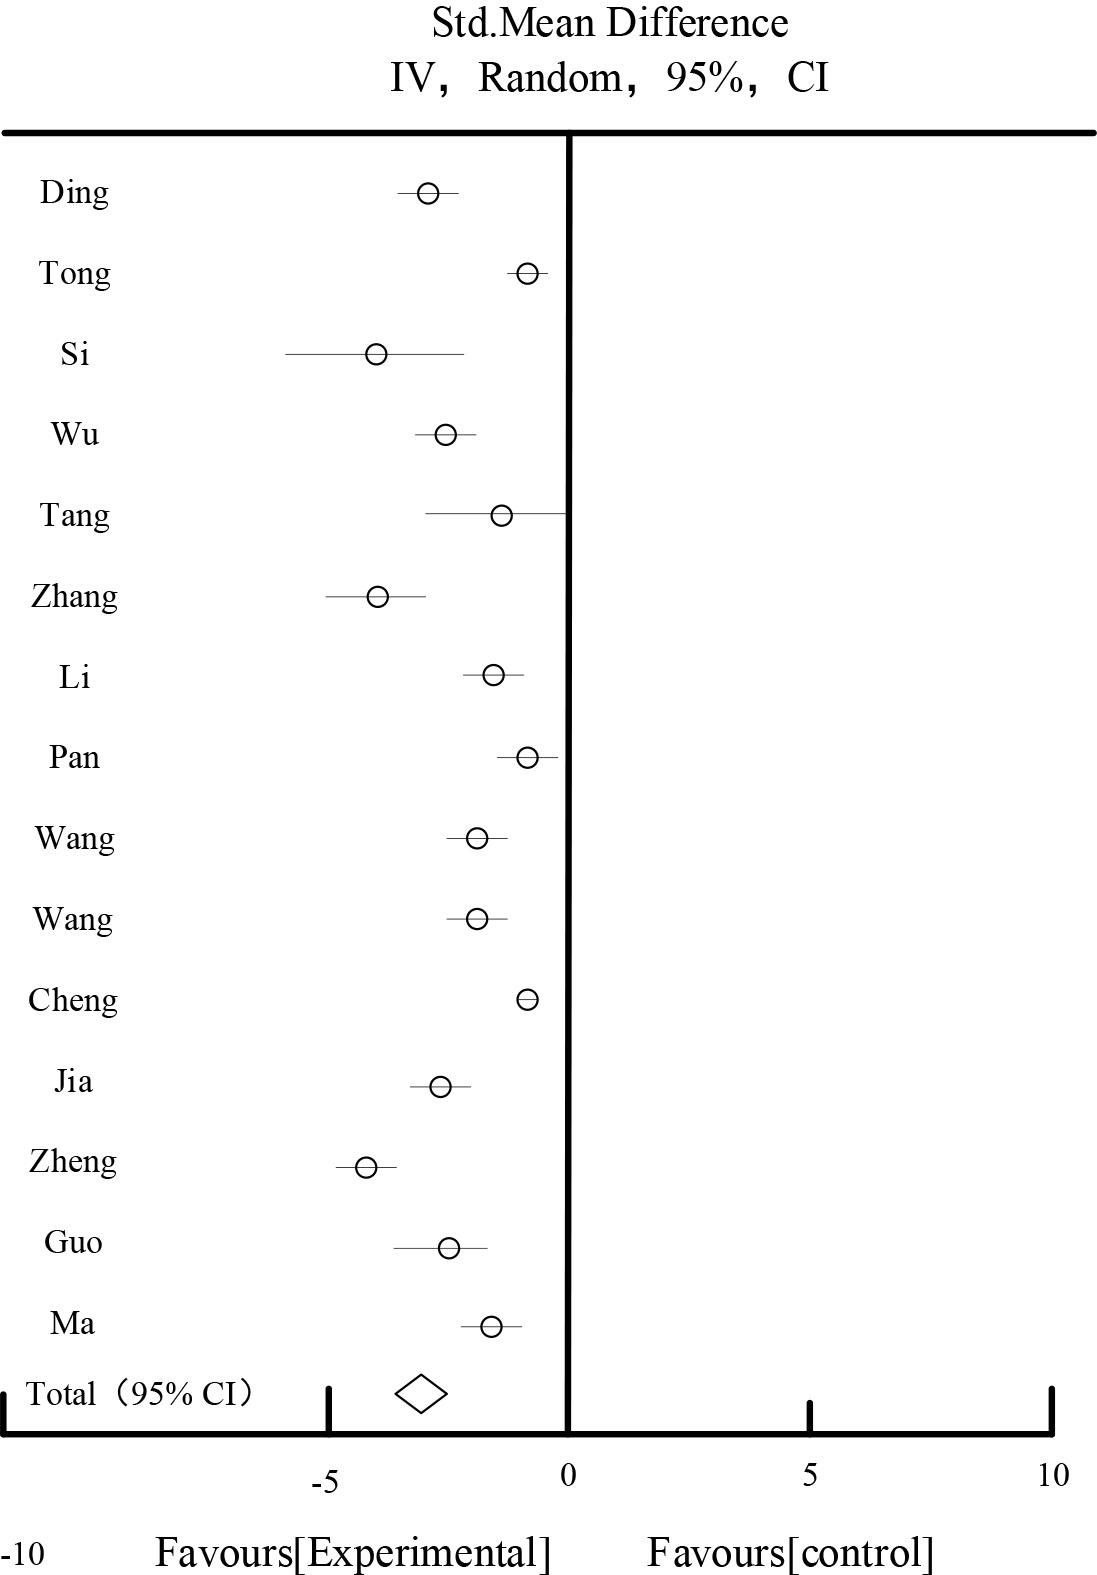
Figure 3.

Figure 4.
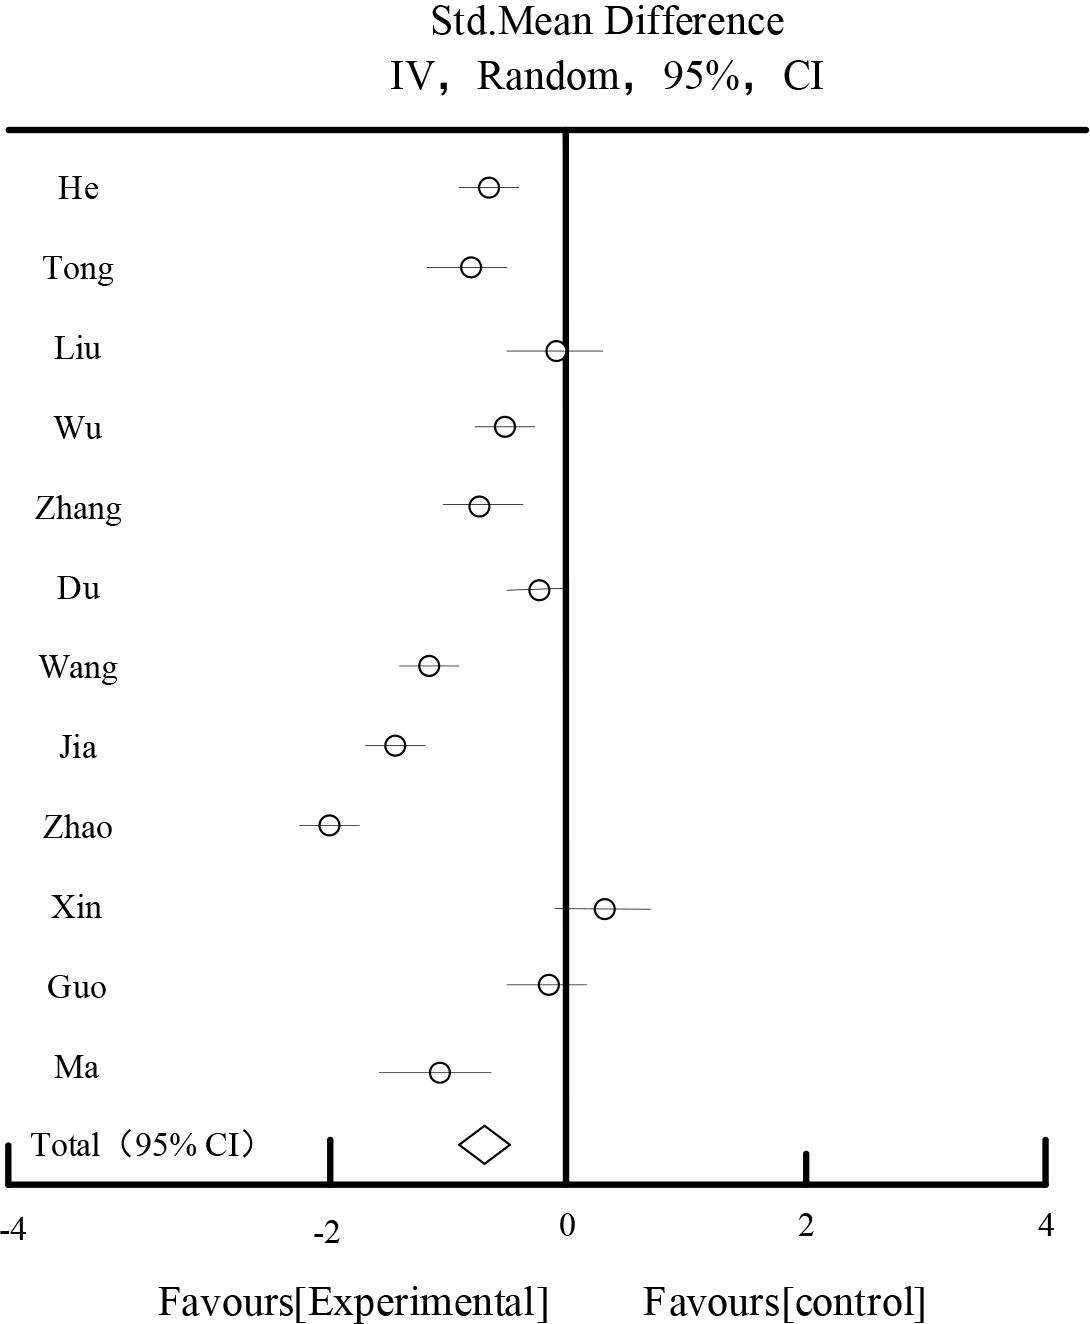
Figure 5.
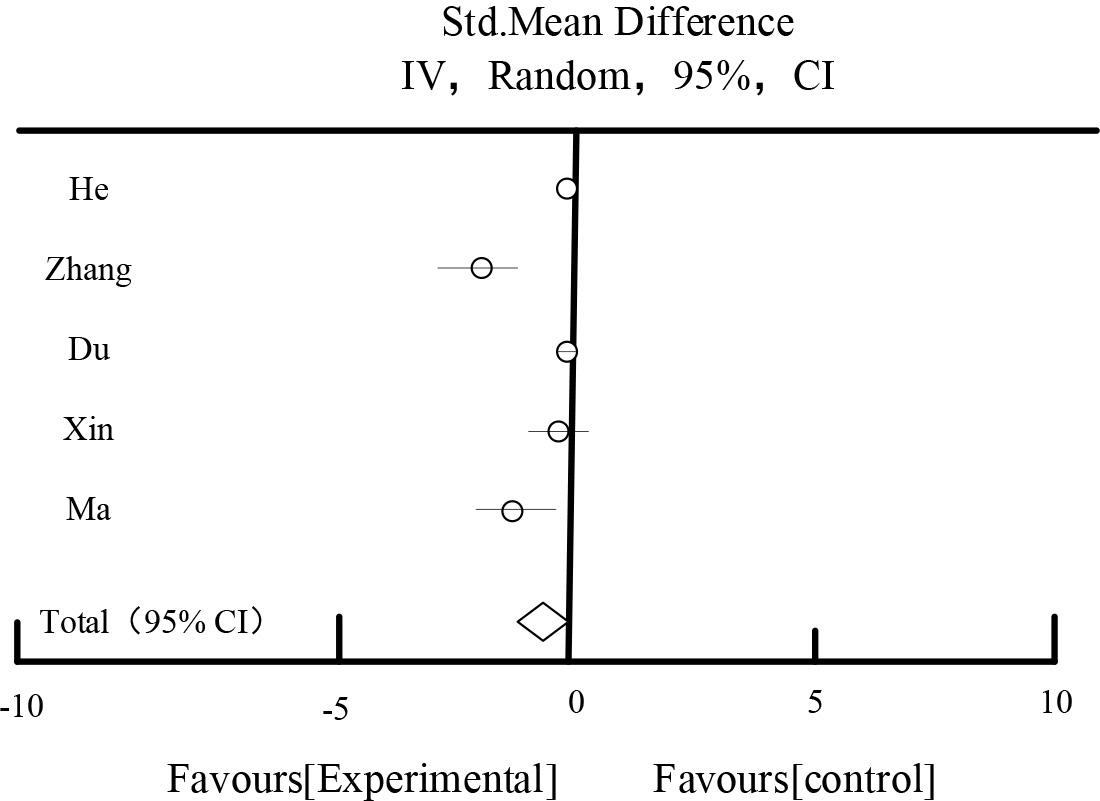
Figure 6.
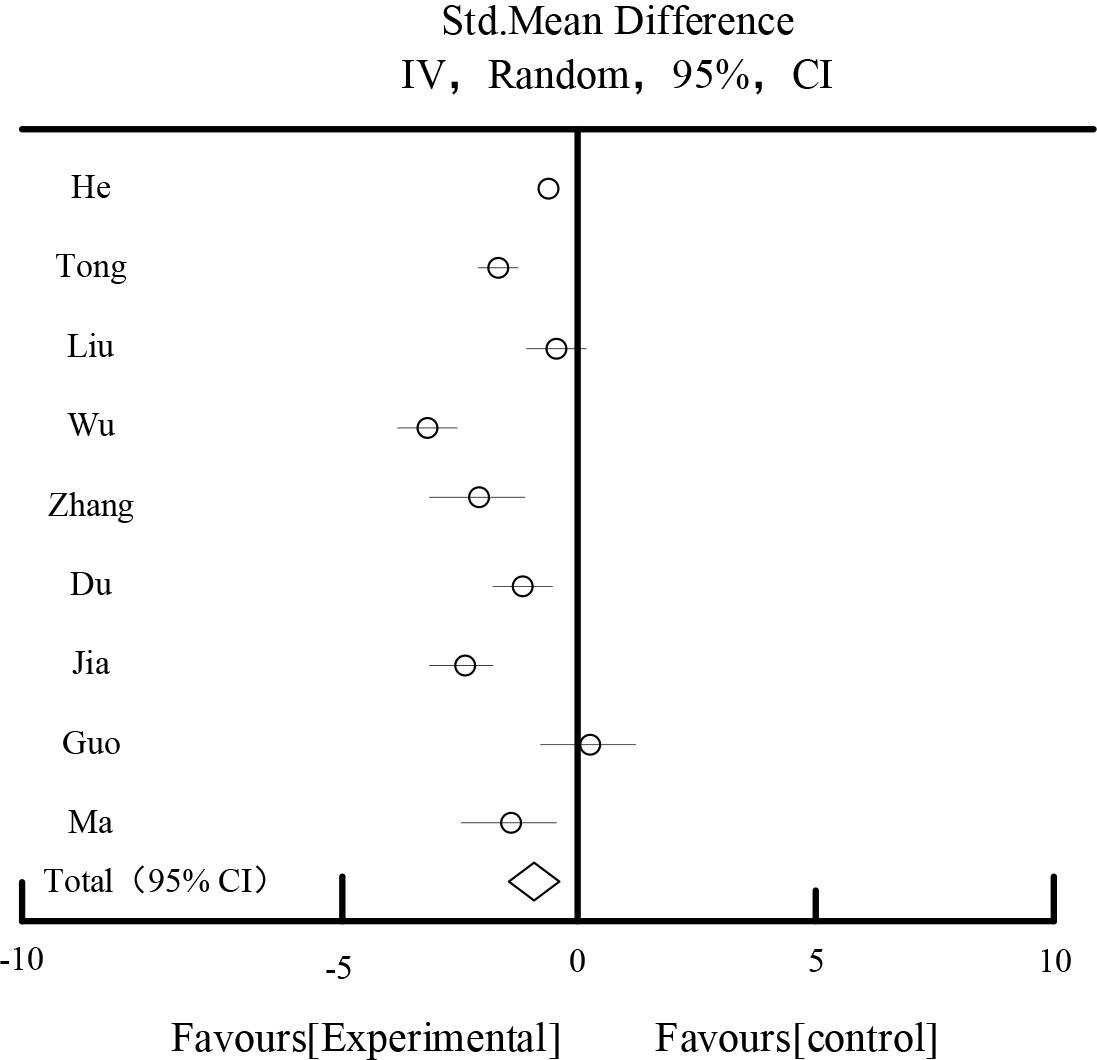
Figure 7.
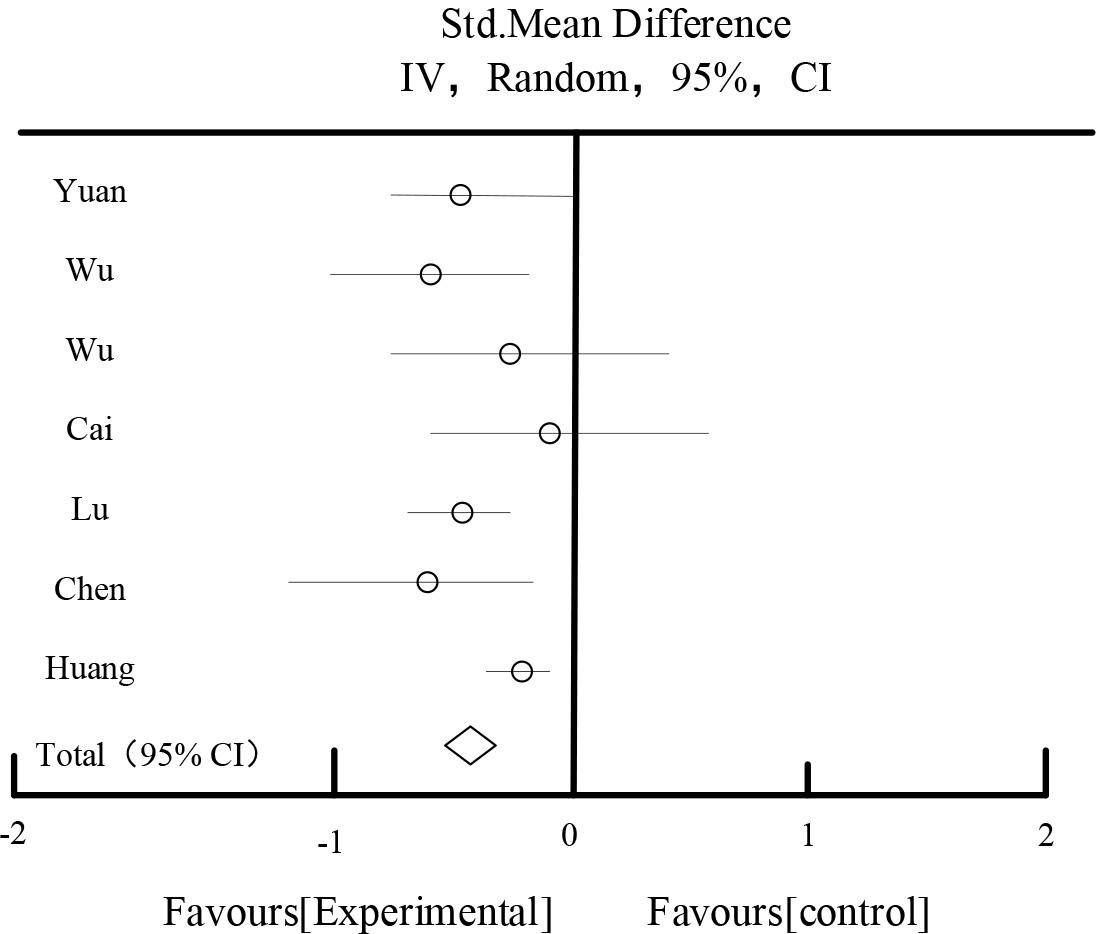
Figure 8.
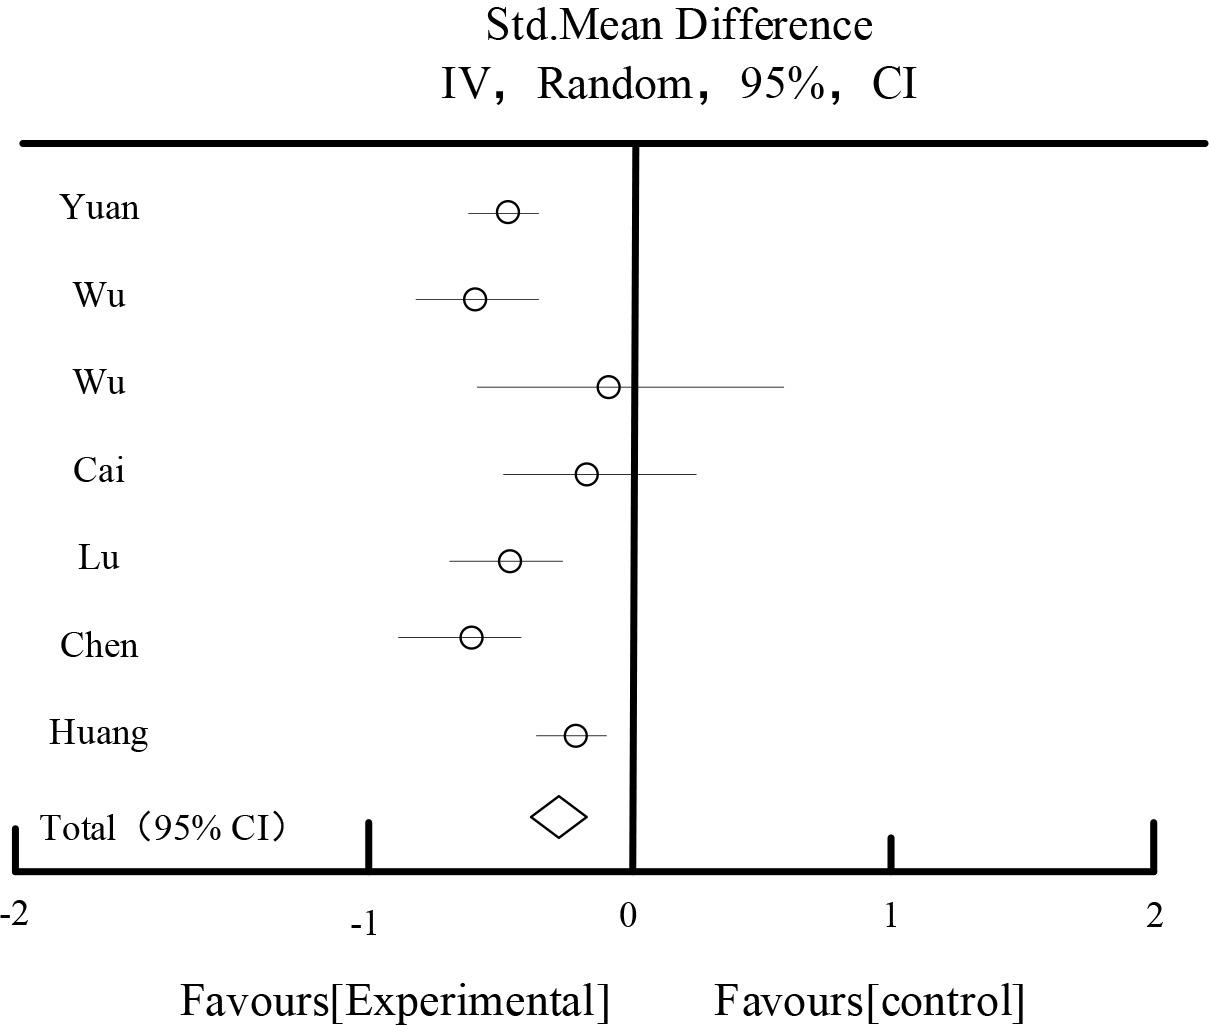
Figure 9
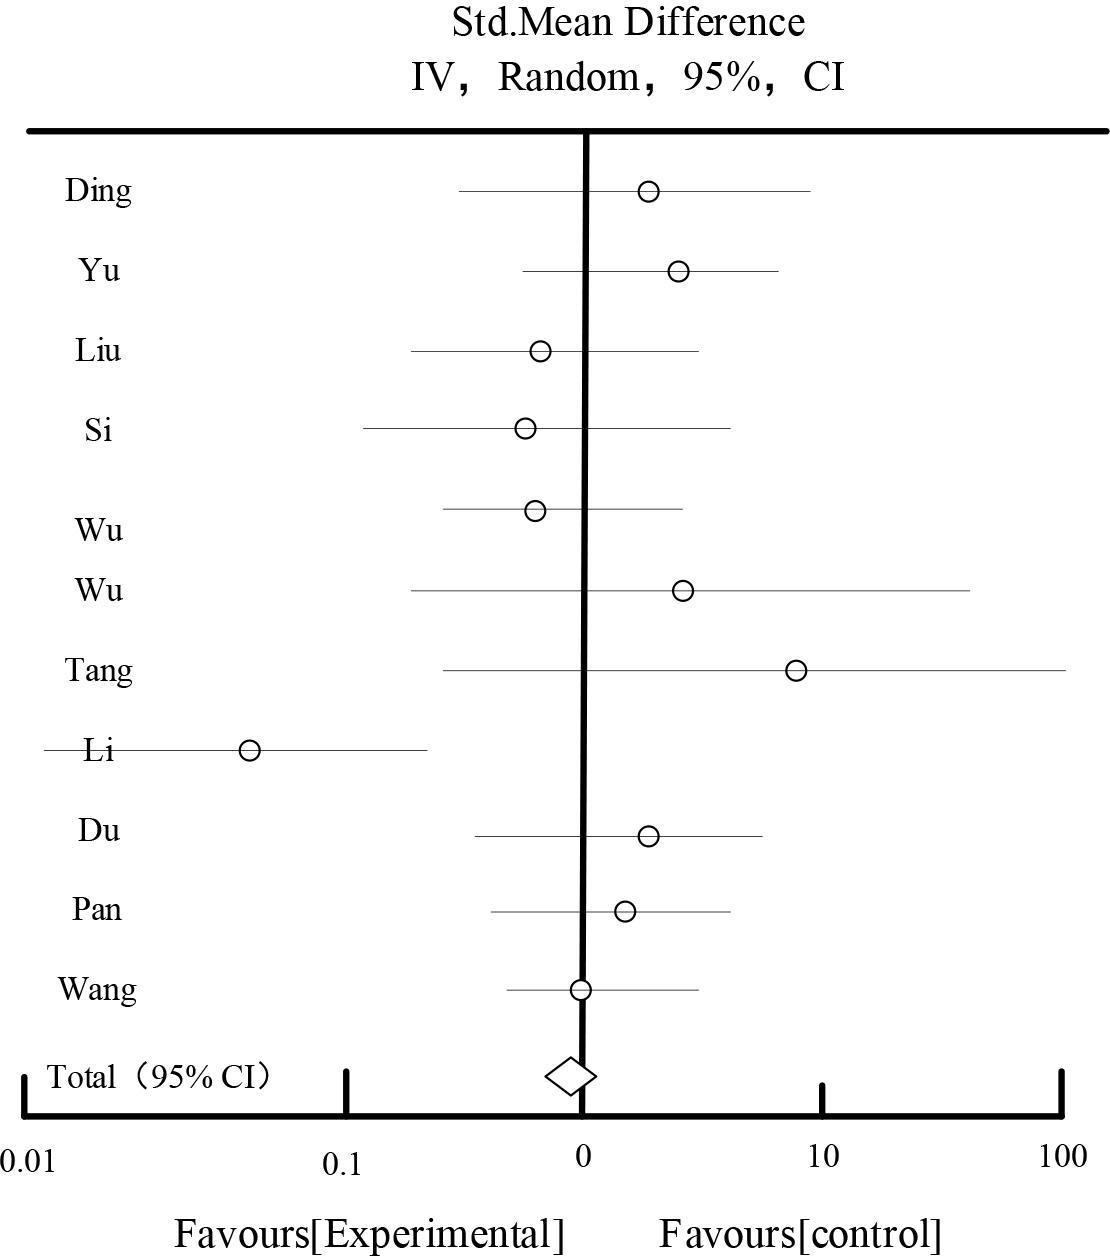
Figure 10.
UAER affects the result
| Study or Subgroup | Experiment | Control | Std,Mean Difference | |||||
|---|---|---|---|---|---|---|---|---|
| Mean | SD | Total | Mean | SD | Total | Weight | IV,Random,95%CI | |
| DL 2022 | 60.48 | 7.48 | 59 | 92.65 | 10.45 | 59 | 10.50% | -3.54[-4.12,-2.86] |
| TGQ 2018 | 83.64 | 14.65 | 68 | 109.56 | 16.85 | 68 | 11.49% | -1.64[-2.03,-1.28] |
| WYP 2019 | 103.45 | 16.78 | 42 | 128.17 | 15.36 | 42 | 11.26% | -1.37[-1.85,-0.95] |
| WL 2019 | 67.82 | 15.59 | 59 | 109.66 | 25.88 | 59 | 11.12% | -1.97[-2.39,-1.49] |
| WZY 2021 | 56.28 | 11.69 | 46 | 83.24 | 15.62 | 46 | 11.24% | -2.29[-2.86,-1.76] |
| ZJJ 2020 | 45.56 | 9.08 | 53 | 86.18 | 12.28 | 53 | 10.76% | -3.78[-4.21,-3.18] |
| XSH 2014 | 315.48 | 121.65 | 40 | 376.15 | 138.45 | 40 | 11.37% | -0.42[-0.81,-0.02] |
| GXY 2022 | 113.45 | 25.69 | 38 | 158.96 | 27.69 | 38 | 11.11% | -1.61[-2.36,-1.28] |
| MMK 2020 | 54.69 | 14.89 | 41 | 68.18 | 20.18 | 41 | 11.15% | -0.71[-1.26,-0.32] |
| Total [95%CI] | 446 | 446 | 100% | -1.92[-2.59,-1.33] | ||||
Cholesterol effect
| Study or Subgroup | Experiment | Control | Std,Mean Difference | |||||
|---|---|---|---|---|---|---|---|---|
| Mean | SD | Total | Mean | SD | Total | Weight | IV,Random,95%CI | |
| YFY2011 | 4.56 | 0.78 | 38 | 5.09 | 0.96 | 26 | 9.26% | -0.49[-0.89,-0.05] |
| WS2014 | 5.23 | 1.26 | 34 | 5.95 | 1.15 | 34 | 6.15% | -0.89[-1.25,-0.29] |
| WQG2013 | 5.21 | 1.24 | 59 | 5.53 | 1.36 | 50 | 4.56% | -0.35[-0.97,0.32] |
| CJH2017 | 5.18 | 1.29 | 40 | 5.24 | 1.32 | 42 | 5.29% | -0.09[-0.67,0.6] |
| LWM2016 | 4.26 | 0.42 | 32 | 4.97 | 0.45 | 30 | 32.25% | -0.67[-0.98,-0.45] |
| CXB2013 | 3.25 | 0.86 | 31 | 4.26 | 0.62 | 30 | 11.26% | -0.93[-1.24,-0.59] |
| HSH2018 | 4.19 | 0.47 | 43 | 4.49 | 0.48 | 45 | 31.23% | -0.38[-0.57,-0.12] |
| Total[95%CI] | 277 | 257 | 100.00% | -0.58[-0.67,-0.34] | ||||
The effects of 2hPG
| Study or Subgroup | Experiment | Control | Std,Mean Difference | |||||
|---|---|---|---|---|---|---|---|---|
| Mean | SD | Total | Mean | SD | Total | Weight | IV,Random,95%CI | |
| HSN2021 | 9.26 | 0.36 | 128 | 9.29 | 0.36 | 128 | 29.36% | -0.15[-0.21,-0.08] |
| ZYL2022 | 6.23 | 1.83 | 61 | 7.46 | 2.06 | 61 | 14.56% | -1.27[-1.96,-0.56] |
| DXM2021 | 8.56 | 0.89 | 87 | 9.23 | 1.09 | 87 | 24.56% | -0.28[-0.59,0.02] |
| XSH2014 | 8.21 | 1.62 | 60 | 8.49 | 1.49 | 60 | 15.62% | -0.08[-0.79,0.53] |
| MMK2020 | 8.19 | 1.32 | 41 | 9.36 | 1.42 | 41 | 15.90% | -1.17[-1.89,-0.56] |
| Total[95%CI] | 377 | 377 | 100.00% | -0.58[-0.89,-0.15] | ||||
Bad reflection
| Study or Subgroup | Experiment | Control | Std,Mean Difference | |||
|---|---|---|---|---|---|---|
| Events | Total | Events | Total | Weight | IV,Random,95%CI | |
| DL2022 | 3 | 59 | 3 | 59 | 4.48% | 1.45[0.24,6.25] |
| YZX2019 | 9 | 38 | 7 | 38 | 7.59% | 1.42[0.41,4.66] |
| LT2016 | 5 | 35 | 7 | 35 | 10.23% | 0.67[0.19,2.45] |
| SYL2015 | 3 | 86 | 4 | 86 | 5.36% | 0.67[0.18,4.18] |
| WBJ2020 | 7 | 46 | 9 | 46 | 10.26% | 0.82[0.29,2.79] |
| WYP2019 | 1 | 42 | 2 | 42 | 1.79% | 1.87[0.19,23.36] |
| TCQ2021 | 1 | 45 | 2 | 45 | 0.89% | 5.24[0.29,113.26] |
| LQ2021 | 3 | 50 | 4 | 50 | 32.96% | 0.048[0.00,0.29] |
| DXM2021 | 5 | 87 | 4 | 87 | 4.68% | 1.43[0.37,6.25] |
| PXQ2016 | 9 | 45 | 10 | 45 | 6.26% | 1.28[0.31,4.56] |
| WL2019 | 11 | 59 | 10 | 59 | 15.50% | 0.97[0.37,2.66] |
| Total[95%CI] | 57 | 592 | 62 | 592 | 100% | 0.79[0.54,1.12] |
SCR impact results
| Study or Subgroup | Experiment | Control | Std,Mean Difference | |||||
|---|---|---|---|---|---|---|---|---|
| Mean | SD | Total | Mean | SD | Total | Weight | IV,Random,95%CI | |
| DL2022 | 83.45 | 10.96 | 59 | 10.45 | 13.12 | 59 | 5.56% | -23.65[-25.65,-17.85] |
| YZX2019 | 67.15 | 12.83 | 38 | 78.26 | 10.85 | 38 | 5.56% | -6.25[-12.36,-0.75] |
| LT2016 | 138.15 | 49.15 | 35 | 142.65 | 49.66 | 34 | 3.42% | -4.15[-28.65,20.26] |
| SYL2015 | 73.63 | 15.22 | 86 | 89.25 | 19.25 | 86 | 5.86% | -15.87[-21.36,-10.52] |
| WBJ2020 | 94.25 | 6.25 | 46 | 94.15 | 6.58 | 46 | 6.26% | -0.35[-2.94,2.36] |
| WYP2019 | 62.15 | 6.58 | 42 | 67.23 | 7.26 | 42 | 6.14% | -5.25[-8.26,-1.85] |
| TCQ2021 | 123.48 | 32.45 | 45 | 142.63 | 38.15 | 45 | 4.25% | -20.35[-36.78,-4.51] |
| LQ2021 | 70.26 | 8.25 | 50 | 75.96 | 8.89 | 50 | 5.66% | -4.87[-8.57,-1.15] |
| DXM2021 | 80.27 | 8.71 | 87 | 89.52 | 9.42 | 87 | 6.15% | -9.87[-12.65,-7.05] |
| PXQ2016 | 83.58 | 13.25 | 45 | 92.56 | 19.15 | 45 | 5.70% | -8.25[-15.78,-1.41] |
| WL2019 | 50.48 | 8.16 | 59 | 64.23 | 12.36 | 59 | 5.92% | -13.48[-17.89,-10.26] |
| WZY2021 | 96.26 | 25.65 | 46 | 133.25 | 37.45 | 46 | 6.15% | -37.85[-50.26,-24.56] |
| CLY2022 | 92.88 | 4.53 | 42 | 96.15 | 3.35 | 42 | 5.48% | -4.85[-5.26,-2.14] |
| JF2022 | 152.48 | 19.85 | 45 | 187.26 | 20.53 | 45 | 4.15% | -37.89[-45.78,-28.26] |
| XSH2014 | 89.24 | 31.25 | 40 | 87.63 | 33.25 | 40 | 5.60% | 2.59[-12.85,16.58] |
| ZXD2021 | 103.21 | 13.15 | 60 | 176.12 | 14.93 | 60 | 5.52% | -70.56[-78.59,-68.52] |
| GXY2022 | 70.29 | 11.21 | 38 | 70.26 | 11.32 | 38 | 5.15% | 0.00[-5.26,5.26] |
| MMK2020 | 80.65 | 12.38 | 41 | 88.26 | 11.58 | 41 | 7.47% | -7.26[-12.69,-2.48] |
| Total[95%CI] | 904 | 903 | 100% | -15.26[-23.25,-8.15] | ||||
The effect of BUN
| Study or Subgroup | Experiment | Control | Std,Mean Difference | |||||
|---|---|---|---|---|---|---|---|---|
| Mean | SD | Total | Mean | SD | Total | Weight | IV,Random,95%CI | |
| DL2022 | 7.15 | 1.05 | 59 | 9.76 | 1.56 | 59 | 6.26% | -2.45[-3.15,-2.36] |
| TGQ2018 | 6.21 | 0.82 | 68 | 6.21 | 0.96 | 68 | 7.26% | -0.75[-0.91,-0.42] |
| SYL2015 | 6.03 | 2.26 | 86 | 9.15 | 3.26 | 86 | 5.92% | -3.58[-4.25,-2.66] |
| WYP2019 | 3.64 | 0.41 | 42 | 5.36 | 0.52 | 42 | 7.63% | -1.95[-2.36,-1.75] |
| TCQ2021 | 10.05 | 2.46 | 45 | 11.25 | 2.26 | 45 | 5.53% | -1.15[-2.96,-0.28] |
| ZYL2022 | 7.32 | 2.02 | 62 | 10.63 | 2.06 | 62 | 6.21% | -3.15[-3.88,-2.36] |
| LQ2021 | 8.31 | 0.83 | 50 | 8.15 | 1.36 | 50 | 6.58% | -0.68[-1.02,-0.26] |
| PXQ2016 | 6.25 | 0.78 | 45 | 8 | 0.92 | 45 | 6.94% | -0.53[-0.86,-0.18] |
| WL2019 | 4.18 | 0.93 | 59 | 6.05 | 1.23 | 59 | 6.58% | -1.94[-2.36,-1.52] |
| WZY2021 | 5.92 | 0.71 | 46 | 7.55 | 0.85 | 46 | 7.63% | -2.03[-2.58,-1.76] |
| CLY2022 | 6.25 | 0.32 | 42 | 6.52 | 0.31 | 42 | 7.26% | -0.42[-0.51,-0.26] |
| JF2022 | 7.03 | 0.83 | 45 | 9.21 | 1.32 | 45 | 6.52% | -2.15[-2.68,-1.68] |
| ZXD2021 | 6.15 | 1.23 | 60 | 9.35 | 1.31 | 60 | 6.25% | -3.19[-3.58,-2.36] |
| GXY2022 | 6.25 | 0.95 | 38 | 8.15 | 1.46 | 38 | 6.25% | -1.37[-1.81,-0.86] |
| MMK2020 | 5.28 | 0.72 | 41 | 5.96 | 0.86 | 41 | 7.18% | -0.18[-0.97,-0.26] |
| Total[95%CI] | 788 | 788 | 100% | -1.78[-2.18,-1.23] | ||||
Effects of glycosylated hemoglobin
| Study or Subgroup | Experiment | Control | Std,Mean Difference | |||||
|---|---|---|---|---|---|---|---|---|
| Mean | SD | Total | Mean | SD | Total | Weight | IV,Random,95%CI | |
| HSN2021 | 6.24 | 0.38 | 128 | 0.38 | 0.35 | 128 | 11.82% | -0.18[-0.26,-0.09] |
| TGQ2018 | 6.32 | 0.78 | 68 | 0.85 | 0.87 | 68 | 11.32% | -0.52[-0.79,-0.26] |
| LT2016 | 6.48 | 0.35 | 35 | 0.56 | 0.52 | 35 | 11.46% | -0.18[-0.34,0.18] |
| WM2017 | 5.56 | 0.32 | 32 | 0.41 | 0.42 | 32 | 11.68% | -1.59[-1.67,-1.36] |
| ZYL2022 | 5.78 | 0.96 | 61 | 1.06 | 1.03 | 61 | 10.58% | -0.95[-1.25,-0.62] |
| DXM2021 | 5.79 | 0.64 | 87 | 0.78 | 0.79 | 87 | 11.69% | -0.78[-0.95,-0.52] |
| JF2022 | 6.56 | 0.45 | 45 | 0.63 | 0.64 | 45 | 11.56% | -1.27[-1.56,-1.03] |
| GXY2022 | 7.15 | 1.29 | 38 | 1.32 | 1.33 | 38 | 9.26% | 0.08[-0.56,0.67] |
| MMK2020 | 6.26 | 0.84 | 41 | 0.97 | 0.98 | 41 | 10.63% | -0.84[-1.14,-0.49] |
| Total[95%CI] | 535 | 535 | 100.00% | -0.69[-1.29,-0.29] | ||||
Effects of triglycerides
| Study or Subgroup | Experiment | Control | Std,Mean Difference | |||||
|---|---|---|---|---|---|---|---|---|
| Mean | SD | Total | Mean | SD | Total | Weight | IV,Random,95%CI | |
| YFY2011 | 0.81 | 0.18 | 38 | 1.18 | 0.29 | 26 | 45.00% | -0.38[-0.49,-0.23] |
| WS2014 | 2.03 | 0.56 | 34 | 2.56 | 0.56 | 34 | 9.56% | -0.57[-0.78,-0.28] |
| WQG2013 | 1.79 | 0.84 | 59 | 1.79 | 1.24 | 50 | 2.23% | -0.03[-0.57,0.58] |
| CJH2017 | 1.53 | 0.83 | 40 | 1.64 | 0.83 | 42 | 4.21% | -0.12[-0.49,0.27] |
| LWM2016 | 1.89 | 0.67 | 32 | 2.23 | 0.59 | 30 | 5.59% | -0.37[-0.67,-0.08] |
| CXB2013 | 1.75 | 0.63 | 31 | 2.34 | 0.98 | 30 | 3.25% | -0.68[-1.06,-0.29] |
| HSH2018 | 1.59 | 0.34 | 43 | 1.85 | 0.31 | 45 | 30.16% | -0.27[-0.42,-0.19] |
| Total[95%CI] | 277 | 257 | 100.00% | -0.37[-0.48,-0.29] | ||||
FBG effect
| Study or Subgroup | Experiment | Control | Std,Mean Difference | |||||
|---|---|---|---|---|---|---|---|---|
| Mean | SD | Total | Mean | SD | Total | Weight | IV,Random,95%CI | |
| HSN2021 | 6.34 | 0.38 | 128 | 6.48 | 0.32 | 129 | 9.52% | -0.51[-0.64,-0.45] |
| TGQ2018 | 5.82 | 1.26 | 68 | 6.35 | 1.89 | 68 | 7.24% | -0.92[-1.48,-0.32] |
| LT2016 | 7.18 | 0.98 | 35 | 7.12 | 1.02 | 35 | 7.89% | 0.03[-0.48,0.53] |
| WM2017 | 6.25 | 0.62 | 32 | 7.03 | 0.68 | 30 | 8.56% | -0.48[-0.79,-0.12] |
| ZYL2022 | 5.25 | 1.02 | 61 | 6.05 | 1.25 | 60 | 8.25% | -0.67[-1.19,-0.27] |
| DXM2021 | 6.19 | 0.57 | 87 | 6.25 | 0.69 | 87 | 9.05% | -0.15[-0.32,0.08] |
| WZY2021 | 5.32 | 0.63 | 46 | 6.96 | 0.64 | 46 | 8.26% | -1.07[-1.37,-0.79] |
| JF2022 | 6.17 | 0.61 | 45 | 8.15 | 0.92 | 45 | 8.59% | -1.59[-1.87,-1.12] |
| ZJH2017 | 5.32 | 0.82 | 68 | 8.26 | 0.98 | 65 | 8.15% | -2.48[-2.68,-2.14] |
| XSH2014 | 7.19 | 0.73 | 60 | 5.56 | 0.96 | 60 | 8.59% | 0.19[-0.19,0.56] |
| GXY2022 | 5.15 | 0.94 | 38 | 7.26 | 1.03 | 38 | 8.15% | -0.18[-0.59,0.38] |
| MMK2020 | 6.18 | 1.26 | 41 | 7.89 | 1.01 | 41 | 7.75% | -1.38[-1.89,-0.74] |
| Total[95%CI] | 709 | 704 | 100% | -0.79[-1.08,-0.39] | ||||