Research on the path and optimisation of sustainable regional economic development based on big data analysis
Mar 17, 2025

About this article
Published Online: Mar 17, 2025
Received: Oct 30, 2024
Accepted: Feb 17, 2025
DOI: https://doi.org/10.2478/amns-2025-0160
Keywords
© 2025 Jieni Ma, published by Sciendo
This work is licensed under the Creative Commons Attribution 4.0 International License.
Figure 1.
Figure 2.
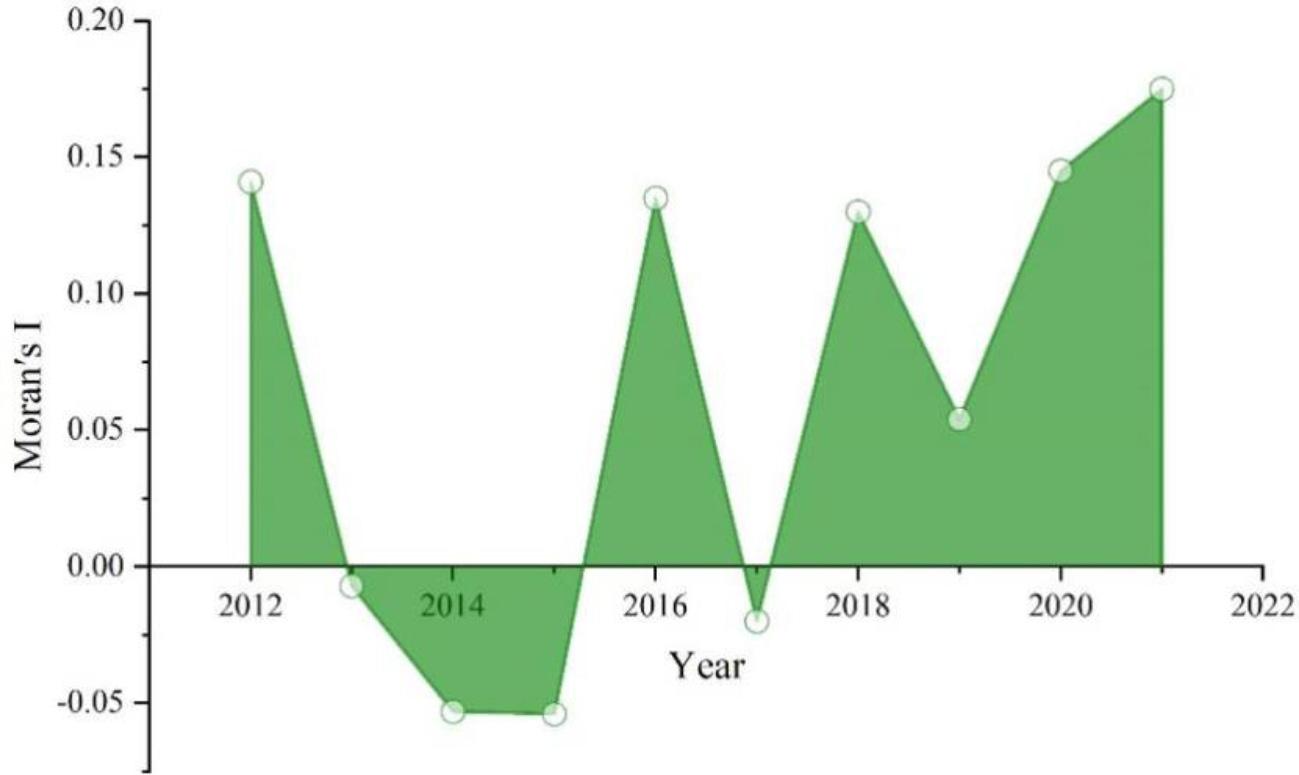
Figure 3.
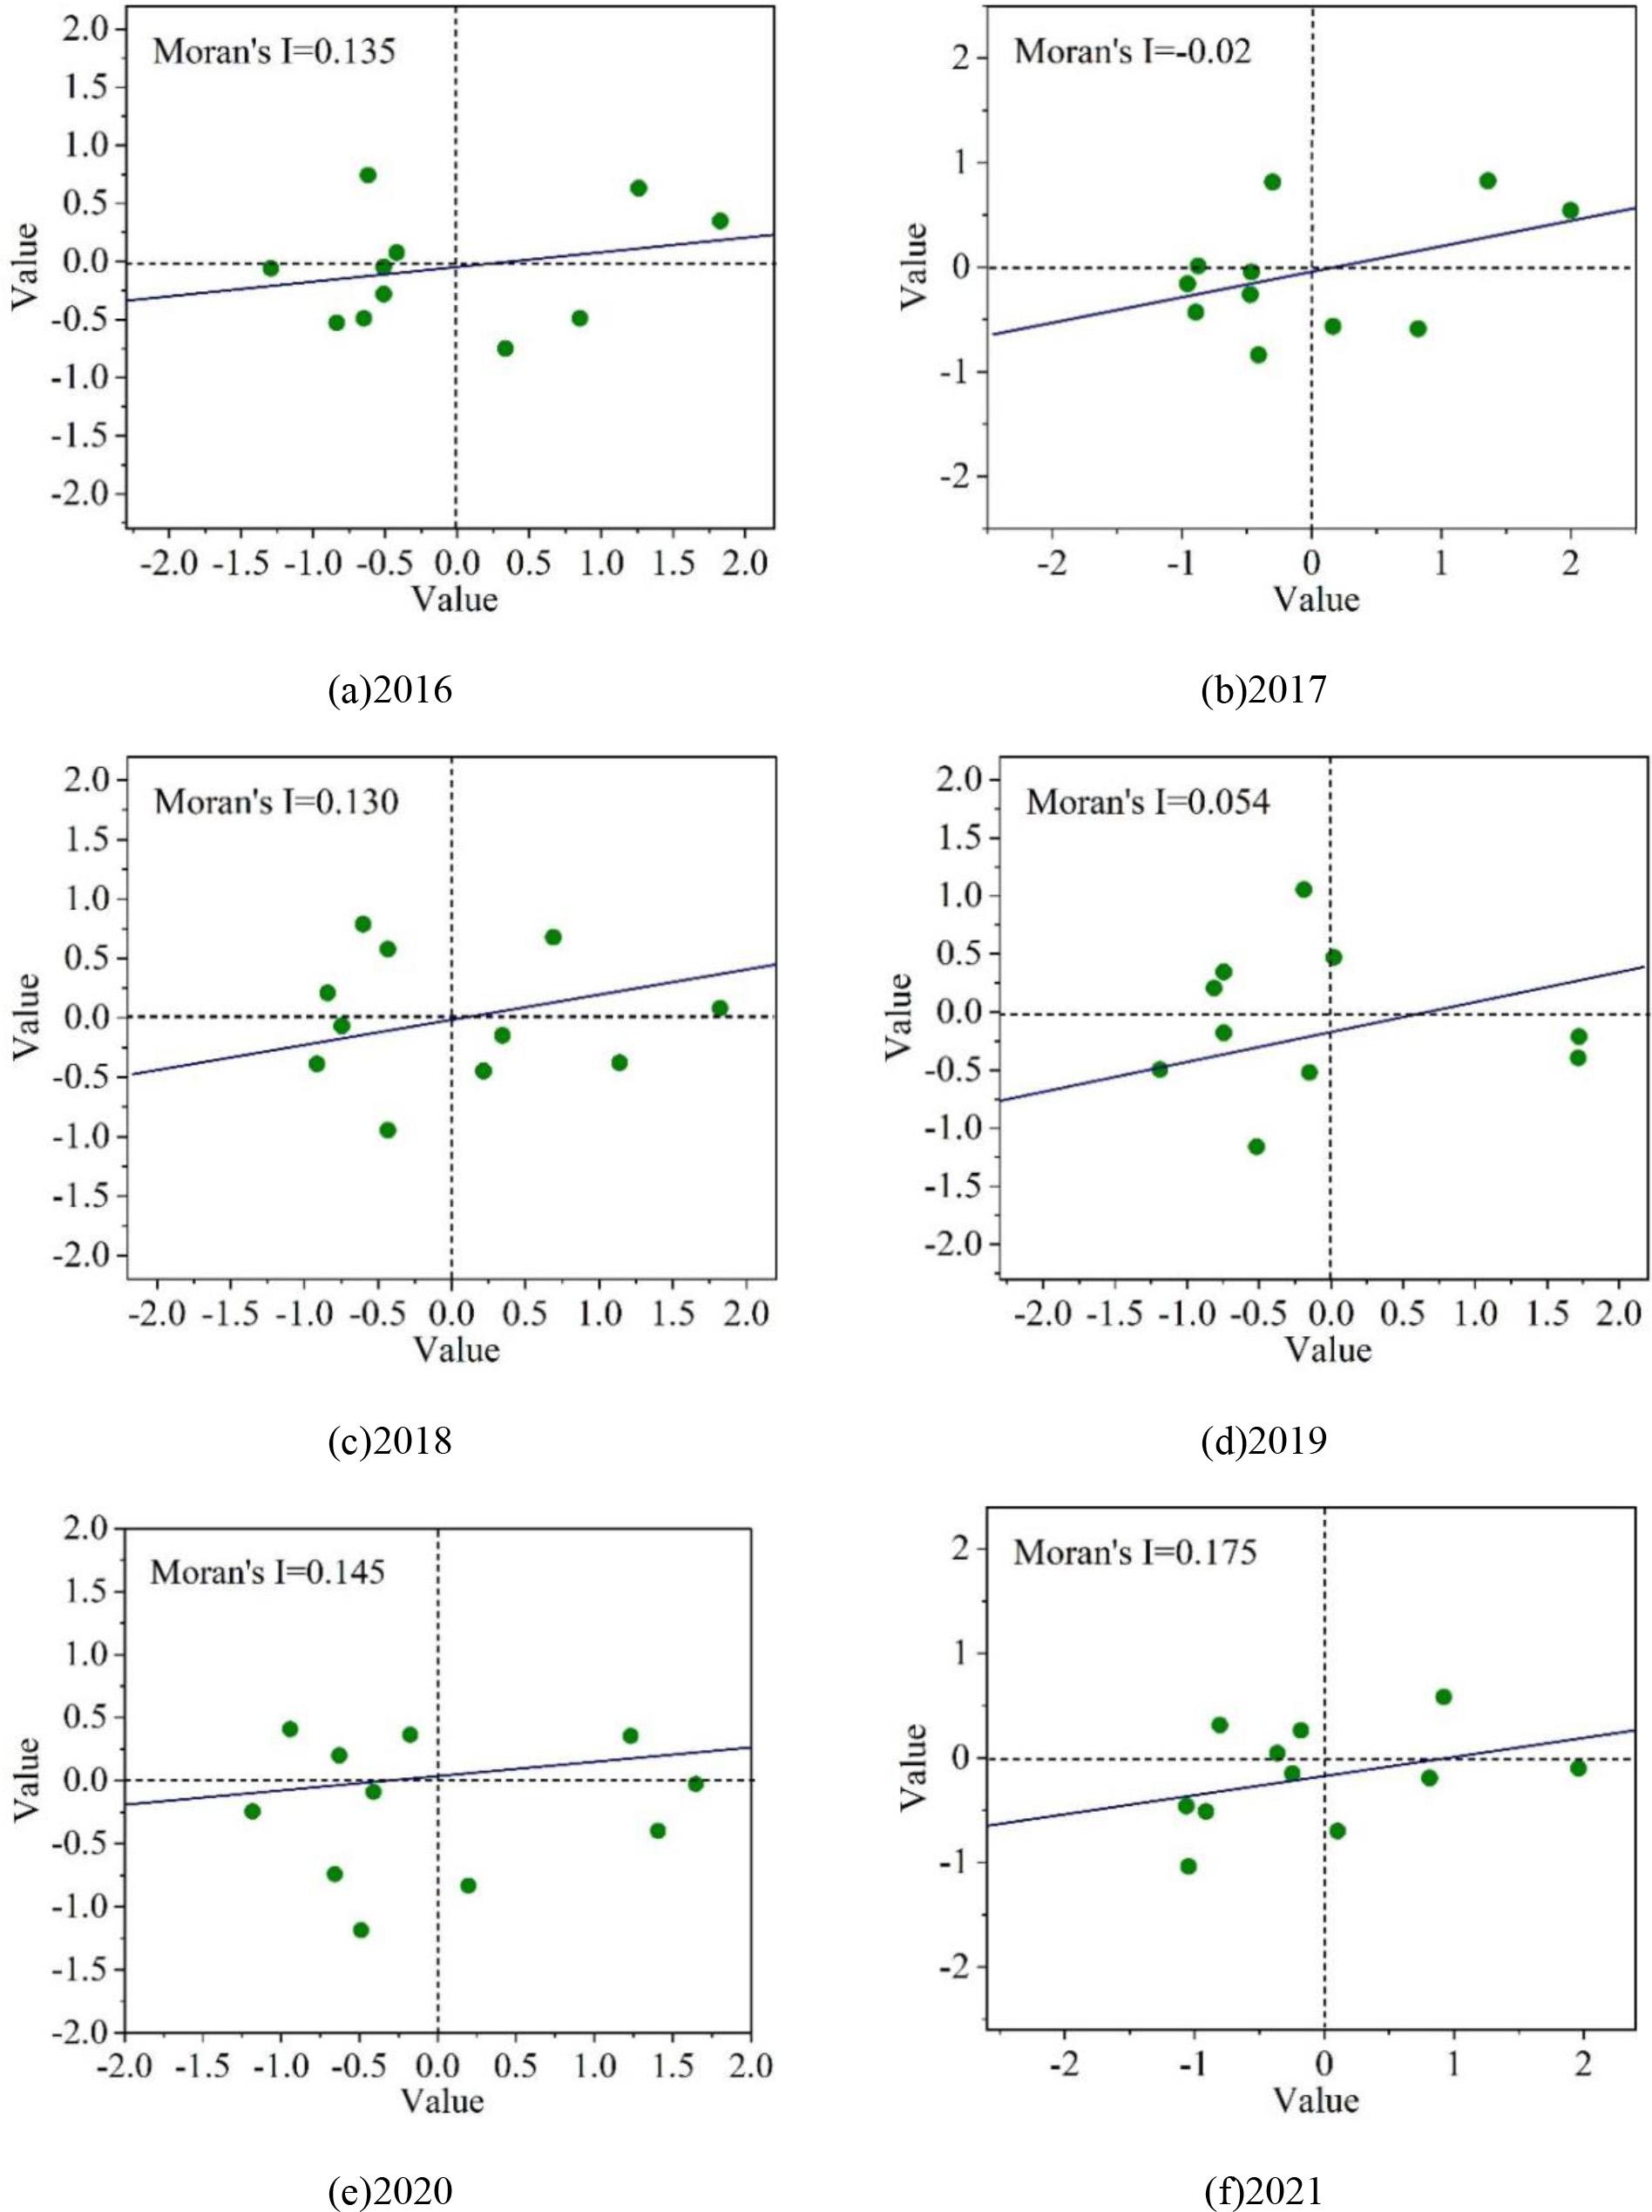
Figure 4.
Global self-correlation analysis
| Year | Moran′s I | E(I) | Mean | Sd | P value | Z(I) |
| 2012 | 0.141 | -0.001 | -0.094 | 0.223 | 0.164 | 1.044 |
| 2013 | -0.007 | -0.001 | -0.092 | 0.236 | 0.339 | 0.365 |
| 2014 | -0.053 | -0.001 | -0.085 | 0.229 | 0.402 | 0.158 |
| 2015 | -0.054 | -0.001 | -0.083 | 0.233 | 0.404 | 0.129 |
| 2016 | 0.135 | -0.001 | -0.09 | 0.229 | 0.032 | 0.348 |
| 2017 | -0.02 | -0.001 | -0.09 | 0.232 | 0.333 | 0.317 |
| 2018 | 0.13 | -0.001 | -0.093 | 0.235 | 0.175 | 0.938 |
| 2019 | 0.054 | -0.001 | -0.101 | 0.237 | 0.242 | 0.635 |
| 2020 | 0.145 | -0.001 | -0.106 | 0.239 | 0.156 | 1.053 |
| 2021 | 0.175 | -0.001 | -0.097 | 0.226 | 0.126 | 1.239 |
Regional economic sustainable development level evaluation index system
| Title | Evaluation index | Symbol |
| Regional economic sustainability | GDP | Q1 |
| The added value of the first production | Q2 | |
| Industrial added value | Q3 | |
| The added value of the third industry | Q4 | |
| The number of employees at the end of the year | Q5 | |
| Total retail sales of consumer goods | Q6 | |
| The actual use of foreign capital | Q7 | |
| The balance of the year-end balance of urban and rural residents | Q8 | |
| The whole club will invest in fixed assets | Q9 | |
| Local budget internal income | Q10 | |
| Expenditure within the general budget of local finances | Q11 |
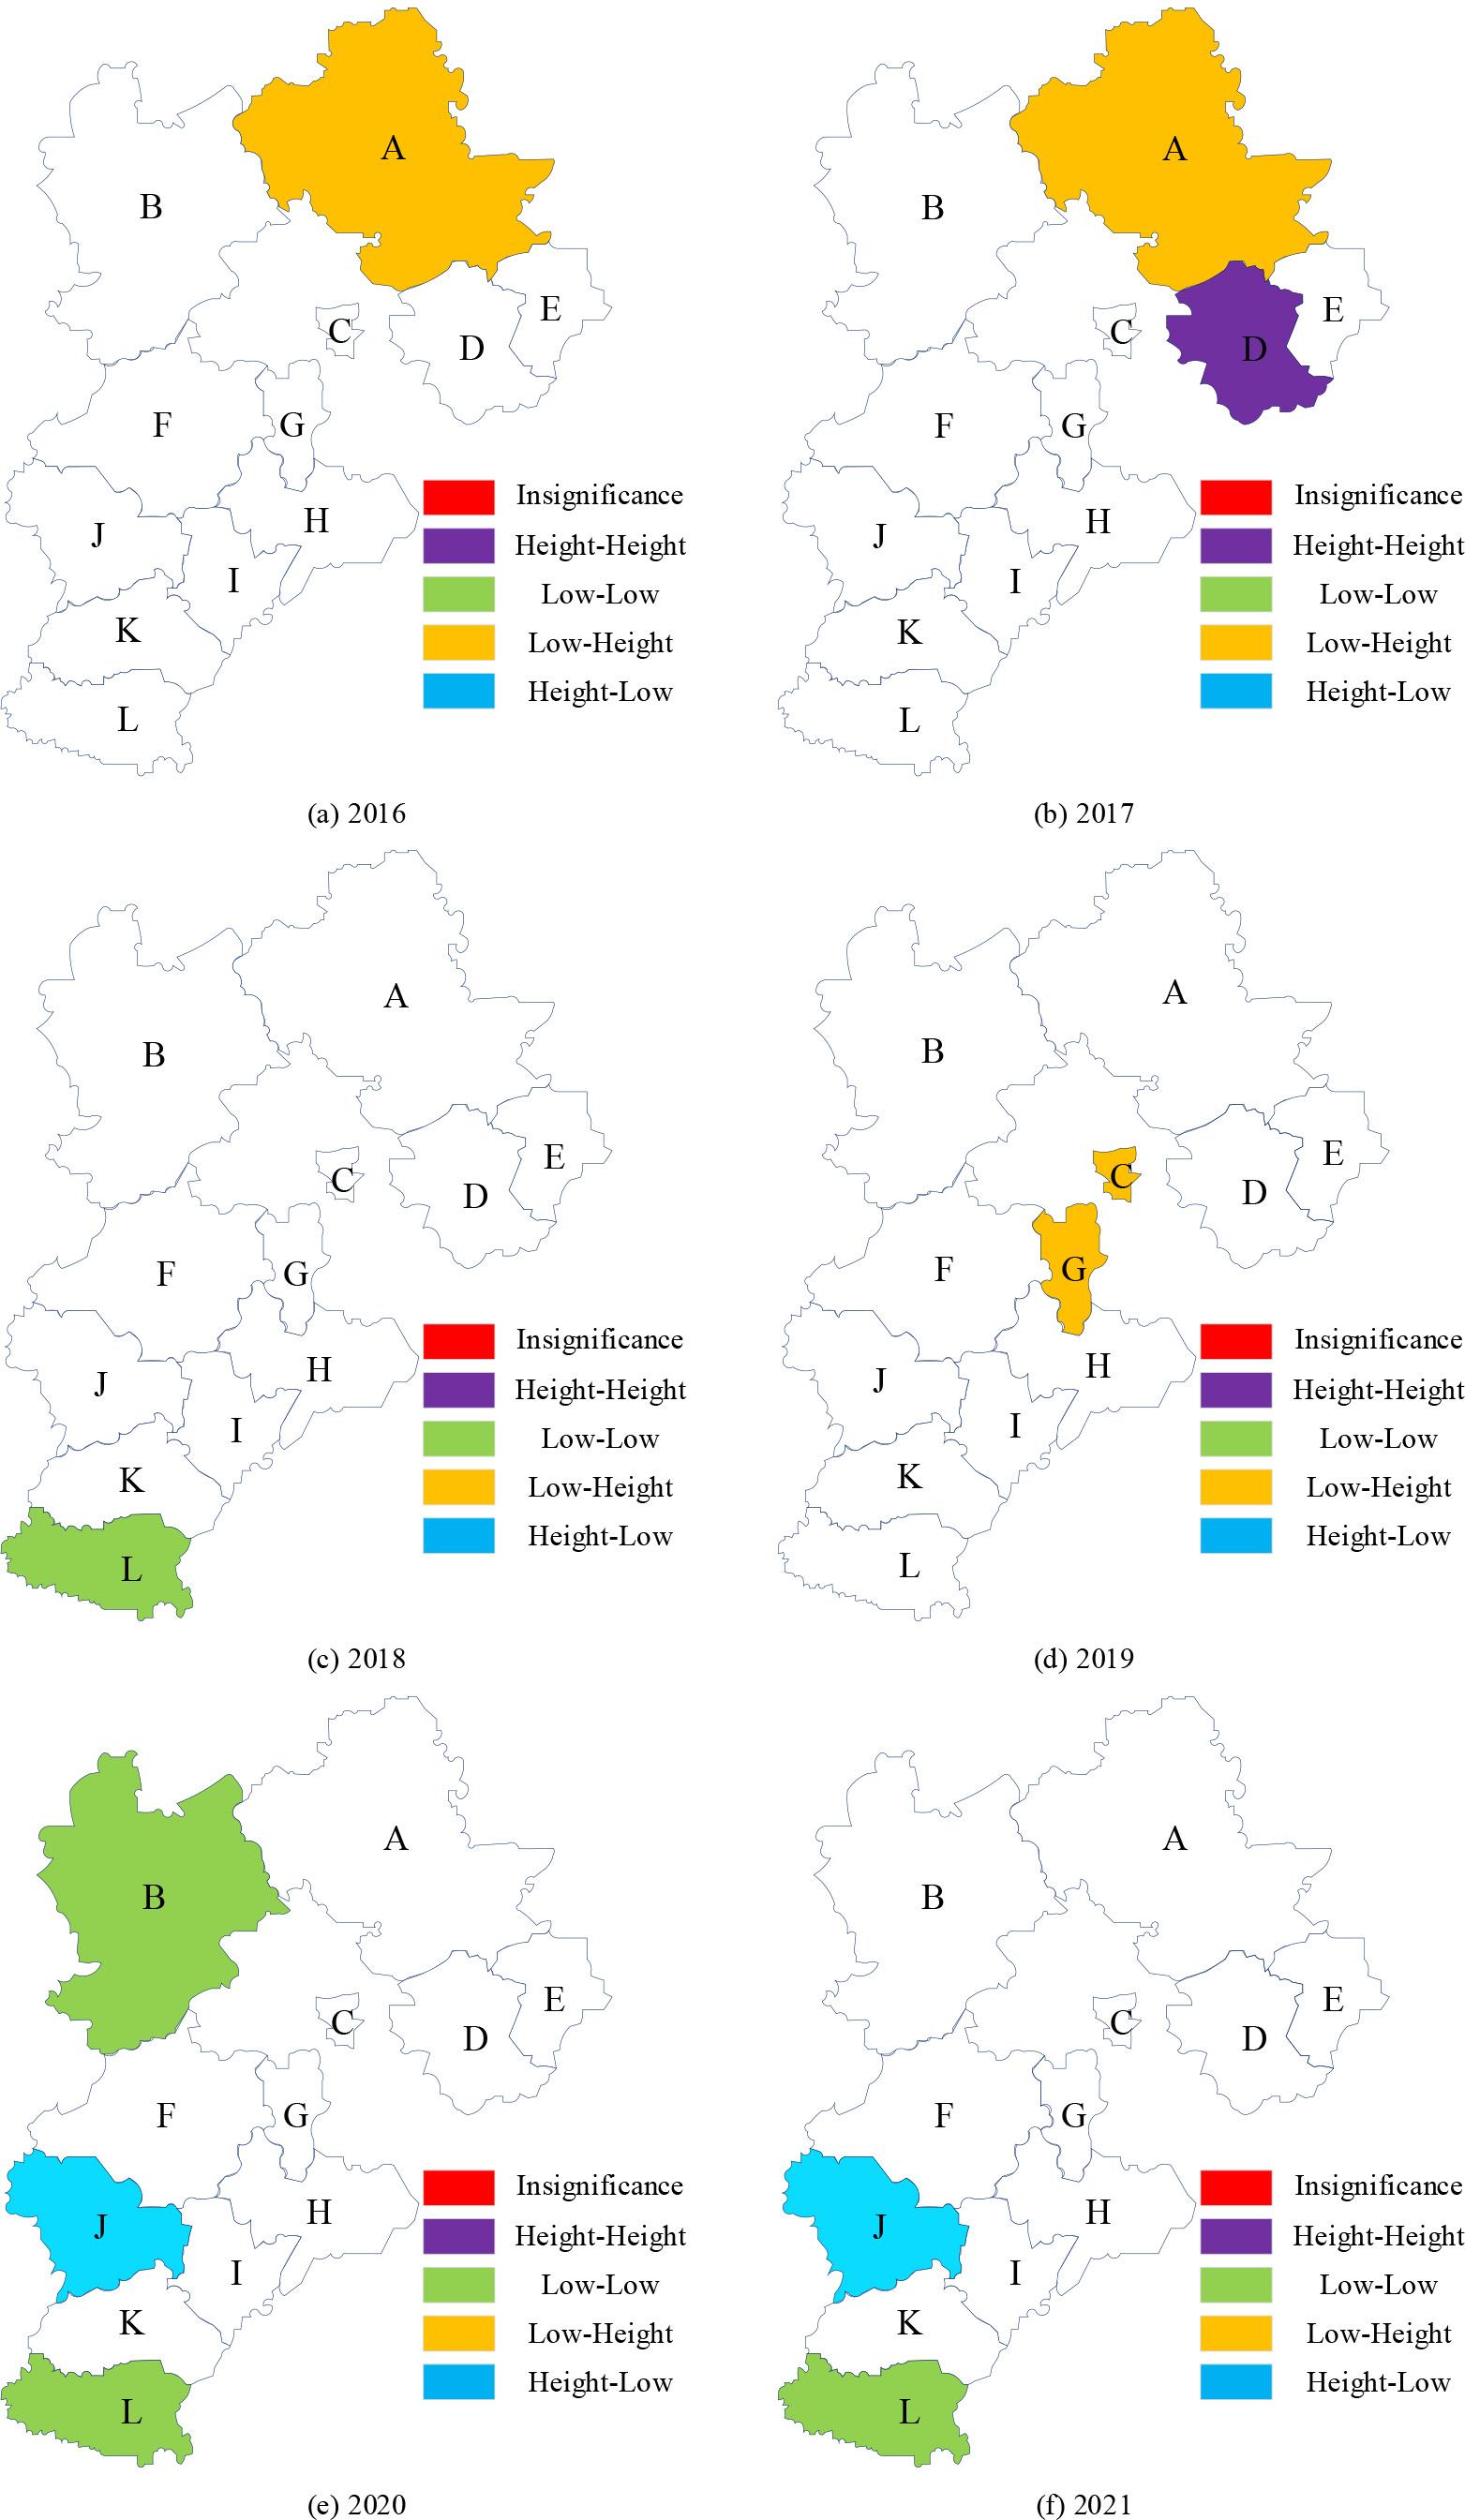
The Moran scattered quadrant distribution in 11 regions of a province
| Quadrant | 2016 | 2017 | 2018 | 2019 | 2020 | 2021 |
| First quadrant | 2 | 2 | 2 | 2 | 1 | 2 |
| Second quadrant | 2 | 1 | 3 | 3 | 3 | 3 |
| Third quadrant | 5 | 6 | 3 | 4 | 4 | 4 |
| Fourth quadrant | 2 | 2 | 3 | 2 | 3 | 2 |
The fixed effect of panel data is analyzed
| Variable | Model 1 | Model 2 | Model 3 | Model 4 | Model 5 | Model 6 |
| GDP | 0.023 (1.64) | 0.008 (1.89) | ||||
| The added value of the first production | -0.001 (-0.34) | 0.006 (0.44) | ||||
| Industrial added value | -0.003 (-2.04) | 0.004 (2.47) | ||||
| The added value of the third industry | -0.006 (-0.18) | 0.015 (0.54) | ||||
| The number of employees at the end of the year | -0.035 (-0.88) | -0.026 (-0.39) | ||||
| Total retail sales of consumer goods | 0.008 (1.28) | 0.008 (0.76) | ||||
| The actual use of foreign capital | 0.006 (2.25) | 0.008 (2.28) | ||||
| The balance of the year-end balance of urban and rural residents | 0.005 (0.007) | -0.008 (-0.87) | ||||
| The whole club will invest in fixed assets | 0.004 (0.009) | -0.049 (-3.06) | ||||
| Local budget internal income | -0.038 (-2.66) | -0.057 (0.077) | ||||
| Expenditure within the general budget of local finances | 0.097 (0.022) | 0.066 (0.033) | ||||
| _cons | 0.174 (9.08) | 0.158 (6.08) | 0.115 (9.13) | 0.139 (49.08) | 0.104 (6.02) | 0.15 (2.12) |
| R2 | 0.047 | 0.022 | 0.036 | 0.001 | 0.066 | 0.214 |
| F | 2.414 | 1.041 | 2.733 | 0.046 | 7.175 | 3.538 |
Robustness test results
| Variable | Model 6 | Model 7 | Model 8 |
| Original model | Explain the variable lag issue | Replace the explanatory variable | |
| GDP | 0.018 (1.935) | 0.016 (1.934) | 0.019 (1.933) |
| The added value of the first production | 0.006 (0.485) | 0.005 (0.484) | 0.007 (0.483) |
| Industrial added value | -0.016 (-2.538) | -0.017 (-2.537) | -0.018 (-2.536) |
| The added value of the third industry | 0.015 (0.545) | 0.016 (0.546) | 0.014 (0.543) |
| The number of employees at the end of the year | 0.008 (0.805) | 0.009 (0.806) | 0.007 (0.804) |
| Total retail sales of consumer goods | 0.008 (2.335) | 0.007 (2.334) | 0.007 (2.334) |
| The actual use of foreign capital | -0.008 (-0.915) | -0.007 (-0.914) | -0.009 (-0.913) |
| The balance of the year-end balance of urban and rural residents | -0.049 (-3.06) | -0.048 (-3.05) | -0.047 (-3.07) |
| The whole club will invest in fixed assets | -0.045 (0.442) | -0.046 (0.443) | -0.044 (0.441) |
| Local budget internal income | 0.237 (0.013) | 0.236 (0.012) | 0.238 (0.014) |
| Expenditure within the general budget of local finances | 0.388 (0.007) | 0.387 (0.006) | 0.389 (0.008) |
| _cons | 0.174 (9.08) | 0.173 (9.07) | 0.175 (9.09) |
| R2 | 0.214 | 0.213 | 0.215 |
| F | 3.569 | 3.568 | 3.570 |