Quantitative model construction of colour application in modern ceramic art creation

Published Online: Feb 05, 2025
Received: Sep 05, 2024
Accepted: Dec 24, 2024
DOI: https://doi.org/10.2478/amns-2025-0053
Keywords
© 2025 Fawei Cheng, published by Sciendo
This work is licensed under the Creative Commons Attribution 4.0 International License.
With the rapid development of the economy brought about by high technology in modern society, people have undergone drastic changes from living habits to aesthetic orientation, from ideology to way of thinking. The fast-paced and efficient modern life and the strong sense of social competition have caused people to pursue a more novel and exciting outlook on life mentality [1]. Changes in lifestyle and social structure have led to the development of literature, art, and other humanities in a modernized form. People’s aesthetic requirements for art are also changing and renewing, and it has become the requirement of the times to modernize art creation, to break free from the shackles, and to develop, find, excavate, and explore a new world with new concepts [2-3]. Artistic creation should have the aesthetic characteristics of the times, form the style of the times, and show the elegance of the times, which requires art creators to use a new way of artistic thinking, new art form language to break through the old, programmed traditional concepts and rules and regulations. Modern ceramics is the product of modern society and modern civilization, closely related to the development of modern science and technology, the improvement of material life and modern people’s aesthetic interests and spiritual needs change. The modern ceramic artist carries personal thoughts, personal feelings, personal aesthetic materialization, visualization of the medium [4-6]. Therefore, in modern ceramic creation in the way of thinking and form language innovation, we must change the traditional ceramic concept of pottery and traditional ceramic aesthetic interest, and to solve such problems, modern ceramics from the material, modeling, decorative, technology and art concepts and other aspects of re-understanding and research [7-8].
Color is an important element and artistic language for artists to design and express their works, which can make the works more artistically infectious and shocking. The beauty of color language can be widely used in various fields nowadays, which actually reflects the maturity and benign development of its aesthetic taste [9-10]. Whether it is pottery, photography, sculpture, painting, design or other fields, there are many applications of high purity color language beauty. In wonderful nature, people are often attracted by the color of everything, and the color of many scenes exists in saturation, brightness and purity in a certain proportion, and the combination has a speechless and harmonious beauty, which is admirable [11-12]. Bright and eye-catching colors are used properly in modern ceramic art creation, making the creation of strong and hot emotional colors and exuberant vitality. Ceramic creators put their feelings into the creation, breaking the conventional traditional design concepts, design concepts and cultural concepts cleverly blended through the characteristics of the clay as well as the glaze color to express their ideas to the fullest. The color presented by the performance of different [13-16]. Constructing a quantitative model through numerical calculations can easily obtain the plane geometry or color parameters and characteristics of modern ceramic art creation. Reasonable and effective management and use of color resources can more effectively help ceramic creators to understand the color development trend, prediction and development of ceramics suitable for their characteristics and the target consumer groups of the color scheme, and play a role in guiding the development of new ceramic art products [17-20].
This research focuses on color matching and application in ceramic art creation, and proposes a color quantization algorithm based on visual characteristics and a color matching measurement algorithm, respectively. In the color quantization algorithm, human visual characteristics are used to measure the similarity between colors dynamically by combining color frequency and color difference so that colors are quantized in each logical region of the combination of color frequency and color difference. A clustered feature tree is used to implement the split-merge algorithm efficiently for the quantification of ceramic colors. We propose a similarity measurement model for evaluating pairwise color matching schemes, construct a visual perception measurement method based on eye tracking technology, and propose to construct an intelligent color matching model integrating visual aesthetics based on the theoretical foundation of image translation model combined with visual aesthetics data flow. The effectiveness and performance of this paper’s color quantification algorithm and color matching measurement algorithm are verified, respectively, and a series of ceramic works, “Days on the Clouds” are designed by using them, which are compared and analyzed with A ceramic works that are not designed by applying this paper’s method in terms of eye-movement behavioral indexes, color matching preferences, and visual aesthetics evaluation.
With the rapid development of industrial technology, the ceramic production industry has also emerged. The development of the traditional ceramic industry is relatively slow. In order to cope with the rapid iteration of the ceramic market products, how to quantify the application of ceramic art in the application of colour, ceramic colour to achieve efficient collocation and design has become a topic of great concern in the industry. In this regard, this study proposes a quantitative algorithm for ceramic colour based on visual characteristics, and further proposes a method for measuring and evaluating the fusion of ceramic colour matching on the basis of quantitative ceramic colour data.
The similarity between colors in a color quantification algorithm based on visual properties includes color frequency and color difference. Colour frequency can be obtained by scanning the whole image, while chromatic aberration is the distance between two colours, which will be defined differently in different colour models. Various colour models have been proposed, the RGB colour model is the most widely used one in practice, and the position of each colour in this colour model can be determined by the 3D spatial coordinates
Intuitively, the smaller the number of paradigms, the shorter the distance between two colours in the colour space, the closer the two colours are. However, since the RGB colour space is not a uniform linear space, the colour classification obtained according to the shortest distance between colours does not fully comply with the classification of colours by human vision. The International Commission on Illumination (CIE) in 1976 defined three uniform colour space
When
Where
Theoretically, it is possible to convert the RGB colour space to a uniform colour space, then perform colour quantisation in the uniform colour space, and then convert the quantisation results to the RGB colour space to generate a quantised image, but a more practical solution would be to adjust the RGB colour space to partially compensate for its non-uniformity. For example, a distance formula using a weighting factor in RGB colour space:
Where
In this paper, we will mainly discuss the quantization algorithms from 24-bit true colour images to
The following definitions are made using equation (1).
Definition 1, defines function
Definition 2, define function
Definition 3, define function
Definition 4, defines the function
A similarity that incorporates frequency and colour information is more representative of the relationship between colour samples. The product of
After finding out the original clustering centre based on the image, the remaining colour samples are clustered according to the rule of maximum similarity with the clustering centre, and at the same time, the most appropriate clustering centre is also dynamically selected.
Definition 1, the clustering centre (representative or palette colour) of each clustering domain draws on the law of centre (centre of mass) calculation in mechanics with the expression:
Definition 2, The colour vectors in Eq.
Before introducing the data structure, the concepts of cluster features and cluster feature tree are briefly introduced [23].
A cluster feature
A clustered feature tree CF-Tree is a multinomial balanced tree similar to a
The non-leaf nodes of the clustered feature tree have
Minimum colour difference model and palette similarity measurement In order to scientifically and effectively describe the similarity between palettes made of multiple colour combinations, the traditional method of calculating the colour difference of palettes is improved, and a minimum colour difference model combining positional information is proposed. The method is to avoid the difference in calculation results due to the difference in position information by introducing the strategy of intermediate palettes for pairs of palettes, and the specific calculation methods are as follows. Step 1, Assuming that the number of primary colours in the source palette and the target palette are both Step 2, use all the colours in the target palette Step 3, a cyclic operation is carried out for the processing of step 1 and step 2, respectively, using all the colours of Step 4, calculate the average colour difference value between
where
Δ
Step 5, the
Step 6, the average colour difference between
Step 7, the calculation method proposed in this section applicable to evaluating the similarity of the colour palette is defined as follows:
The calculated colour difference results are normalised and the normalisation method and similarity calculation for paired palettes are defined below:
In the formula.
Similarity measure model based on feature fusion Since the above palette similarity measure and image content based structural similarity measure represent the main colour information and image content information respectively, which have relatively ideal independence, the feature level fusion is performed on them using variable weights to get the result based on similarity calculation, and the method of feature fusion is defined in the following equation:
Where.
Visual perception measure based on eye-tracking technology [24] The eye movement behaviour metrics of each sample were normalized, and the computational steps of the normalisation process are specified in equation (17). Subsequently, the three indicators were weighted and fused, and it is worth noting that, since the first gaze time shows a negative correlation with attractiveness in user interaction and evaluation tasks (the smaller the first gaze time, the higher the attractiveness), the normalised theoretical maximum is used to subtract the normalised first gaze time, and the weighting formula is shown in equation (20):
Where.
Step 5, calculate the ratio of the visual perception data of the recoloured image to its corresponding source image, which is the visual perception measure, and the formula is shown in equation (21):
Where.
Visual Aesthetics In the process of quantifying visual aesthetics using eye-movement behavioural measures, the three most important eye-movement behavioural metrics are average gaze time, average number of gaze points, and first gaze time, which reflect the visual comfort, visual attractiveness, and visual impact of the test image or video, respectively. Taking the average gaze time as an example, its calculation formula in the eye tracking experiment is shown in equation (22).
Where,
Constructing visual aesthetics data flow using eye movement behaviour indicators, normalised pre-processing is performed on the above three eye movement behaviour indicators, in which the average gaze time and the average number of gaze points are positively correlated with the degree of visual aesthetics liking, taking the average gaze time as an example, and the processing method is defined as follows:
Where,
The first gaze time measure is negatively correlated with the degree of visual aesthetics favouritism in the interaction task, and its processing is defined as follows:
Where,
Visual aesthetic parameter
In Eq,
Where the three weights are set differently depending on the visual task, this chapter uses Image translation model The image translation model is a conditional generative adversarial network as a generator and a discriminator, whose generator input is a real sample image In addition, the Pix2Pix network model introduces
Where,
Where
where,
The loss function of Pix2Pix is shown in equation (28):
Intelligent colour matching model incorporating visual aesthetics The loss function of the backbone network Pix2Pix is updated using the aesthetic scores of the colour palette, and the aesthetic loss function
In Eqs.
This chapter will focus on validating the effectiveness and performance of the ceramic color quantification algorithm and the ceramic color matching measurement algorithm proposed above.
In this section, the peak signal-to-noise ratio PSNR and the structural similarity index SSIM are introduced as evaluation indexes for the similarity between the reconstructed image and the original image in terms of image quantification effect, i.e., the difference between the original ceramic image and the quantified ceramic image, and the k-means, DBSCAN, and Median Cut algorithms are selected for the comparison, to validate that the ceramic colour quantification algorithm based on the visual characteristics proposed in this paper has the Performance. Six ceramic images are randomly selected from the database, named Photo1~6, and quantitatively reconstructed by applying the algorithms, including the ceramic colour quantization algorithm in this paper, and the similarity between the reconstructed image and the original image is calculated from the perspectives of PSNR and SSIM, and the values are recorded so as to compare with the results of the reconstruction of other algorithms. The PSNR and SSIM values of each algorithm are shown in Fig. 1. The larger the PSNR value is, the smaller the image distortion is, and it is obvious that the PSNR values of this method are larger than those of other algorithms in the colour quantitative reconstruction of six ceramic images, with the PSNR values of 28.51, 27.17, 25.72, 30.29, 28.25, and 26.49 respectively, the closer the SSIM value is to 1, the better the quality of the image is. The better the image quality. Except in Photo2, the SSIM value of this paper’s ceramic colour quantization algorithm is 0.81, which is slightly lower than that of the k-means algorithm and Median Cut algorithm (0.91, 0.89), and the SSIM value of this paper’s method is higher than that of the other comparative algorithms in other ceramic images. The average SSIM value of this paper’s ceramic colour quantification algorithm in six ceramic images is about 0.812, which is the highest among all the algorithms, and the average SSIM values of k-means, DBSCAN, and Median Cut algorithms are 0.8, 0.685, and 0.597, respectively. Overall, the proposed algorithm for quantifying ceramic color based on visual characteristics of ceramic images has a better impact on quantification, and structurally, it is superior to other comparative algorithms. Quantification is better, with higher structural similarity and colors closer to those of the ceramics itself.
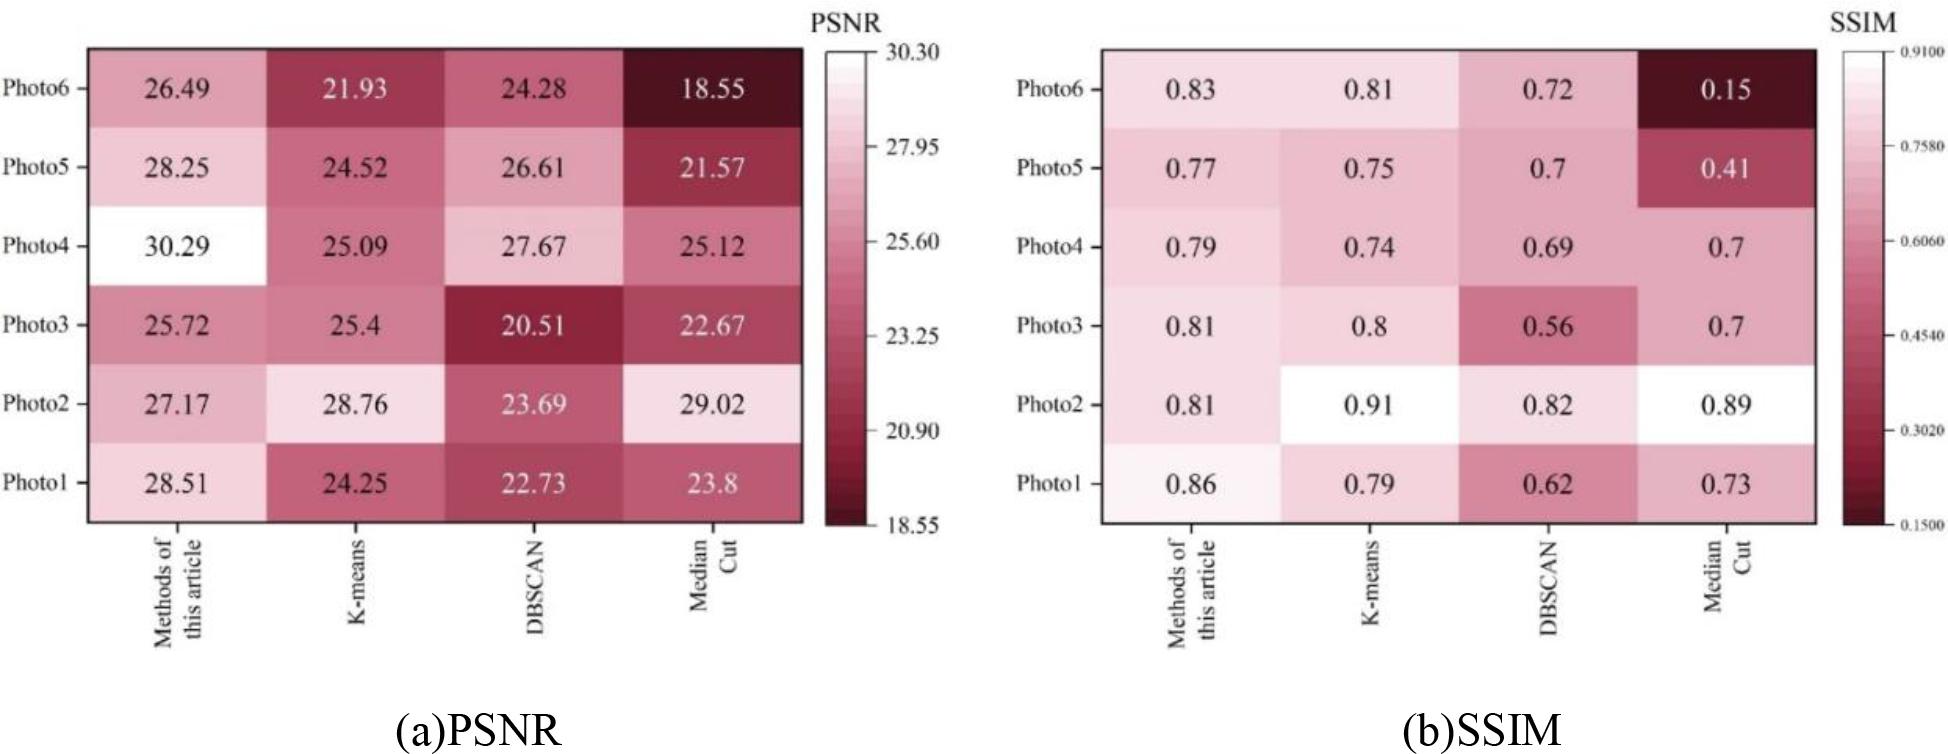
PSNR and SSIM
Randomly select 20 ceramic images in the database, also named in the form of Photo1-20, and apply the ceramic color matching measurement algorithm proposed in this paper to perform color matching evaluation on each ceramic. The ceramic colour matching evaluation score of this paper’s algorithm is compared with the expert score, and the comparison results are shown in Figure 2. According to the figure, the trend of the application of this paper’s algorithm obtained by the ceramic color matching score and expert scoring results is approximately the same. In addition, the difference between the score of this paper’s algorithm and the expert’s score is up to 0.94, which is less than 1, and the difference between the two is small. This can demonstrate that the proposed ceramic color matching evaluation method proposed in this paper is effective.
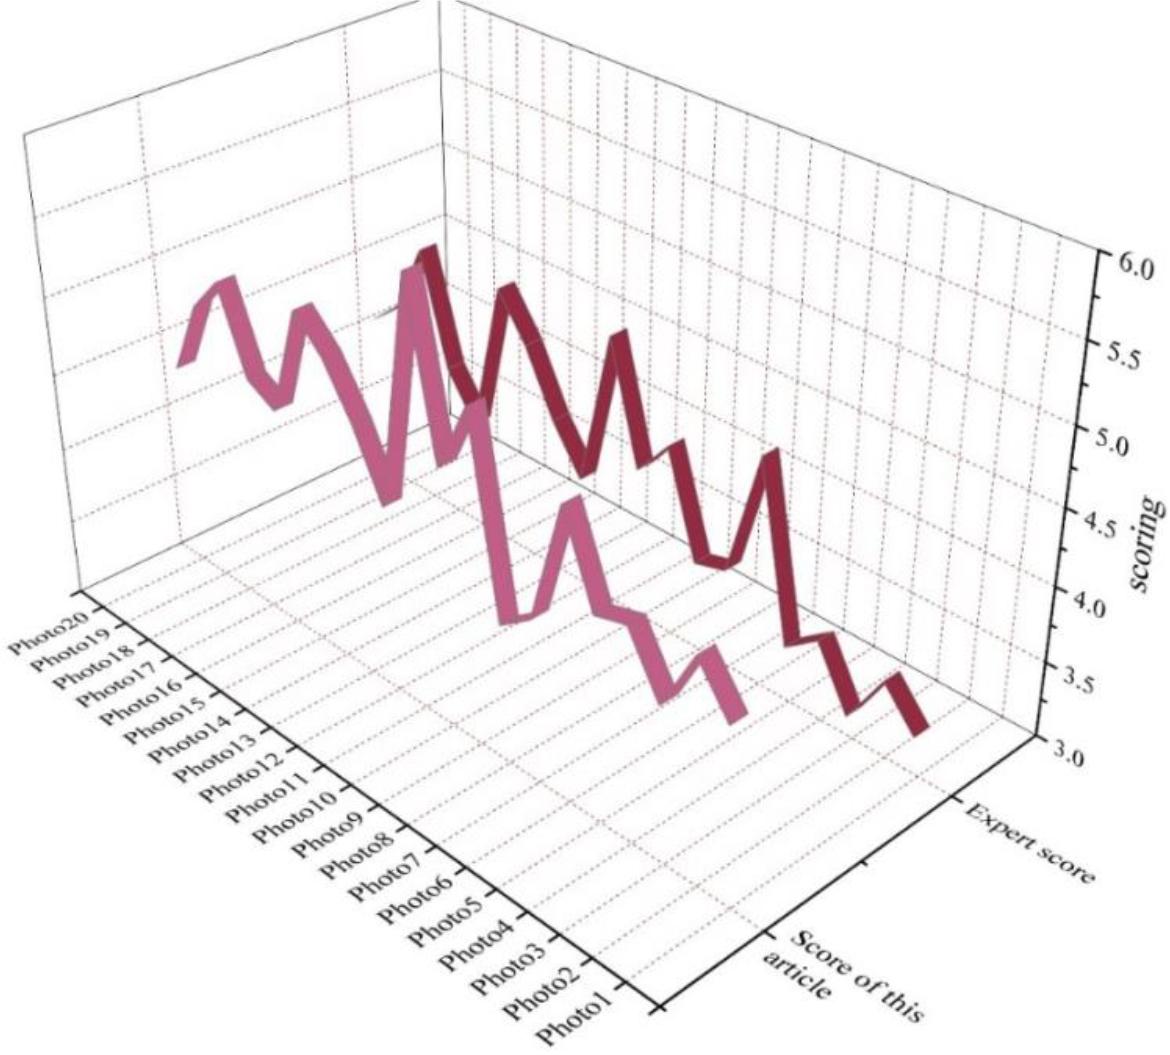
Color collocation evaluation
In the previous paper, this paper proposes a ceramic color quantification algorithm based on visual characteristics to realize color quantification in ceramic art creation and proposes a measurement and evaluation method for the color matching used in ceramic design. This study will apply the ceramic color quantification and matching evaluation method proposed in this paper to the actual art creation and design of ceramics and design a series of ceramic works, “Days on the Clouds”. The whole set of works is a 5-piece set of desktop storage ceramic designs consisting of a flower vessel, a storage jar, a pen holder and two storage trays.
In this paper, we screened subjects who met the requirements through interviews and invited them to participate in the evaluation and scoring of the series of ceramic works “Days on the Clouds” designed in this research and the series of ceramic works A (referred to as “work A”) that were not designed with the methodology of this paper. The age of the subjects was between 20 and 30 years old, and the number of subjects was 20, which included both practitioners and students in the field of design, as well as subjects who were not practicing or studying in the field of design.
This section utilizes the eye movement experimental method by tracking the eye trajectories and data of the subjects to the ceramic stimuli of the “Days on the Clouds” series designed in this paper as a reflection of the psychological preference of the subjects against the ceramic works. The eye movement behavior data were accomplished with the help of the TobiiGlasses 2 head-mounted eye-tracking device, which can collect eye movement data with high precision and is very light in weight, so it will not cause interference to the subjects. The specific meanings represented by different eye movement data are shown in Table 1. The longer the duration of gaze and the first time of gaze, and the more gaze points there are, the higher the interest level of the subjects.
Eye movement data index
| Number | Eye movement indicator | Meaning |
|---|---|---|
| 1 | Total fixation time | The total time of the fixed point of the interest area |
| 2 | First fixation duration | The duration of the first gaze point in the interest area |
| 3 | Number of fixation points | The amount of attention collected in the interest area |
The eye movement behavior index data of the subjects for the series of ceramic works designed in this paper, “Days on the Clouds,” and A works are shown in Table 2. As can be seen from the table, for the series of ceramic works “Days on the Clouds”, the average gaze duration and the average first gaze duration of the subjects reached 1686.101ms and 399.217ms, respectively, which were higher than those of the works of 906.385ms and 143.0875ms for the works of A. In terms of the number of gaze points, the average number of gaze points of the subjects in the series of ceramic works “Days on the Clouds” was 4.3575, compared with 3.67373 for the works of A. In terms of the number of attention points, the average number of attention points of the subjects in the series of ceramic works “Days on the Clouds” in this paper is 4.3575, while the number of attention points in the work of A is 3.6735, and the former is higher than the latter by 0.753. Obviously, the series of ceramic works designed in this paper, “Days on the Clouds”, is more capable of stimulating the interest of subjects.
Data of eye action indicators
| Number | Work of this article | Work A | ||||
|---|---|---|---|---|---|---|
| Total fixation time (ms) | Number of fixation points | First fixation duration (ms) | Total fixation time (ms) | Number of fixation points | First fixation duration (ms) | |
| 1 | 1788.71 | 4.78 | 779.25 | 995.58 | 4.81 | 186.05 |
| 2 | 2266.18 | 4.55 | 647.69 | 765.44 | 4.66 | 246.82 |
| 3 | 150.75 | 1.73 | 149.67 | 615.24 | 2.17 | 284.13 |
| 4 | 1254.66 | 4.79 | 164.99 | 843.65 | 3.58 | 237.1 |
| 5 | 1397.32 | 6.02 | 395.21 | 708.04 | 4.09 | 264.03 |
| 6 | 1932.81 | 6.58 | 213.89 | 760.58 | 3.79 | 211.98 |
| 7 | 1348.41 | 3.19 | 299.82 | 624.77 | 2.79 | 378.94 |
| 8 | 1912.02 | 8.87 | 231.9 | 931.75 | 3.66 | 204.35 |
| 9 | 1246.89 | 3.09 | 292.69 | 860.48 | 3.98 | 210.64 |
| 10 | 1374.74 | 1.93 | 559.66 | 777.26 | 2.82 | 228.22 |
| 11 | 2851.48 | 7.14 | 528.77 | 772.77 | 3.69 | 180.02 |
| 12 | 1203.3 | 3.11 | 305.49 | 795.14 | 4.8 | 225.46 |
| 13 | 1270.85 | 2.25 | 405.02 | 853.43 | 3.93 | 207.99 |
| 14 | 3187.83 | 5.33 | 265.54 | 672.88 | 3.88 | 382.72 |
| 15 | 1152.53 | 2.87 | 234.37 | 794.26 | 2.18 | 338.91 |
| 16 | 3264.77 | 3.89 | 230.06 | 697.76 | 3.14 | 277.19 |
| 17 | 1621.44 | 4.31 | 545.37 | 535.19 | 3.14 | 385.27 |
| 18 | 1426.26 | 2.84 | 439.47 | 955.23 | 4.6 | 175.44 |
| 19 | 1428.46 | 4.93 | 602.44 | 784.85 | 4.08 | 246.21 |
| 20 | 1642.61 | 4.95 | 695.73 | 854.78 | 3.68 | 250.36 |
| Average | 1686.101 | 4.3575 | 399.3515 | 779.954 | 3.6735 | 256.0915 |
After the subjects finished the eye movement experiment, the subjects were invited to score the color matching preferences of the series of ceramic works designed in this paper, “Days on the Clouds”, and the works of A as a comparison, and the preference scoring was based on a 10-point full-point system. The subjects’ color matching preference scoring is shown in Figure 3. As can be seen from the figure, No. 3, No. 12, and No. 17 subjects for the A works of color matching preference scores were higher than the ceramic works of this paper 1.07, 0.02, 0.45, in addition to the rest of the subjects for the ceramic works of this paper’s color matching preference scores are significantly higher than the A works. The series of ceramic works designed in this paper, “Days on the Clouds,” obtained an average color matching preference degree of 7.17, while the A works only 5.33. The former is higher than the latter at 1.84. On the whole, the series of ceramic works designed in this paper, “Days on the Clouds,” in the ceramics of the color matching to obtain more recognition, but also to obtain more flavor.
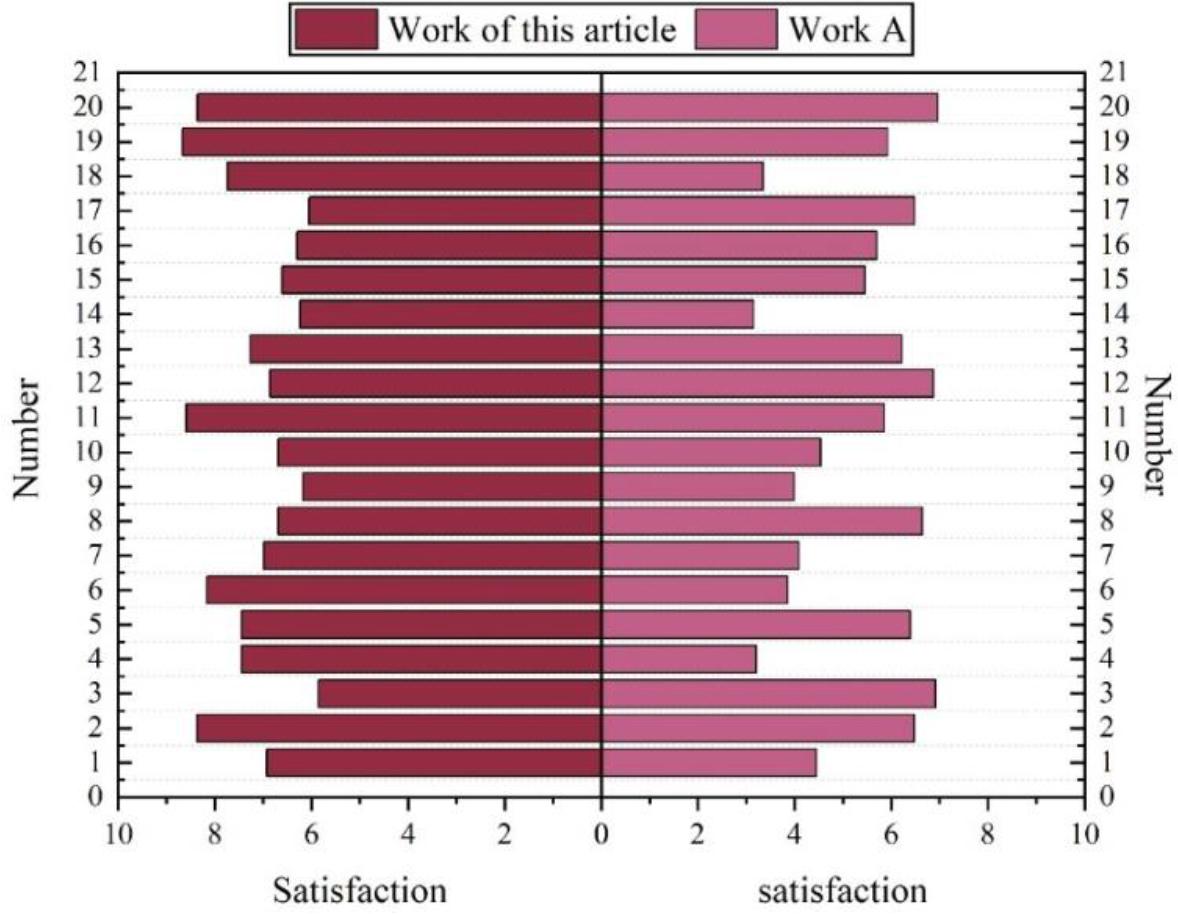
Color matching preferences
In the previous section, a comparative analysis was conducted to assess the color matching aspect of each ceramic work. In this section, the overall visual aesthetics of the series of ceramic works designed in this paper, “Days on the Clouds” and the work of A as a comparison will be evaluated from an overall perspective, combined with the eye movement behavior data of the subjects analyzed above, and the visual aesthetics scoring also adopts a 10-point full-point system. The visual aesthetic scores of the ceramic works in this paper and the A works are shown in Figure 4. It can be seen that in the visual aesthetic scores of all 20 subjects, the scores of the ceramic works in this paper are basically higher than those of the A works. Only in the 18th and 19th respondents, there is a situation where the visual aesthetic ratings of the A works are 6.98 and 6.12 respectively, which are higher than the ratings of the ceramic works in this paper of 6.02 and 5.06. The highest visual aesthetics rating of ceramic works in this paper is 9.1, and the lowest score is 4.9. In contrast, the highest visual aesthetics rating of works A is no more than 7, and the lowest score is 1.38. In terms of visual aesthetics average, the average visual aesthetics rating of ceramic works in this paper is 6.8815, while works A is only 4.7835, which is lower than the ceramic works in this paper by 2.0962.
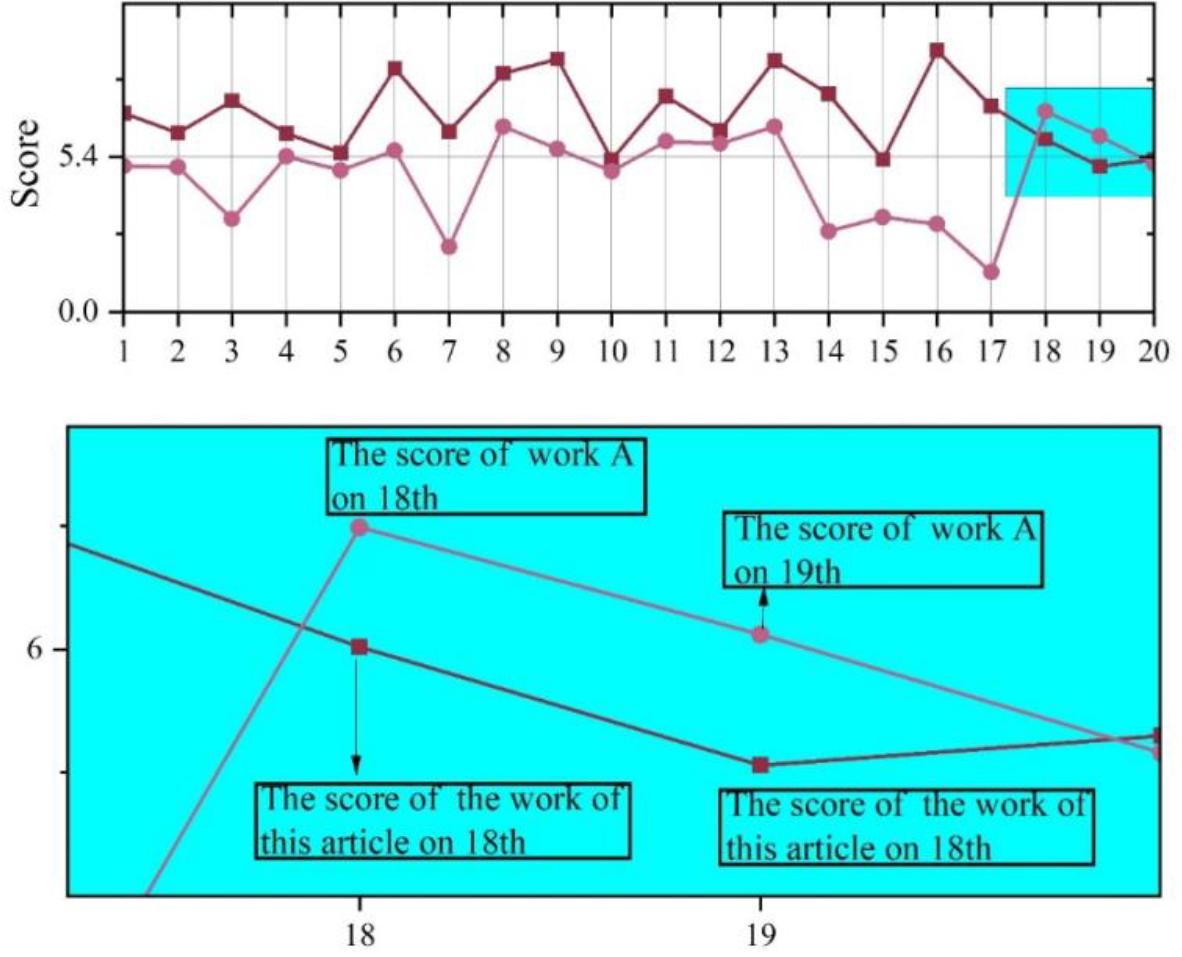
Visual score
Overall, the series of ceramic works designed by applying the ceramic color quantification and matching evaluation method proposed in this paper, “Days on the Clouds”, outperforms the A works that do not use this paper’s method, both in terms of eye-movement behavioral indexes, as well as in terms of color matching preferences and visual aesthetics scores. The application of the ceramic color quantification and matching evaluation method proposed in this paper will provide useful assistance to the artistic creation of ceramics and the application of color.
This paper proposes a color quantification algorithm and a color matching measurement algorithm based on visual characteristics in order to achieve efficient application of color in ceramic art creation. This paper uses the color quantification algorithm and the color matching measurement algorithm, respectively, to confirm the effectiveness of the experiments. The k-means, DBSCAN, and Median Cut algorithms are selected for comparison, and the PSNR values of the color quantization algorithm in this paper are larger than those of the other algorithms in the color quantization reconstruction of six ceramic images. In SSIM value, except Photo2, the SSIM value of this paper’s color matching algorithm is higher than that of other comparative algorithms, and the average SSIM value reaches 0.812. The trend of this paper’s color matching algorithm is basically the same as that of the expert’s scoring results, with the highest difference value of 0.94<1, and the scoring method has validity.
Combining the color quantization algorithm and color matching measurement algorithm of this paper for ceramic art creation, a series of ceramic works, “Days on the Clouds,” is designed, and a series of ceramic works A, which is not designed by applying the method of this paper, is taken as a comparison to carry out practical analysis. In the eye movement behavior index data, the average gaze duration and average first gaze duration of ceramic works in this paper are 906.385 ms and 143.0875 ms higher than that of work A, respectively, and the average number of gaze points is 0.753 higher than that of work A. For the effect of color matching, the average color matching preference of ceramic works in this paper is 7.17, which is higher than that of A works 1.84 and is more favored by the subjects. In terms of the overall visual aesthetics of ceramic works, the average visual aesthetics of work A is 4.7835, and the ceramic works in this paper are higher than its 2.0962. The series of ceramic works, “Days on the Clouds,” created by the ceramic color quantification and collocation evaluation method proposed in this paper has shown obvious advantages in both color collocation and visual aesthetics.