Research on safety detection method of mining coal mining machinery transmission mechanism based on optical sensor

Data publikacji: 17 mar 2025
Otrzymano: 11 paź 2024
Przyjęty: 08 lut 2025
DOI: https://doi.org/10.2478/amns-2025-0205
Słowa kluczowe
© 2025 Zhengbo Wang et al., published by Sciendo
This work is licensed under the Creative Commons Attribution 4.0 International License.
In recent years, the level of modern technology used in the process of coal mining resources mining is constantly improving, and coal mining has become more and more mechanized and modernized. Coal mining machinery and equipment are mainly used for coal mining and transportation, and the stability and reliability of its transmission process directly determines the efficiency of the integrated mining operation and the economy of integrated mining in underground coal mines [1-3]. In order to improve the efficiency of coal mining, the investment of enterprises in the machinery and equipment required for coal mining has been further increased, mainly in the research and development of coal mining equipment as well as construction investment. In this process, the modernization and mechanization of coal mining also put forward higher requirements for the excellence of coal mining equipment, and the mechanical transmission mechanism of coal mining equipment is particularly prone to failure in the process of equipment use, which makes the mining efficiency of coal resources decline [4-5]. This is due to the coal mining machinery and equipment placed in the harsh operating environment for a long time, the process of high-intensity coal mining will bring wear and tear on the coal mining machinery, serious wear and tear will lead to transmission failure, the original performance of the transmission mechanism can not be played [6-9]. And with the accumulation of time and the increasing contact stress between the transmission mechanism, the fatigue cracks produced by the transmission mechanism will be extended, and ultimately there will be material spalling and some pits, i.e., pitting phenomenon [10-13]. In addition, the failure causes of mechanical transmission of coal mining equipment include gluing, deformation and fracture, etc [14-16]. Therefore, the safety detection method based on optical sensors can be applied to reduce the occurrence of transmission failure phenomenon, to further improve the transmission mechanism and the use of coal mining machinery and equipment efficiency, to improve the efficiency of coal mining and the start-up rate of the equipment [17-19].
In this paper, through the coal mining machinery, deceleration transmission mechanism description, the temperature, vibration, current, voltage of the transmission mechanism as a safety testing parameters, the use of LabVIEW2016 software, light sensor device, conditioning circuit device, data acquisition card device and computer device, together to build the coal mining machine transmission mechanism safety testing and troubleshooting diagnostic system, the transmission mechanism safety testing module mainly consists of light sensors , while the fault diagnosis diagnosis module consists of improved neural network (principal element analysis method-neural network). By accessing the command terminal to enter the Python environment, successfully start TensorFlow, complete the construction of the software platform, set the return error, sensitivity, nonlinearity, accuracy as the static performance indicators, and finally validate and analyze the coal mining machine transmission mechanism safety detection and fault diagnosis system.
Artificial neural network is developed on the basis of modern neurological research results, it is a kind of network neural imitating the information processing mechanism of the human brain, it consists of a large number of simple artificial neurons widely connected, reflecting some of the features of the function of the human brain, it can complete the functions of learning, memory, recognition and reasoning, it has strong fault tolerance, generalization and nonlinear processing ability [20-22].
Artificial neural network is the abstraction, simplification and simulation of the human brain, the information processing function of the network is realized by the interaction between neurons, the storage of knowledge and information is manifested in the distributed physical connection between the network components, and the learning and identification of the network is determined by the dynamic evolution of various neuron pieces connected to the coefficient of weight.
An artificial neural network is equivalent to a nonlinear threshold device with multiple inputs and single output.
The tansig hyperbolic tangent type
Unified neural network training is done using BP algorithm i.e. error back propagation algorithm.The derivation process of BP algorithm is as follows:
Input layer: the output value
Hidden layer: for the
The output values are
Output layer: since the action function of the output layer unit is linear, the output value is a weighted sum of the input values, and for the
First define the error function
The BP learning algorithm uses gradient descent to adjust the weights by the amount of each adjustment:
For the weights between the hidden layer and the input layer
Among them:
Multilayer perceptron network using BP algorithm is one of the most widely used artificial neural networks, which has very important applications in various subject areas. However, because the BP network adopts the gradient descent search and solution algorithm, which inevitably appears in the network learning convergence speed is slow, as well as easy to fall into the local minima and other problems; in addition, in the implementation process, the learning rate and the momentum term of the two parameters can only be selected by experiment and experience to determine, once improperly selected, it will cause the network oscillations, and even lead to the network into the saturation state and does not converge. For this reason, a variety of improvement methods have been proposed, which improve the learning rate to varying degrees, accelerate the convergence of the network, and avoid falling into local minima. Using the parallel computing capability of neural networks, through some self-learning method, useful features can be automatically extracted in the case of unknown statistical characteristics of the input fault signal, and the combination of the two can also improve the sensitivity of the input data to the features, and ultimately achieve the purpose of making the network simplified and the training time shortened. It can also be realized by applying the principal element analysis method to linearly combine the network inputs and reduce the dimensionality of the input vectors.
Maximum feature vector extraction network structure based on
The maximum feature vector in the input failure mode sample can be extracted as:
Since similar inputs are likely to belong to the same class, the higher the variance of an input variable, the more likely it is to have good discriminatory power. Principal element analysis utilizes this law to perform a linear combination of the inputs so that the output covariates obtained have a larger variance and a better ability to discriminate between patterns.
Let
Then the mean value of the linear combination series
From this we get:
Then the variance of series
Let
From the above equations we conclude that finding the maximum value of the variance of the series
The derivation of this equation yields:
Substituting the above equation into the formula for finding the variance of series
From this we can see that the input dataset
Since the principal element direction is just a straight line in
In order to reduce the dimensionality of the network inputs while making the retained covariates highly sensitive to modes, the coordinates in
Double-drum coal mining machine is mainly composed of traction section, cutting section, electric control box and so on. The traction section is responsible for the traveling of the machine. The cutting department is responsible for cutting the coal wall and loading the falling coal onto the scraper, the electric control box is responsible for controlling the motor start and stop, the rocker arm lifting and lowering and other action control, as well as all kinds of protection operation, in addition to other auxiliary devices such as spraying device, tilting device and other auxiliary devices in the coal mining machine. The main drive mechanism of the coal mining machine includes the cutting and hauling department. The cutting section is responsible for cutting and loading coal, its mechanical structure includes drum and cut-off teeth, the transmission mechanism includes reducer and rocker gear box, etc. Its working nature determines that the transmission power of the cutting section is large and easy to be subjected to large impact loads. The haulage section is responsible for the traveling of the coal mining machine, and its mechanical structure mainly includes inner haulage and outer haulage, etc. After the motor is started, the power will be transmitted to the traveling gears through the reducer to drive the coal mining machine to travel.
Figure 1 is a short wall double drum coal miner traction department transmission sketch, using three-stage fixed shaft spur gear and two-stage NGW-type planetary tandem reduction mechanism, transmission ratio, compact structure, to reduce the volume of the traction transmission mechanism to create the conditions.
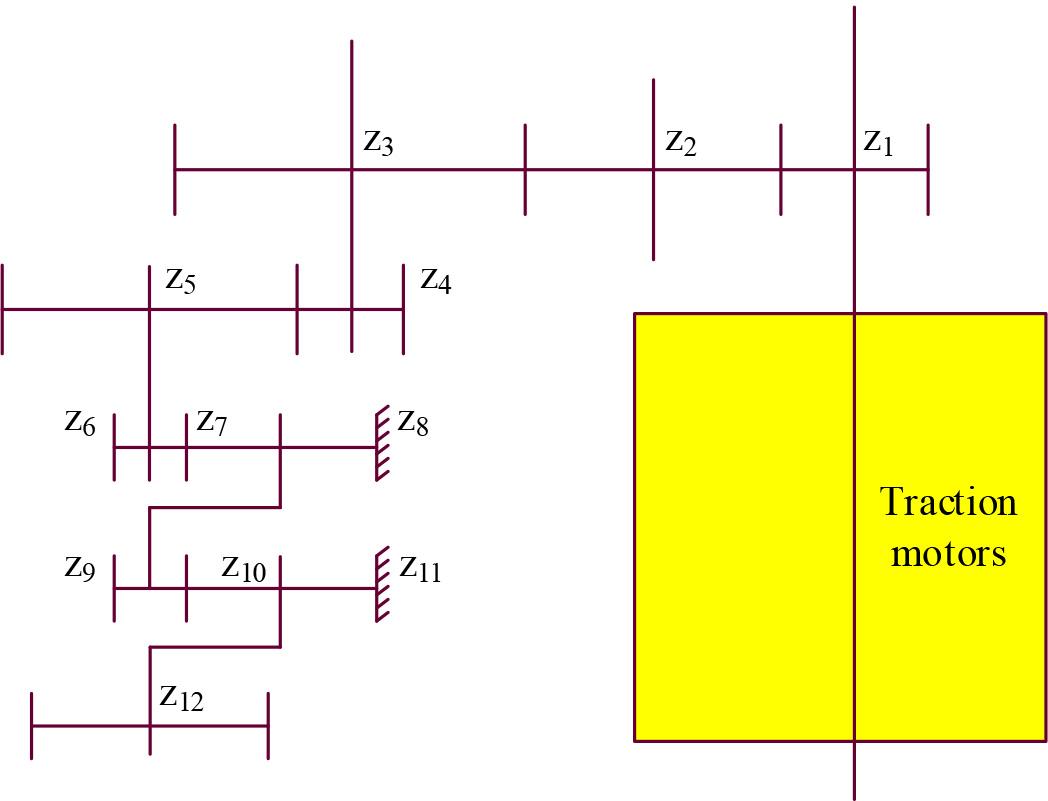
Short wall double drum shearer traction section transmission schematic
In order to make the power in the various planetary wheels between the uniform shunt, this paper adopts the basic components floating in the sun wheel floating load equalization mechanism, the two-stage planetary frame are not supported, the planetary wheel using spherical bearings, the sun wheel with a single tooth sleeve coupling, in order to realize the planetary frame and the sun wheel at the same time floating equalization of loads in the force imbalance can be automatically adjusted or additional elasticity deformation to compensate for the error, so as to achieve the equalization of force to achieve a uniform shunt of power, and the whole mechanism to meet the space static transmission conditions, and the entire mechanism to meet the space static transmission conditions. Moreover, the whole organization meets the space static fixation. The traction motor is an explosion-proof electromagnetic speed-regulating motor composed of three-phase asynchronous motor, eddy current clutch and speed generator, which is capable of smooth stepless speed regulation within a wide range of speed.
In the working process of coal mining machine, its working condition can be detected by several working parameters. The first is vibration, in the work of the power transmission device depends on the operation of the gear, can not avoid vibration, and vibration is abnormal will affect the operating state. Second is the temperature, the temperature of the reaction to the operating state is normal; again is the voltage and current, can directly reflect the work of the power loss, whether there is an abnormal voltage and current; finally is the rotational speed, also according to the working condition to determine whether the speed is too fast caused by abnormal. Due to the poor working environment of coal mine, and in the process of coal mining, very often encounter some irregular coal seams, there are differences in hardness and material, easy to make coal mining machine failure. The transmission device of the coal mining machine belongs to the device that is more prone to failure, once the transmission device fails, it not only affects the working efficiency and causes economic loss, but also may threaten personal safety.
In the production of coal mine, the environment is relatively poor, there are a lot of pollutants, such as dust, coal debris, etc., and there are some rock blocks, etc., the coal mining machine will be affected by these pollutants during the work process, there is an impact on the wear and tear of the device is relatively high, it is easy to cause failures, and most of the failures of the coal mining machine are due to the gears of the transmission device or the bearings have failed. Gear in the transmission device, the operating speed is relatively low, but at the same time it is relatively large load, so it is easy to occur problems, mainly including the following aspects:
1) The tooth surface has a large wear: in the process of coal mining work, will encounter a variety of coal rock blocks, and some of these coal rock blocks need a relatively large force to fall off, which makes the gear load is relatively high, at the same time, the gear operates through the rotation, there are small particles exist between the gear gap, which will cause friction, and further aggravate the wear. On the other hand, in the long working process, there will be some acidic or alkaline components contact gear, due to prolonged contact will also cause part of the chemical corrosion, combined with each other will cause increased wear. 2) tooth surface contact caused by fatigue loss: gears in the process of operation, is through mutual meshing to transfer power, and in the process, gear operation will lead to a certain amount of sliding, this sliding will cause friction, in the continuous operation process, the gear by the friction of the role of the friction is easy to crack, after a long period of time after the work, the cracks expand, resulting in damage. 3) damage caused by friction: when the gears need to increase the speed of the working process, because the pressure will increase, the work of the friction caused by the temperature rises, this time the need for lubrication, if there is no lubrication, then the gears between each other's oil film is likely to be destroyed, resulting in mutual contact with the gears, it is very likely to cause greater friction damage. 4) uneven force caused by gear fracture: due to the gear in the operation process will be subjected to force, and the most serious part of the gear force in the root of the gear, in the prolonged operation, constantly subjected to force and load impact, when more than the fatigue limit of the gear, cracks will be produced, further reducing the degree of gear withstand in the continuous process will lead to the damage to further expand, and finally Gear fracture will occur under the action of large loads.
The neural network realizes automatic knowledge acquisition through instance learning, and when knowledge acquisition is carried out, the coal mining transmission mechanism safety inspection system is required to provide learning instances and their corresponding expected fault diagnosis results, and the weight distribution of the network is constantly corrected by the network adaptive learning algorithm. When the network is stabilized, the knowledge and experience of fault diagnosis of the problem are distributed to the interconnection structure and weight distribution of the network, so as to obtain the knowledge base needed for reasoning. On the one hand, the problem solving ability of the system can be improved by the introduction of neural networks, and on the other hand, the system can help the neural network to determine the optimal network structure and training data, etc. Therefore, the combination of neural network and coal mining transmission mechanism safety detection system is feasible. The specific design framework of the neural network-based transmission mechanism safety detection and fault diagnosis system is as follows:
The coal mining machine transmission device fault diagnosis system software system can realize the processing and analysis of various signals, and at the same time can carry out fault diagnosis and analysis for the coal mining machine transmission device. Software system development is the use of LabVIEW2016 software for the entire system development platform, the development of different functional modules and assembly. The use of LabVIEW2016 software not only ensures that some software modules have some hardware functions, but also ensures that the entire design work is more convenient and efficient, without the need to write complex and cumbersome code work, so that the entire software system development cycle is further shortened to ensure that ordinary technicians can complete the system development work. In order to further strengthen the development of the software system has a stronger expansion function, to facilitate the daily maintenance of the system, through the modular programming concept for the system design, Figure 2 for the system function module structure design schematic diagram. In the main interface of the system, the main menu mode is used for design, which contains a number of contents such as parameter setting, coal mining machine detection project, coal mining machine fault diagnosis and specific operation, etc. In the setting function module, it can be set for the parameters of the installed sensing device, and at the same time, it can also be set for the final storage of the production reports and specific paths. In the detection project function module, the vibration, temperature, current, voltage and rotational speed of the drive mechanism of the coal mining machine can be detected in real time. The fault diagnosis function module can diagnose the faults of gear parts, bearing parts and other related parts of the transmission device, and it mainly adopts the principal element analysis-neural network model to realize the fault diagnosis function. The report function module can realize real-time report generation, browsing and setting. The operation function module realizes program shutdown operation.
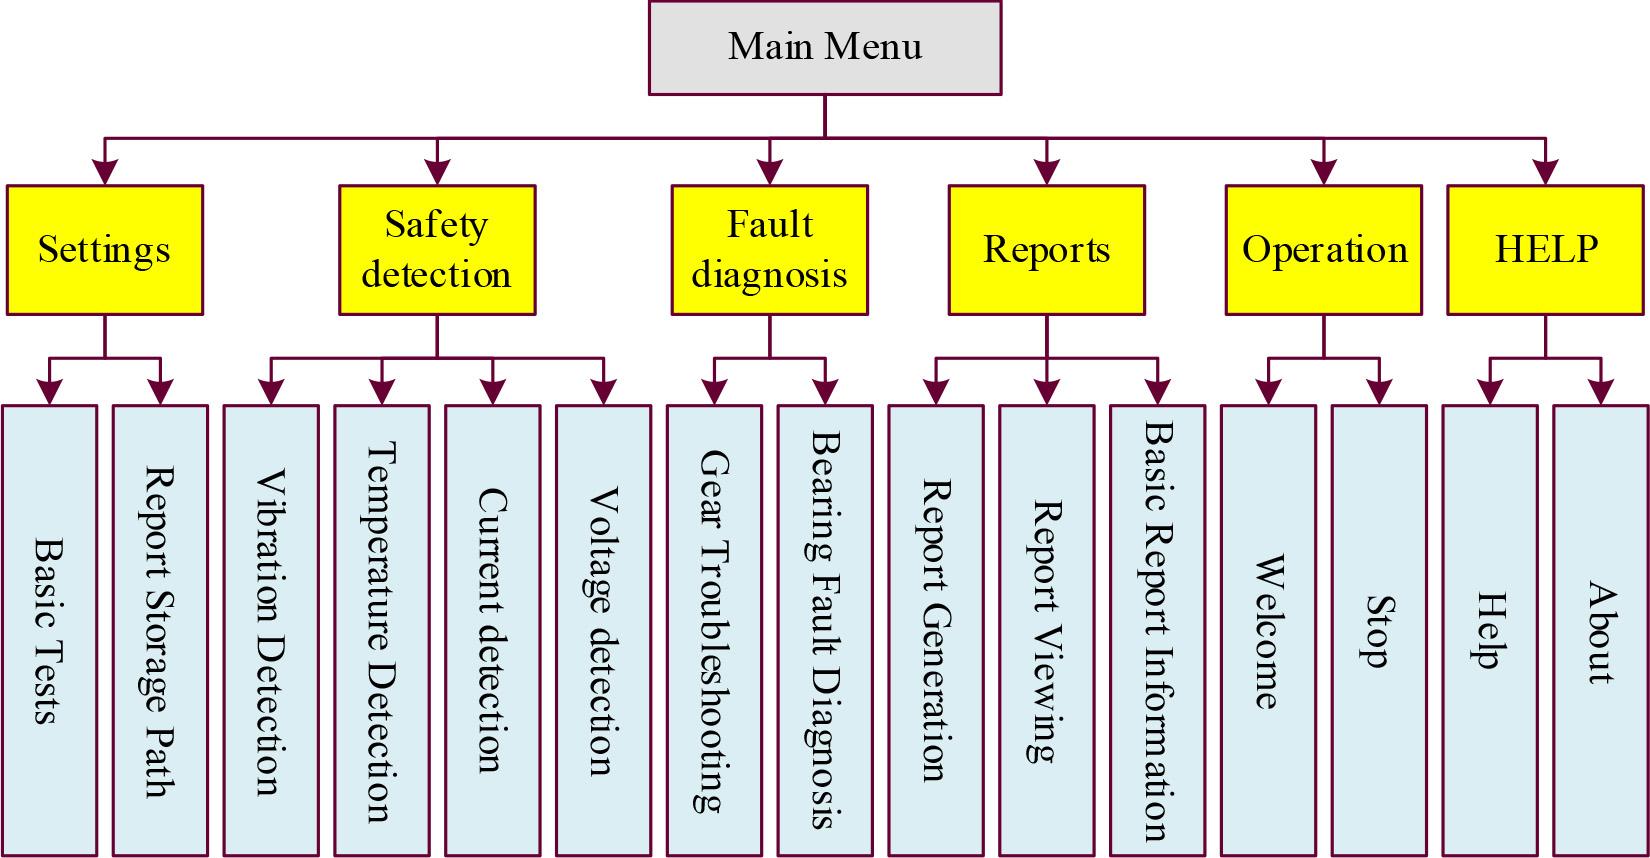
System function module structure design diagram
Whether the selection of hardware equipment of coal mining machine transmission fault diagnosis system is reasonable or not will directly affect the performance of the whole system. In the system, the important function of the hardware is to detect the relevant signals during the operation of the coal mining machine transmission system, and then process and transport the signals to complete the data processing in the set host computer. The hardware composition of the coal mining machine transmission device fault diagnosis system is shown in Figure 3. The hardware devices in the whole system mainly include sensor device, conditioning circuit device, data acquisition card device and computer device, etc. The most critical is the sensor device. The most critical is the sensor device, if the sensing device can not accurately detect the coal mining machine transmission device operation process of various signal information, then all the subsequent work can not be carried out, but also can not ensure the accuracy of the subsequent analysis results. Therefore, the deployment of optical sensor devices are further analyzed and explained.

Hardware structure of fault diagnosis system of shearer drive device
The selected sensing devices are set on various parts of the coal mining machine transmission device, for piezoelectric sensing device, it is set on the gear box parts and bearing end cover parts in the cutting part of the sensing device, and at the same time, the piezoelectric sensing device is set on the fixed box and the bearing structure of the hauling part to ensure that the vibration signal data at these positions can be accurately detected. The temperature sensing device is connected to the gearbox oil pool in the cut-off part and the gear drive oil pool in the traction part. In addition, the voltage sensing device and the current sensing device are installed on the cut-off motor and the traction motor. On the drum part of the coal mining machine, reflective sheets are uniformly pasted at side positions thereof, and the light sensing device is set opposite the pasted reflective sheets in a specific area. The specific detection points are set up as shown in Fig. 4. In the figure 1. Represents the vibration sensing device 2. Represents the temperature sensing device 3. Represents the voltage sensing device 4. Represents the AC current sensing device 5. Represents the DC current sensing device 6. Represents the photoelectric sensing device.
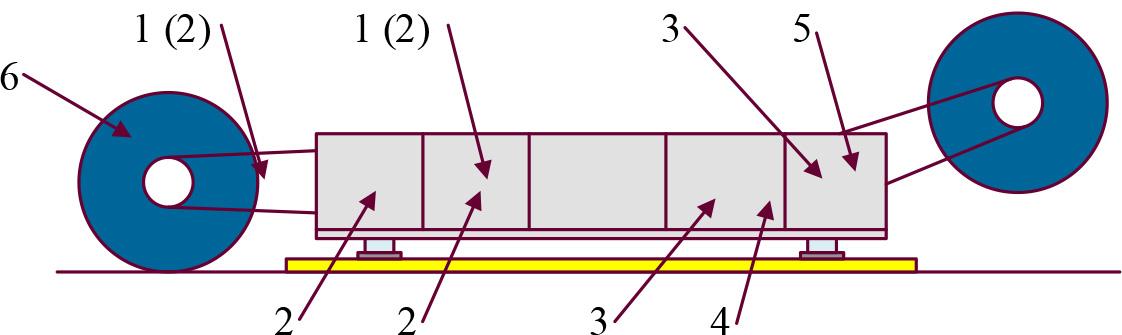
Setting of detection points
In order to efficiently complete the experimental part of this test, I complete all the diagnostic model building process in the laboratory specification model S822LC IBM high-performance computing platform, equipped with NVIDIA Tesla K80GPU and model V5000 disk storage array. GPU is used to accelerate the computing speed of the model, and disk storage array is used for the storage of data.
The master meta-analysis-neural network model constructed in this paper is done under the TensorFlow framework. TensorFlow 1.0 is installed and the compilation environment of Jupyter Notebook is configured for remote access. By accessing the command side to enter the Python environment, TensorFlow was successfully launched, indicating the completion of the software platform construction.
Coal mining machine transmission mechanism failure characteristics analysis, mainly in the high-speed area of the straight gear system and low-speed planetary wheel system failure, therefore, this paper combined with the arrangement of the measurement point location of the two regions of the measurement point location area division, according to the high-speed area of the straight gear system and the low-speed planetary gear system of the two test areas for sample collection experiments.
The four vibration measurement points in the region for vibration signal acquisition experiments, through the collection of raw signal sample data in accordance with the four measurement point locations, six fault states for grouping, labeling, collection of sample information contains a total of 5,400 groups of samples, each fault state contains the number of samples of 900 groups, each sample contains 100 samples, the formation of 5,400 100-dimensional sample space, each set of data Each set of data contains the state labeling information of the high-speed zone spur gear system, and constitutes the corresponding data set. It is divided into 3:1 according to the ratio, the former part is used as labeled training dataset to complete the modeling of coal mining machinery drive mechanism fault identification, and the latter part is used as unlabeled information to verify the feasibility and accuracy of the coal mining machinery drive mechanism fault diagnosis model. The fault sample information of its high-speed spur gear train is shown in Table 1.
Fault sample information in high-speed area
| Name | Dimensionality | Fault type | Fault label | Number of training set samples | Sample number of test set |
|---|---|---|---|---|---|
| Sample set B | 100 | Normal | N | 900 | 300 |
| Broken tooth | S | 900 | 300 | ||
| Gear wear | A | 900 | 300 | ||
| Bearing outer ring failure | OF | 900 | 300 | ||
| Bearing inner ring failure | IF | 900 | 300 | ||
| Cage fault | PC | 900 | 300 |
Similarly, the use of optical sensor acquisition of the four vibration measurement points in the low-speed region of the vibration signal acquisition experiments, the establishment of the fault characteristics of the sample set, the low-speed region of the planetary wheel system of the fault sample information as shown in Table 2.
Fault sample information in the low-speed zone
| Name | Dimensionality | Fault type | Fault label | Number of training set samples | Sample number of test set |
|---|---|---|---|---|---|
| Sample set C | 100 | Normal | N | 900 | 300 |
| Broken tooth | S | 900 | 300 | ||
| Gear wear | A | 900 | 300 | ||
| Bearing outer ring failure | OF | 900 | 300 | ||
| Bearing inner ring failure | IF | 900 | 300 | ||
| Cage fault | PC | 900 | 300 |
The sample set B of the high-speed planetary gear train measurement point region is normalized by input vectors, where the normalized feature vectors of data set B are shown in Table 3.
Feature vector of training sample after normalization of dataset B (part)
| Fault type | Eigenvector | |||||||
|---|---|---|---|---|---|---|---|---|
| N | 0.21297 | 0.09486 | 0.15887 | 0.05221 | 0.12594 | 0.19261 | 0.08235 | 0.08019 |
| 0.19350 | 0.05898 | 0.00920 | 0.20118 | 0.13347 | 0.04698 | 0.20777 | 0.14892 | |
| 0.13955 | 0.08009 | 0.03191 | 0.03989 | 0.03725 | 0.28475 | 0.34406 | 0.04251 | |
| 0.01305 | 0.10234 | 0.11987 | 0.19075 | 0.22947 | 0.07749 | 0.04374 | 0.22329 | |
| …… | …… | …… | …… | …… | …… | …… | …… | |
| S | 0.10640 | 0.19461 | 0.03478 | 0.09344 | 0.15602 | 0.11345 | 0.15131 | 0.15017 |
| 0.08421 | 0.11199 | 0.01849 | 0.12870 | 0.24908 | 0.23716 | 0.03560 | 0.13476 | |
| 0.06391 | 0.15841 | 0.11829 | 0.13883 | 0.14232 | 0.14104 | 0.10088 | 0.13631 | |
| 0.02974 | 0.00868 | 0.22907 | 0.18728 | 0.08128 | 0.03611 | 0.15264 | 0.27520 | |
| …… | …… | …… | …… | …… | …… | …… | …… | |
| A | 0.18162 | 0.00291 | 0.11185 | 0.14562 | 0.06085 | 0.14046 | 0.17560 | 0.18108 |
| 0.00371 | 0.00313 | 0.15036 | 0.08802 | 0.30294 | 0.14026 | 0.18726 | 0.12434 | |
| 0.17718 | 0.09656 | 0.04656 | 0.12148 | 0.06901 | 0.18654 | 0.15177 | 0.15091 | |
| 0.05261 | 0.09379 | 0.07688 | 0.06932 | 0.09981 | 0.15608 | 0.40113 | 0.05037 | |
| …… | …… | …… | …… | …… | …… | …… | …… | |
| OF | 0.14586 | 0.00953 | 0.18761 | 0.09874 | 0.17834 | 0.02008 | 0.19397 | 0.16587 |
| 0.00831 | 0.20659 | 0.00456 | 0.12871 | 0.10217 | 0.17141 | 0.20007 | 0.17819 | |
| 0.02537 | 0.18603 | 0.17760 | 0.13276 | 0.00998 | 0.17779 | 0.19473 | 0.09574 | |
| 0.10479 | 0.26374 | 0.04873 | 0.19917 | 0.18575 | 0.03318 | 0.09768 | 0.06696 | |
| …… | …… | …… | …… | …… | …… | …… | …… | |
| IF | 0.15064 | 0.11488 | 0.10280 | 0.00115 | 0.29822 | 0.28111 | 0.02561 | 0.02558 |
| 0.17500 | 0.13032 | 0.05111 | 0.06726 | 0.17448 | 0.09867 | 0.14768 | 0.15549 | |
| 0.00614 | 0.19556 | 0.21277 | 0.18643 | 0.02283 | 0.15349 | 0.21853 | 0.00425 | |
| 0.15921 | 0.17282 | 0.01871 | 0.13709 | 0.12010 | 0.10896 | 0.25875 | 0.02435 | |
| …… | …… | …… | …… | …… | …… | …… | …… | |
| PC | 0.07364 | 0.07512 | 0.17163 | 0.01588 | 0.20185 | 0.04662 | 0.18855 | 0.22673 |
| 0.12080 | 0.17375 | 0.08984 | 0.07633 | 0.02941 | 0.23047 | 0.16039 | 0.11902 | |
| 0.09992 | 0.06173 | 0.14177 | 0.17507 | 0.17365 | 0.14793 | 0.15515 | 0.04477 | |
| 0.19252 | 0.12325 | 0.13163 | 0.08673 | 0.06063 | 0.12587 | 0.15646 | 0.12292 | |
| …… | …… | …… | …… | …… | …… | …… | …… | |
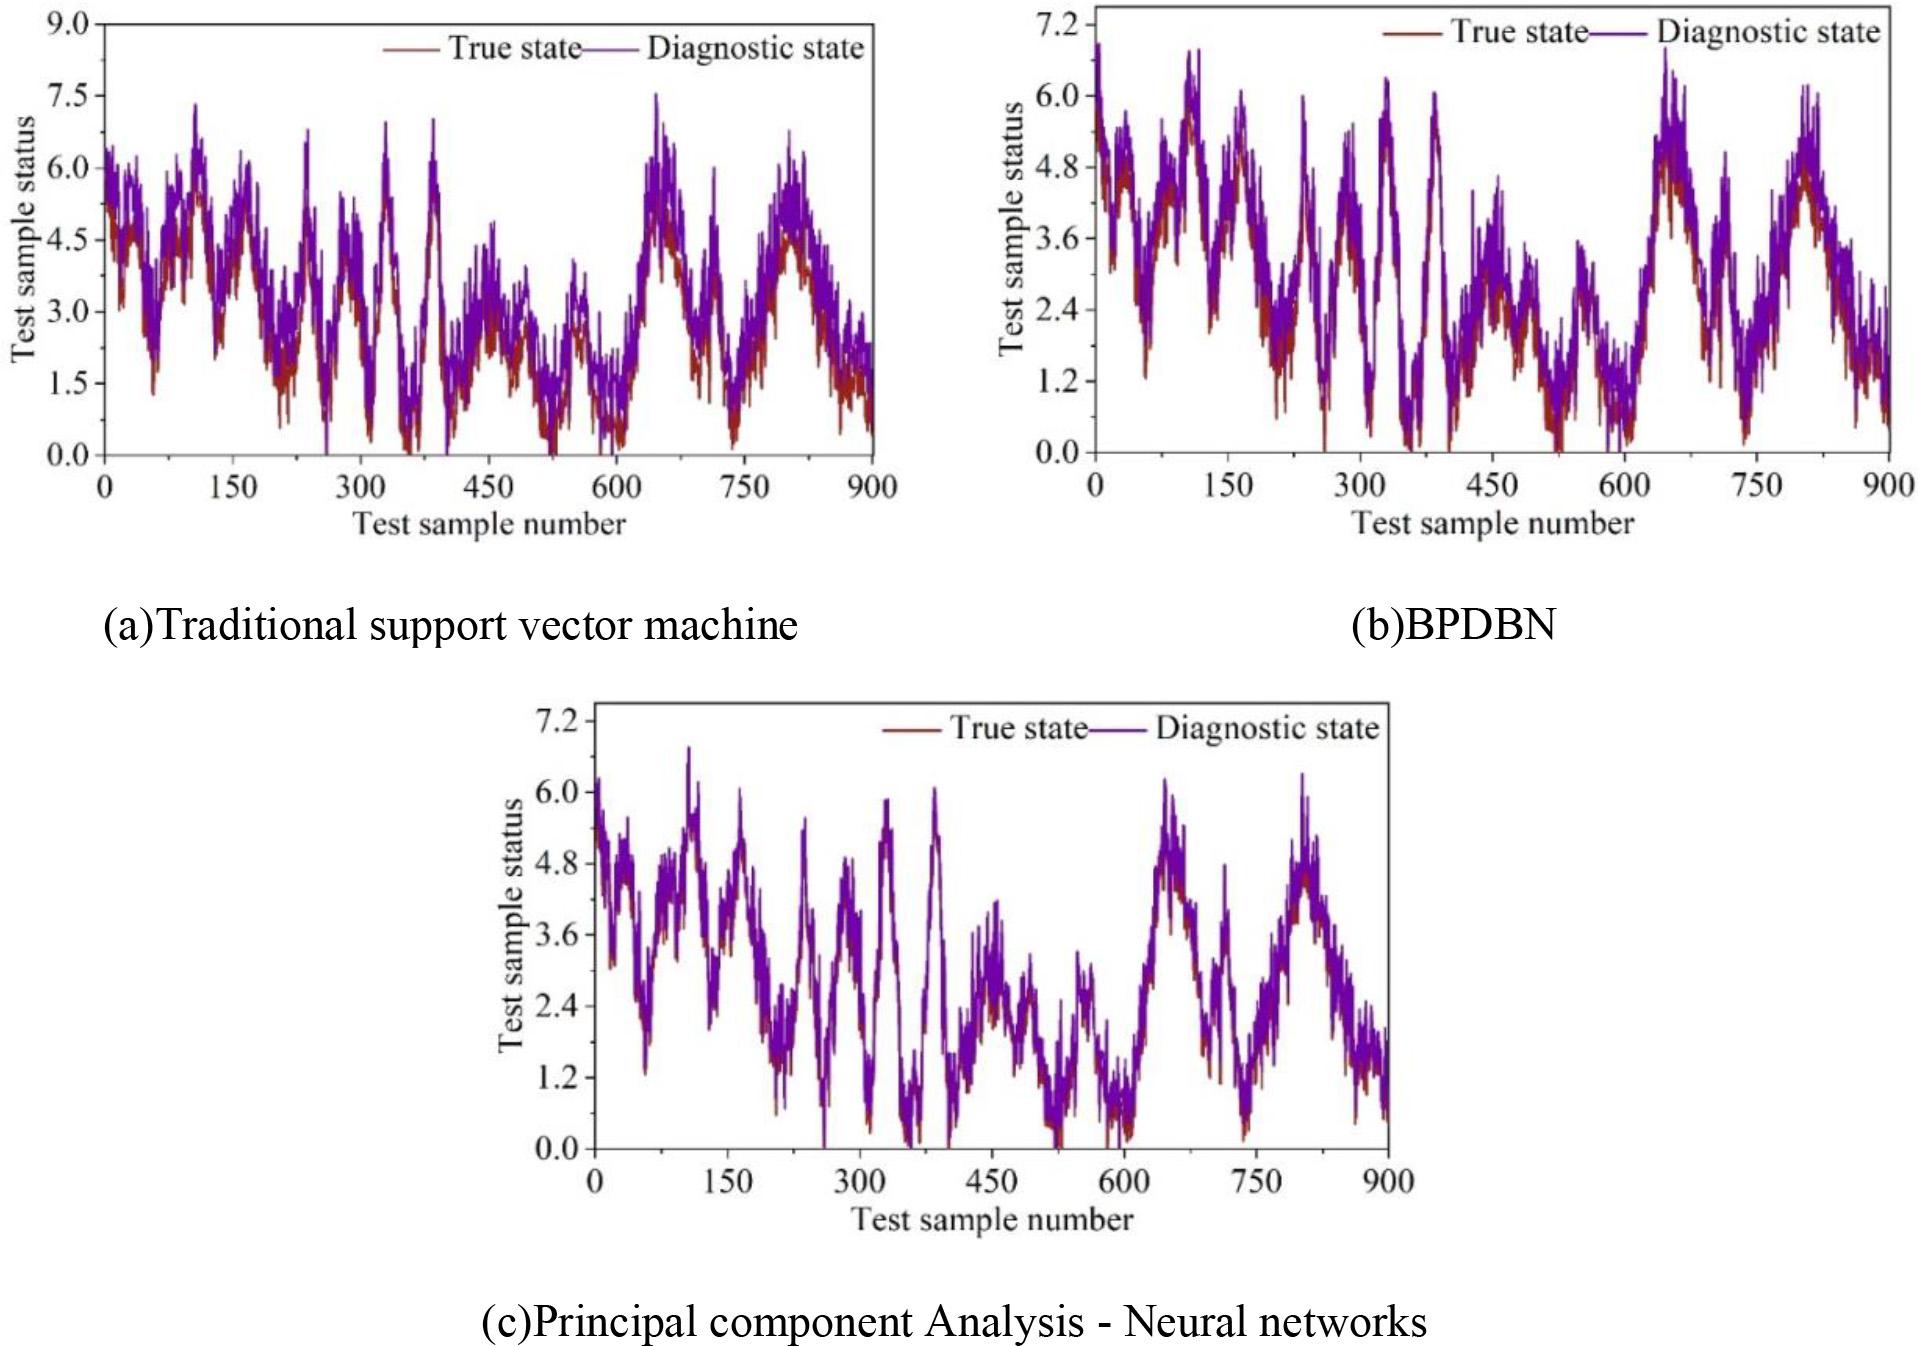
The feature vectors of the obtained test sample set are input into the traditional support vector machine, BPDBN diagnostic model and master element analysis-neural network diagnostic model for diagnostic experiments, respectively. The test results of the high-speed zone transmission mechanism fault diagnosis model are shown in Fig. 5, where (a) ~ (c) are support vector machine, BPDBN, and principal element analysis-neural network, respectively.

Test results of fault diagnosis model for high-speed transmission system
To summarize the diagnostic effect of the above models, this section uses the confusion matrix to comprehensively reflect the diagnostic rate of the current model, the traditional support vector machine diagnostic results shown in Table 4, the supervised BPDBN network model diagnostic results shown in Table 5, and the principal meta-analysis-neural network diagnostic results shown in Table 6, where each row is the actual type of the sample, and each column is the type of diagnostic results of the model. Testing the same data for the three methods, the recognition accuracy of BPDBN is higher than SVM, but the recognition accuracy of bearing outer ring faults is still lower than 90%, while the recognition accuracy of principal element analysis-neural network reaches 97.28% in the whole high-speed spur gear train, which is higher than that of SVM and supervised BPDBN model. In the experiment of high-speed spur gear system, the recognition rate of all kinds of failure modes of the coal mining machine transmission mechanism fault diagnosis model based on principal element analysis-neural network proposed in this paper reaches more than 95%, which proves that the model can effectively identify all kinds of failure modes of the transmission system, especially in the broken tooth fault of the transmission system, the recognition rate reaches the highest.
Traditional support vector machine diagnosis results
| Label | Diagnostic tag | Single recognition rate % | Total recognition rate % | ||||||
|---|---|---|---|---|---|---|---|---|---|
| N | S | A | OF | IF | PC | ||||
| Actual label | N | 831 | 18 | 20 | 13 | 7 | 11 | 92.33 | 89.09 |
| S | 19 | 795 | 25 | 23 | 31 | 7 | 88.33 | ||
| A | 19 | 12 | 812 | 9 | 14 | 2 | 90.22 | ||
| OF | 1 | 39 | 15 | 806 | 16 | 23 | 89.56 | ||
| IF | 35 | 18 | 14 | 21 | 788 | 24 | 87.56 | ||
| PC | 43 | 31 | 21 | 19 | 7 | 779 | 86.56 | ||
Diagnosis results of supervised BPDBN network model
| Label | Diagnostic tag | Single recognition rate % | Total recognition rate % | ||||||
|---|---|---|---|---|---|---|---|---|---|
| N | S | A | OF | IF | PC | ||||
| Actual label | N | 844 | 5 | 11 | 12 | 17 | 11 | 93.78 | 92.47 |
| S | 16 | 821 | 16 | 12 | 18 | 17 | 91.22 | ||
| A | 28 | 12 | 835 | 9 | 14 | 2 | 92.78 | ||
| OF | 14 | 21 | 3 | 826 | 13 | 23 | 91.78 | ||
| IF | 7 | 26 | 11 | 5 | 837 | 14 | 93.00 | ||
| PC | 8 | 3 | 16 | 13 | 15 | 845 | 93.89 | ||
Principal component analysis - neural network diagnosis results
| Label | Diagnostic tag | Single recognition rate % | Total recognition rate % | ||||||
|---|---|---|---|---|---|---|---|---|---|
| N | S | A | OF | IF | PC | ||||
| Actual label | N | 863 | 7 | 3 | 11 | 13 | 3 | 95.89 | 97.28 |
| S | 4 | 877 | 9 | 5 | 3 | 2 | 97.44 | ||
| A | 1 | 5 | 882 | 3 | 6 | 3 | 98.00 | ||
| OF | 7 | 9 | 1 | 867 | 5 | 11 | 96.33 | ||
| IF | 2 | 1 | 1 | 4 | 891 | 1 | 99.00 | ||
| PC | 6 | 3 | 1 | 1 | 1 | 888 | 98.67 | ||
In order to facilitate the diagnosis of each model and reduce computational errors, the same sample set B of the low-speed planetary gear train measurement point area is normalized by input vectors, and due to the limited space, the detailed data table will not be given. The feature vectors of the test sample set are input into the traditional support vector machine, BPDBN diagnostic model, and the main element analysis-neural network diagnostic model for diagnostic experiments. The results of the low-speed zone fault test experiments are shown in Fig. 6.
Low speed zone fault test results
The diagnostic results of the above three models are summarized, and similarly, the confusion matrix is used to comprehensively reflect the recognition rate of the current model in the low-speed planetary wheel system, the traditional support vector machine diagnostic results are shown in Table 7, the supervised BPDBN network model diagnostic results are shown in Table 8, and the principal element analysis-neural network diagnostic results are shown in Table 9, with the actual type of samples for each row, and the diagnostic results of the model for each column Type. The experimental results show that relative to the high-speed zone spur gear train, the diagnostic accuracy of the principal element analysis-neural network-based fault diagnosis model of coal mining machinery transmission mechanism is reduced in the low-speed zone planetary gear train, but it is still higher than that of the traditional support vector machine and supervised BPDBN model. The reason for the lower diagnostic efficiency compared with the high-speed spur gear zone may be due to the fact that the working environment of the planetary gearbox is more complex than that of the high-speed spur gear train, and the nonlinear characteristics of the signal features are more obvious.
Traditional support vector machine diagnosis results
| Label | Diagnostic tag | Single recognition rate % | Total recognition rate % | ||||||
|---|---|---|---|---|---|---|---|---|---|
| N | S | A | OF | IF | PC | ||||
| Actual label | N | 825 | 11 | 23 | 14 | 13 | 14 | 91.67 | 88.63 |
| S | 16 | 792 | 28 | 21 | 30 | 13 | 88.00 | ||
| A | 15 | 13 | 801 | 33 | 22 | 16 | 89.00 | ||
| OF | 13 | 34 | 12 | 798 | 22 | 21 | 88.67 | ||
| IF | 29 | 17 | 18 | 15 | 783 | 38 | 87.00 | ||
| PC | 51 | 26 | 17 | 14 | 5 | 787 | 87.44 | ||
Diagnosis results of supervised BPDBN network model
| Label | Diagnostic tag | Single recognition rate % | Total recognition rate % | ||||||
|---|---|---|---|---|---|---|---|---|---|
| N | S | A | OF | IF | PC | ||||
| Actual label | N | 837 | 7 | 13 | 16 | 14 | 13 | 93.00 | 91.98 |
| S | 19 | 816 | 15 | 16 | 22 | 12 | 90.66 | ||
| A | 36 | 14 | 829 | 5 | 10 | 6 | 92.11 | ||
| OF | 18 | 22 | 11 | 818 | 20 | 11 | 90.89 | ||
| IF | 17 | 13 | 9 | 17 | 829 | 15 | 92.11 | ||
| PC | 16 | 5 | 12 | 8 | 21 | 838 | 93.11 | ||
Principal component analysis - neural network diagnosis results
| Label | Diagnostic tag | Single recognition rate % | Total recognition rate % | ||||||
|---|---|---|---|---|---|---|---|---|---|
| N | S | A | OF | IF | PC | ||||
| Actual label | N | 857 | 1 | 5 | 19 | 1 | 7 | 95.22 | 97.05 |
| S | 3 | 884 | 3 | 2 | 4 | 4 | 98.22 | ||
| A | 4 | 6 | 876 | 1 | 3 | 10 | 97.33 | ||
| OF | 10 | 2 | 4 | 859 | 13 | 12 | 95.44 | ||
| IF | 4 | 2 | 2 | 3 | 886 | 3 | 98.44 | ||
| PC | 7 | 5 | 3 | 3 | 3 | 879 | 97.66 | ||
The hardware and software of the coal miner transmission mechanism fault diagnosis system were briefly introduced above, and this subsection will analyze the static characteristics of the test channel under the experimental environment, and the safety detection contains temperature, vibration, current and voltage (mentioned in subsection 2.3.1). Through the experiments, the static performance indexes of the system are obtained to provide a theoretical basis for the application of the system to the safety detection and fault diagnosis of coal mining machine transmission mechanism.
A static characteristic means that when the input to the system is a static signal, the corresponding output is also a static quantity. This input/output relationship is the static characteristic of the system. Static characteristic indexes mainly include return error, sensitivity, nonlinearity, accuracy, etc.
1) Under static conditions, the sensitivity of the system is:
2) Due to the environment or hardware equipment, etc. the output and input of the system do not show a strict linear relationship. Relative to the rational linear input/output characteristic curve, the actual input/output characteristic curve deviation degree is called the system's nonlinearity. Its expression is:
3) In the actual system, due to the elastic hysteresis of the sensor's elastic components, mechanical friction, material deformation and other reasons, resulting in the same conditions, in the process of changing the input quantity from large to small or from small to large, the same input quantity to get the output quantity there is often a difference between the so-called hysteresis phenomenon. The degree of hysteresis of the system is usually expressed by the return error, which is expressed as:
4) The accuracy of the system refers to the closeness of the measured value to its true value, and the accuracy is a combination of linearity and repetition error. Usually the accuracy of a sensor or measuring instrument is expressed as a dimensionless relative error:
The safety detection and fault diagnosis system of coal mining machine transmission mechanism developed in this paper can realize the acquisition of 10 analog signals and 1 timing/counter signal. Due to the limited laboratory conditions, this paper divides the safety detection of the system into four analog signal input channels of temperature, vibration, current and voltage for static characteristic analysis.
DC regulated power supply analog sensor output 4 ~ 20mA current signal as a standard signal, through the conditioning circuit will be 4 ~ 20mA current signal converted to 0 ~ 5V voltage signal, and then after a simple filtering, input to the corresponding signal acquisition channel. In the front panel of “Basic Parameter Setting”, the range of temperature, vibration, current and voltage sensors is set to 0~200°C, 0~20g, 0~120A, 0~500V respectively, and the corresponding output voltage range is set to 0~5V. 4 analog input channels are obtained from experiments, and the experimental data of temperature input channel are as shown in Table 10, and the vibration input channel is converted to 0~5V by the conditioning circuit. As shown in Table 10, the experimental data of vibration input channel is shown in Table 11, the experimental data of current input channel is shown in Table 12, and the experimental data of voltage input channel is shown in Table 13. The standard current in the table is the current output from the DC regulated power supply, the theoretical value of each signal is the value converted from the corresponding standard current, and the measured value is the value of each parameter detected by using the system.
Temperature input channel experimental data
| N | Standard current(mA) | Theoretical temperature (°C) | Measured temperature (°C) |
|---|---|---|---|
| 1 | 4.6 | 16.3 | 15.6 |
| 2 | 5.1 | 25.7 | 25.5 |
| 3 | 5.9 | 63.8 | 64 |
| 4 | 6 | 68.3 | 67.9 |
| 5 | 6.5 | 74.4 | 74.7 |
| 6 | 10.1 | 74.9 | 75.7 |
| 7 | 10.5 | 91.8 | 90.8 |
| 8 | 12 | 97.4 | 96.2 |
| 9 | 13.1 | 98.3 | 97.6 |
| 10 | 13.3 | 113.6 | 114.8 |
| 11 | 14.5 | 124.2 | 123 |
| 12 | 14.9 | 130.9 | 132.9 |
| 13 | 16.1 | 135.1 | 133.6 |
| 14 | 17 | 141.1 | 140 |
| 15 | 18.1 | 141.3 | 140.3 |
| 16 | 19.6 | 149 | 148.7 |
| 17 | 19.8 | 181.3 | 181.2 |
Vibration input channel experimental data
| N | Standard current(mA) | Theoretical value(g) | Measured value(g) |
|---|---|---|---|
| 1 | 4.6 | 2.6 | 2.9 |
| 2 | 5.1 | 3.7 | 3.6 |
| 3 | 5.9 | 4.2 | 4.8 |
| 4 | 6 | 5.6 | 6.1 |
| 5 | 6.5 | 6.5 | 5.8 |
| 6 | 10.1 | 9.6 | 10.5 |
| 7 | 10.5 | 9.9 | 9.3 |
| 8 | 12 | 10.6 | 10.4 |
| 9 | 13.1 | 11.2 | 11.4 |
| 10 | 13.3 | 11.3 | 11.6 |
| 11 | 14.5 | 12.2 | 12.4 |
| 12 | 14.9 | 13.7 | 13.4 |
| 13 | 16.1 | 14.6 | 14 |
| 14 | 17 | 14.7 | 14.3 |
| 15 | 18.1 | 14.9 | 15 |
| 16 | 19.6 | 15.2 | 15.4 |
| 17 | 19.8 | 17.8 | 17.7 |
Current input channel experimental data
| N | Standard current(mA) | Theoretical current(A) | Measured current(A) |
|---|---|---|---|
| 1 | 4.6 | 3.8 | 4 |
| 2 | 5.1 | 3.9 | 4.2 |
| 3 | 5.9 | 11.7 | 12.4 |
| 4 | 6 | 23.1 | 23.3 |
| 5 | 6.5 | 29.8 | 30 |
| 6 | 10.1 | 35.4 | 35.4 |
| 7 | 10.5 | 46.8 | 46.6 |
| 8 | 12 | 52.5 | 52.5 |
| 9 | 13.1 | 69.7 | 69.4 |
| 10 | 13.3 | 93.7 | 94 |
| 11 | 14.5 | 104.2 | 104.7 |
| 12 | 14.9 | 125.3 | 126 |
| 13 | 16.1 | 140.4 | 140.6 |
| 14 | 17 | 142.6 | 143.1 |
| 15 | 18.1 | 146.6 | 146.8 |
| 16 | 19.6 | 168.9 | 169.2 |
| 17 | 19.8 | 173.4 | 173.8 |
Voltage input channel experimental data
| N | Standard current(mA) | Theoretical voltage(V) | Measured voltage (V) |
|---|---|---|---|
| 1 | 4.6 | 12.1 | 15.3 |
| 2 | 5.1 | 30.7 | 31.1 |
| 3 | 5.9 | 57.3 | 55.6 |
| 4 | 6 | 71.8 | 70.3 |
| 5 | 6.5 | 80.6 | 81.5 |
| 6 | 10.1 | 126.2 | 127.5 |
| 7 | 10.5 | 130 | 129.3 |
| 8 | 12 | 243.7 | 241.9 |
| 9 | 13.1 | 267.5 | 267.7 |
| 10 | 13.3 | 280.3 | 278.2 |
| 11 | 14.5 | 289.3 | 287.9 |
| 12 | 14.9 | 298.9 | 300.5 |
| 13 | 16.1 | 319.6 | 319.8 |
| 14 | 17 | 361.8 | 364.4 |
| 15 | 18.1 | 452 | 450.2 |
| 16 | 19.6 | 483.5 | 482.1 |
| 17 | 19.8 | 490.1 | 487.4 |
Next, the input channel data are processed in the same way to obtain the static characteristic index of each channel. The static characteristic index of each channel is shown in Table 14, which contains precision, nonlinearity, return error degree, and sensitivity.
Static characteristics of each input channel
| Name | Temperature channel | Vibration channel | Current channel | Voltage channel |
|---|---|---|---|---|
| Precision (%) | 1.153 | 0.724 | 1.228 | 0.502 |
| Nonlinearity (%) | 0.613 | 0.246 | 0.529 | 0.145 |
| Return error (%) | 0.527 | 0.519 | 0.638 | 0.349 |
| Sensitivity | 10.88°C/m A | 1.163g/mA | 7.411A/mA | 29.98V/mA |
From the temperature point of view, the precision sensitivity is 10.88°C/mA, the nonlinearity is 0.613%, the return error is 0.527%, and the accuracy is 1.153%, and the four static characteristic indexes are within the permissible range of the system, while the vibration channel, the current channel, and the voltage channel are the same. Overall, according to the analysis of the experimental data of the above channels, the detection channels of the designed coal mining machine transmission mechanism safety detection and fault diagnosis system can meet the requirements and can be applied to the actual detection.
This paper synthesizes the programming language and the corresponding hardware to construct the safety testing and fault diagnosis system of mining coal mining machinery drive mechanism, the safety testing module mainly consists of optical sensors, while the fault diagnosis diagnosis module consists of the principal element analysis method - neural network. The test experimental platform is built to verify and analyze the safety detection and fault diagnosis system of coal mining machinery transmission mechanism. The principal element analysis-neural network is tested on the high-speed zone fault and the low-speed zone fault respectively, and its recognition rate is 97.28% and 97.05%, which is higher than the supervised BPDBN network model and the traditional support vector machine model, i.e., the principal element analysis-neural network is able to realize the system's fault diagnosis function well. The four static characteristic indexes of temperature channel, vibration channel, current channel and voltage channel are within the permissible range of the system, which indicates that the system in this paper can be applied to the actual detection, and responds well to the principle of safe production.
Degree of 2023 Joint Pilot Project of Natural Science Foundation of Heilongjiang, China: Design and research on monitoring system of Shearer transmission tooth wear in coal mine production environment (no.: LH2023E110).