Tobacco adulteration recognition study by hyperspectral data processing under machine learning

Data publikacji: 17 mar 2025
Otrzymano: 13 lis 2024
Przyjęty: 15 lut 2025
DOI: https://doi.org/10.2478/amns-2025-0201
Słowa kluczowe
© 2025 Hongliang Zhang et al., published by Sciendo
This work is licensed under the Creative Commons Attribution 4.0 International License.
The advent of the era of artificial intelligence and big data, so that human society is undergoing an unprecedented change, especially in the industrial performance is particularly prominent, such as the defect detection of the bottle cap, this use of the camera to capture the target image based on the computer vision solution has a high degree of automation, high precision and stability, etc., to improve the production efficiency of the enterprise at the same time, but also to increase the economic benefits of the enterprise, and more importantly, improves market competitiveness [1-2]. In addition, the use of computer vision to solve these problems is the ultimate goal is to improve product quality, to ensure that qualified products are delivered to the user or customer, if the products mixed with debris into the market, then the consumer's health will pose a serious threat to the credibility of the enterprise will be affected, so to ensure that the purity of the raw material is particularly important [3-4].
Tobacco industry, like food, pharmaceutical industry, the purity of raw materials is also very strict control, deterioration or adulteration of raw materials will undoubtedly have a serious impact on the quality of the finished product, the enterprise in the production process of raw materials of foreign matter rejection occupies a very important part of the [5-6]. Early foreign matter rejection is taken in an artificial way, by arranging labor workers in the production line with the naked eye to observe and manually pick out the foreign matter in the tobacco, this method is simple but improve the production cost, more importantly, the effect of manual rejection is often unstable, depending on the subjective decision-making of the labor workers, the accuracy of the lower, nowadays more use of intelligent tobacco foreign matter rejection machine, the equipment is a set of optical, electrical, This equipment is a collection of optical, electrical, computer, mechanical in one of the automated rejection equipment, the use of CCD high-speed camera to collect images of the tobacco stream, and then transmitted to the industrial computer for image analysis and understanding to identify the location of the foreign body and transmitted to the rejection valve, the rejection valve using high-speed downward pressure airflow will be removed from the foreign body [7-9]. The core part of the device is the tobacco foreign matter recognition algorithm, there are two types of recognition algorithms, one is based on the color recognition algorithm, the other is based on the texture recognition algorithm, color-based recognition algorithms due to its speed and is widely used, and in the color recognition algorithms how to establish a perfect color model for the color of the tobacco leaf is the key to this type of algorithm [10-12].
In the tobacco online foreign matter rejection of this link, North America, Western Europe and Japan, some of the larger tobacco companies are using optical debris automatic sorting equipment, they have become an indispensable general equipment in the silk production line. In China, there are very few cigarette factories have introduced foreign optical tobacco sorting equipment Tobacco Sorter, but it is expensive about 800,000 U.S. dollars per unit, expensive spare parts, after-sales maintenance services are difficult to get in place in a timely manner, and more importantly, by the intellectual property rights of the products are subject to the constraints of the introduction of the same level of equipment with foreign countries, and it is difficult to increase the competitiveness of the enterprise's international market [13-14]. Therefore, the development of tobacco online foreign matter rejection system with independent intellectual property rights is of great significance to save the expenditure of tobacco enterprises, stabilize the intrinsic quality of tobacco products, solidify and develop the famous cigarette brands, improve the automation and control level of silk production line, and enhance the competitiveness of China's tobacco enterprises in the international tobacco market, etc. [15].
In this paper, the region of interest of the image data of tobacco samples was selected to distinguish the samples from the environment and reduce the interference caused by the background information. The SNV method was adopted to preprocess the hyperspectral data to correct the hyperspectral error caused by the scattering effect, followed by PCA to extract features from tobacco data of different qualities, and to transform the multi-dimensional bands in the original data into a low-dimensional sample matrix, so as to maximize the retention of the key data in the original data. GoogLeNet was adopted as the pre-training model for deep learning, and certain non-essential layers of GoogLeNet were removed and new layers were added, in addition to changing the activation function of the model, to achieve the purpose of improving the CNN recognition model, and to improve its performance in tobacco adulteration experiments.
The hyperspectral imaging system built independently by the laboratory mainly consists of a dark box, an achromatic lens (HSIA-OLE23 type), a visible light-short-wave infrared broom-type line-scanning imaging spectrometer, a motorized moving platform, eight 50 W halogen lamps, a computer and SpecView image acquisition software. Among them, the achromatic lens is used to adjust the focal length so that the camera is in the focus of the photographed object. A Visible-Shortwave Infrared (VSWIR) Broom Type Line Scanning Imaging Spectrometer (BSLSIS) is used to acquire information on the spatial and spectral dimensions of the object, and a motorized mobile platform is used to carry the test object. 8 halogen lamps are arranged in a trapezoidal shape for the dual camera system, and the light intensity can be adjusted to achieve a light uniformity of more than 90%. The motion of the motorized mobile platform and the acquisition of hyperspectral images are controlled by the computer's own SpecView software.
In order to eliminate the non-uniformity of light intensity in each band and the noise interference caused by dark current, the black and white plate correction method was used for image correction. A standard white calibration plate with 0.99 reflectance is used to obtain the hyperspectral data
where
The uniformity of light and dark intensity and the degree of noise interference in the image of the tobacco sample data were improved by the black and white plate correction.
The region of interest (ROI) of the collected sample image data is selected to differentiate the sample from the background environment to reduce the interference of background information and the complexity of data processing. The ROIs are selected by binarizing the image according to a specific camera band, with a threshold value of 0.2 and pixels higher than this value marked as 1. Pixels in the ROIs are marked as 1 and non-ROI pixels as 0. The average spectral reflectance of the pixels in the ROIs is obtained by taking all the pixels marked as ROIs and then calculating the average value of the spectra of the pixels. The average value was obtained by taking all the pixels labeled as ROIs and calculating their spectral average. The ROI and non-ROI regions of the hyperspectral images of tobacco samples were significantly distinguished after binarization, which further improved the complexity of the data.
Spectral data preprocessing is a key step to improve the model performance, and different preprocessing techniques usually have significant effects on the prediction error and the number of optimal latent variables. Currently, the widely used preprocessing methods for spectral data mainly include Savitzky-Golay filter smoothing, multivariate scattering correction (MSC), SNV, first-order derivative, second-order derivative and their combinations. In this paper, SNV is adopted to preprocess the spectral data in order to correct the spectral error caused by the scattering effect, and the calculation formula is as follows:
Where,
In the data processing process of hyperspectral imaging technology, due to the data redundant information and the close correlation between bands, it increases the difficulty of data analysis to a certain extent, which may adversely affect the analysis and prediction of the model. In order to reduce data duplication and improve the accuracy of discriminative information, dimensionality reduction of hyperspectral data through feature extraction can enhance the accuracy of data classification and improve the efficiency of model training.PCA can orthogonally transform the original variables and recombine them into principal components, which realizes the purpose of dimensionality reduction of high-dimensional datasets under the premise that each principal component contains information of the original variables. In this experiment, PCA is used to extract features from hyperspectral data of different quality tobacco leaves [16], which uses orthogonal transformation to transform the multidimensional bands in the original spectral data into a low-dimensional sample matrix, so as to maximize the retention of the key information of the original data.The data processing steps and principles of PCA are as follows.
1) Normalized data: the raw data are normalized by subtracting the mean and dividing by the standard deviation to ensure that each feature has the same scale. Let the raw spectral data be a matrix of
2) Calculate the covariance matrix: the covariance matrix describes the relationship between the data, where the non-diagonal elements represent the covariance between different features, covariance matrix
3) Calculate the eigenvalues and eigenvectors: eigenvalue decomposition is performed on the covariance matrix
4) Select principal components: according to the size of the eigenvalues in descending order, select the first
5) Projected data: project the original data onto the selected first
In order to improve the training performance, GoogLeNet was used in this study as a deep learning pre-training model, which was used as a basis to train the classifier. In the improved CNN recognition network classifier, the last 5 layers of GoogLeNet were removed and 15 new layers were added. In addition, the ReLU activation function in the feature map layer is changed to a Leaky Rectified Linear Unit (LeakyReLU) activation function [17] to improve the expressiveness of the model and to overcome the problem of vanishing ReLU gradients without disturbing the primary convolutional neural network architecture. The structure of the improved CNN recognition network is shown in Fig. 1 [18].
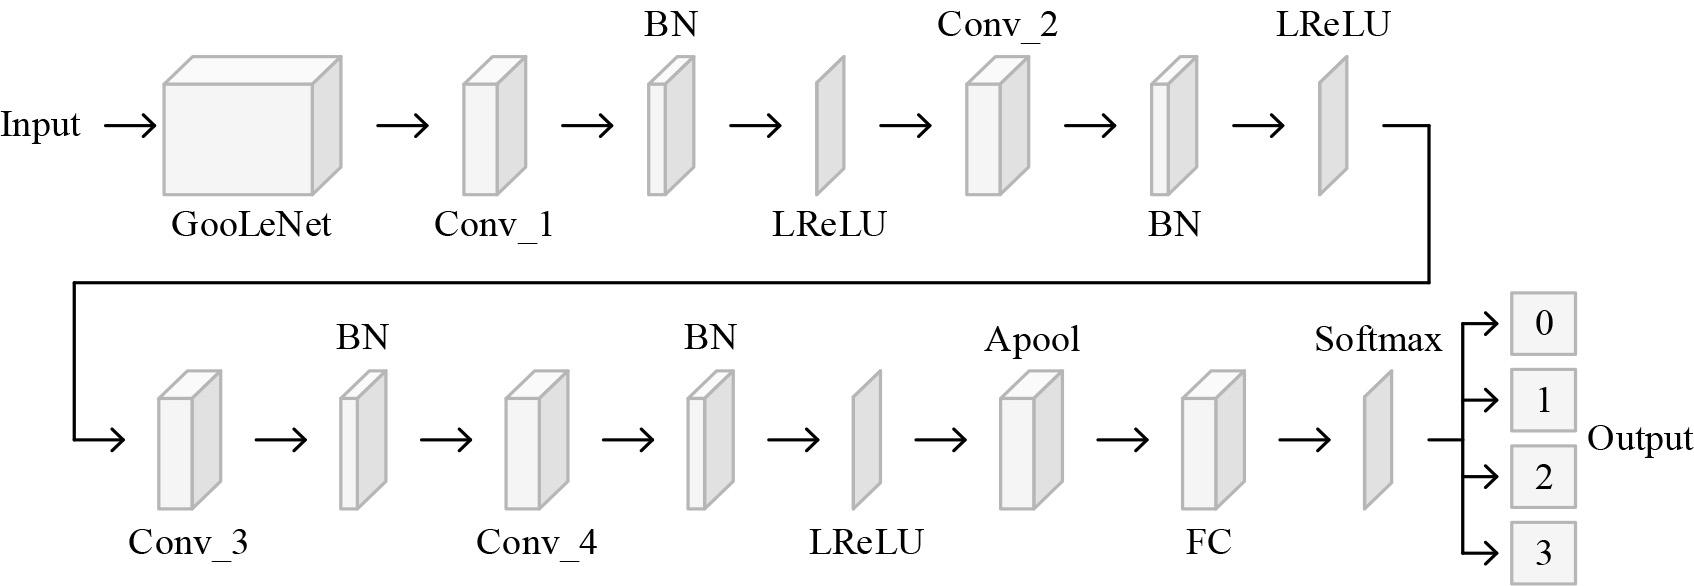
Improved CNN recognition network structure
Where Conv_i denotes the convolutional layer, i=1, 2, 3, 4; BN denotes the batch normalization layer. LReLU denotes the activation function of LeakyReIU. Apool denotes the average pooling layer. FC denotes the fully connected layer. The first convolutional layer (Conv_l) in the improved CNN recognition network uses a 1 × 1 sized filter, thus effectively reducing the size of the image. The second convolutional layer (Conv_2) uses a 3 × 3 convolutional block, thus having a dimension reduction effect. In addition, the starting module of GoogLeNet has different convolutional kernels such as 1 × 1, 3 × 3 and 5 × 5 convolutional kernels for extracting features at different scales.
In general, larger convolutional kernels will cover a larger area to compute features. 1 × 1 convolutional kernels on the other hand provide more detailed features and reduce the amount of computation. The new additions in the improved CNN recognition network include four convolutional layers, all with filter sizes of 1 × 1. In addition, the increased number of convolutional layers in the CNN facilitates the provision of more detailed, accurate, and robust features. The four newly added convolutional layers allow for the extraction of higher level features compared to the initial layer that extracts lower level features.
Convolutional layers are used to learn deep features from the input image and generate a feature map. Improved CNN uses different sized filters in the convolutional layers and 3 × 3 filters in the maximum pooling layer. The discrete convolution computation process is shown in equation (3):
Where:
Activation functions are usually used in deep learning based models for nonlinear transformation processes. In this study, LeakyReLU activation function is used instead of the traditional ReLU to solve the ReLU gradient vanishing problem.The equation of LeakyReLU activation function is as follows:
Where:
This study also utilizes the batch normalization layer to perform normalization operations on the output generated by the convolutional layer. Normalization effectively reduces the training time of the model for a more efficient and faster learning process. The batch normalization process is calculated as follows:
Where:
After the convolutional layer, a pooling layer is used to simplify the information coming from the convolutional layer (a downsampling process to reduce the size of the feature map and remove unnecessary data). Average pooling and maximum pooling are the 2 most common pooling strategies. In the last 15 layers, this study uses a global average pooling operation. In the pooling layer, the network does not perform any learning. The pooling process in this study uses a 3 × 3 sized filter. The pooling process is as follows:
Where:
In the improved CNN, the convolutional layer is followed by a fully connected layer, and this part of the network structure is responsible for mapping the high-level features extracted from the convolutional layer to the final tobacco adulteration recognition result. Specifically, the convolutional layer extracts features from the input data through a series of filters, which may then undergo dimensionality reduction through a pooling layer to reduce the number of parameters and improve invariance to image displacement. Next, these features are further nonlinearly transformed through one or more fully connected layers, culminating in an output layer that determines the probability of each category. The fully connected layers determine the most significant patterns in order to categorize the image. The fully connected layer is computed as follows:
Where:
The activation function in the improved CNN makes the output of the fully connected layer more normalized and the Softmax function calculates the probability for each tobacco category and outputs the final tobacco category to derive its adulteration result.The formula for calculating the probability of the Softmax function is as follows:
Where:
Tobacco market often appear as a good, inferior tobacco mixed into the top grade tobacco mixed sales, bad tobacco traders to seek high profits, so this paper designed a tobacco adulteration identification experiment. Tobacco for testing (provided by a tobacco company) types of tobacco, respectively, superior tobacco - mature leaf level 1, medium tobacco - smooth leaf level 1, inferior tobacco - green and yellow smoke level 1, each variety were collected 200 samples. The samples were divided into a calibration set and a test set according to the ratio of 3:1. The calibration set was used for training validation and model parameter optimization, and the test set was used for evaluating the performance of the model on unknown samples.
The appropriate number and size of convolutional kernels enable the improved CNN model to fully utilize both local and global features during the training process. In this study, the convolution kernel size is first set to 3 × 1, and the slip step of the convolution kernel is fixedly set to 1. The number of convolution kernels in the three convolutional layers is set to different combinations of 128, 64, 32, and 16, respectively, and the optimal number of convolution kernels in each convolutional layer is determined according to the optimization results of the model evaluation index. The results of determining the optimal number of convolutional cores are shown in Table 1, from which it can be seen that increasing the number of convolutional cores is favorable for feature extraction, the loss function converges too fast during the training process, and the correctness rate of the calibration set validation set is high, but the correctness rate of the test set is poor, and it is easy to overfitting. On the contrary, reducing the number of convolution kernels is unfavorable to feature extraction, the training process is unstable, the loss function fluctuation decreases, the convergence speed slows down, and the correct rates of the correction set, validation set, and test set are ultimately lower. Therefore, this study chooses the combination of (128, 64, 64) to extract local features and wide-area features through multi-layer convolutional stacking to alleviate the overfitting problem of the model as much as possible under the premise of satisfying the feature extraction efficiency.
| Combination of number of convolution kernels | Correct rate | Average precision | Average recall | Average F1 | ||
|---|---|---|---|---|---|---|
| correction set | verification set | test set | ||||
| (128,128,128) | 0.983 | 0.98 | 0.855 | 0.856 | 0.855 | 0.851 |
| (128,128,64) | 0.965 | 0.946 | 0.895 | 0.908 | 0.893 | 0.899 |
| (128,64,64) | 0.96 | 0.956 | 0.876 | 0.88 | 0.876 | 0.872 |
| (128,64,32) | 0.938 | 0.925 | 0.837 | 0.854 | 0.838 | 0.835 |
| (64,64,32) | 0.931 | 0.929 | 0.877 | 0.881 | 0.873 | 0.873 |
| (64,32,32) | 0.93 | 0.918 | 0.876 | 0.876 | 0.869 | 0.875 |
| (64,32,16) | 0.913 | 0.885 | 0.831 | 0.853 | 0.834 | 0.833 |
| (32,32,16) | 0.916 | 0.891 | 0.855 | 0.857 | 0.853 | 0.853 |
In order to further explore the effect of convolution kernel size on the performance of the improved CNN model, the convolution kernel sizes of the three convolutional layers are set to a combination of 3 and 5, and the results of tobacco variety detection based on hyperspectral data under different combinations of convolution sizes are shown in Table 2. As can be seen from Table 2, different convolution kernel sizes affect the training speed and sensory field, larger size convolution kernels can increase the sensory field, but introduce more parameters and greatly increase the amount of operations, smaller convolution kernels also have better performance by stacking multiple layers. Therefore, the combination of convolution kernel sizes chosen in this study is (3, 3, 3).
| Convolution core size | Correct rate | Average precision | Average recall | Average F1 | ||
|---|---|---|---|---|---|---|
| correction set | verification set | test set | ||||
| (5,5,5) | 0.975 | 0.966 | 0.874 | 0.871 | 0.874 | 0.873 |
| (5,5,3) | 0.965 | 0.964 | 0.905 | 0.904 | 0.904 | 0.904 |
| (3,3,3) | 0.974 | 0.968 | 0.921 | 0.942 | 0.936 | 0.935 |
| (3,5,3) | 0.954 | 0.928 | 0.832 | 0.856 | 0.835 | 0.834 |
| (3,5,5) | 0.962 | 0.971 | 0.874 | 0.882 | 0.871 | 0.872 |
The activation function is an important factor affecting the performance of CNN model, and the appropriate activation function is favorable for the extraction of nonlinear features in spectral data by neural networks. In order to select the appropriate activation function to establish the tobacco adulteration recognition model, four activation functions, LeakyReLU, ReLU, Tanh and Sigmoid, were used for modeling, and the optimal activation function was selected according to the model performance, and the results of different activation functions for the detection of tobacco varieties based on hyperspectral data are shown in Table 3. From Table 3, it can be seen that the LeakyReLU activation function has the highest correct rate in both the calibration set and the validation set, which indicates that this activation function has the best effect for nonlinear fitting. In summary, the improved CNN model constructed in this study is mainly composed of three convolutional layers, with the number of convolutional kernels of 128, 128, and 64, respectively, and the size of the convolutional kernel of 3 × 1, and the activation function is LeakyReLU.
| Activation function | Correct rate | Average precision | Average recall | Average F1 | ||
|---|---|---|---|---|---|---|
| correction set | verification set | test set | ||||
| ReLU | 0.977 | 0.963 | 0.925 | 0.96 | 0.936 | 0.937 |
| LeakyReLU | 0.989 | 0.997 | 0.913 | 0.848 | 0.844 | 0.845 |
| Sigmod | 0.982 | 0.971 | 0.919 | 0.919 | 0.912 | 0.936 |
| Tanh | 0.981 | 0.962 | 0.878 | 0.928 | 0.921 | 0.923 |
The extracted raw spectral data were visualized using the PCA algorithm, which can reflect the main characteristics of different tobaccos, and the results of the characteristic visualization are shown in Fig. 2, with the black circle being the superior tobacco-perfected leaf level 1, the blue triangle being the medium tobacco-smooth leaf level 1, and the orange pentagon being the inferior tobacco-green and yellow tobacco level 1. The three types of tobacco have relatively independent spatial distribution, which can visualize that these three types of tobacco are classifiable and have strong theoretical guidance for subsequent classification.
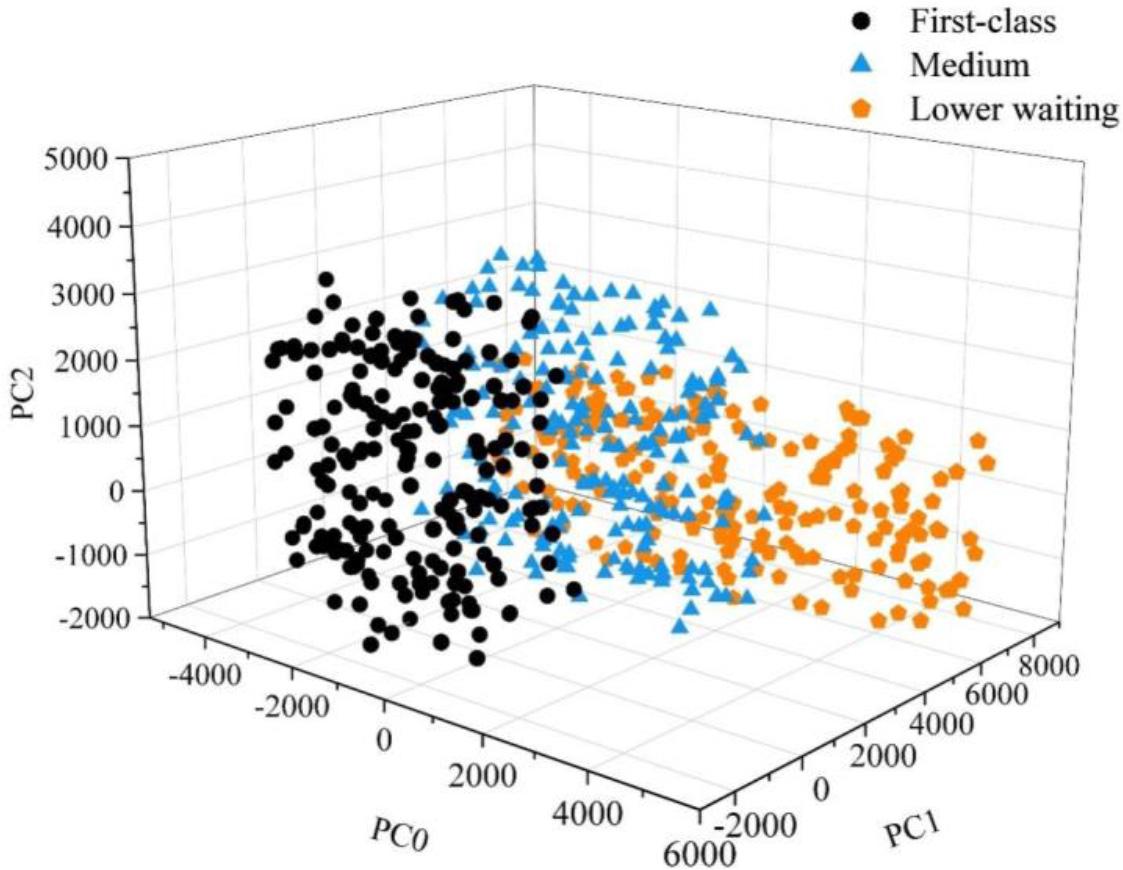
Visual results of tobacco pca
The spectral data can be detected by the LOF algorithm to find an anomalous sample data, which is eliminated and the remaining sample data is used for subsequent data processing. After the elimination of the sample spectral data with MATLAB R2018a for graphing. Because too many curves are concentrated in the graph, it is not easy to see the difference between the reflectance values of the three types of tea spectral data, so all the sample spectral data of each type of tea were averaged and then plotted, and the average value of the spectral data is shown in Figure 3. From Figure 3, it can be seen that the spectral curve trend of these three types of tobacco is probably similar, with three peaks and one trough, and due to the differences in the internal structure of the three types of tobacco, there are obvious differences in the reflectance values (fluorescence intensity) at the three peaks and one trough, and the three types of tobacco have the greatest differences in fluorescence intensity between 720 nm-780 nm, the lowest fluorescence intensity of the finished leaves, and the highest fluorescence intensity of the green and yellow tobaccos. These three peaks are near 510nm, 700nm and 750nm respectively, and the trough is near 730nm, from which it can be inferred that the bands near these four bands will be used as the characteristic bands and play a dominant role in the identification of the three types of tobacco adulteration.
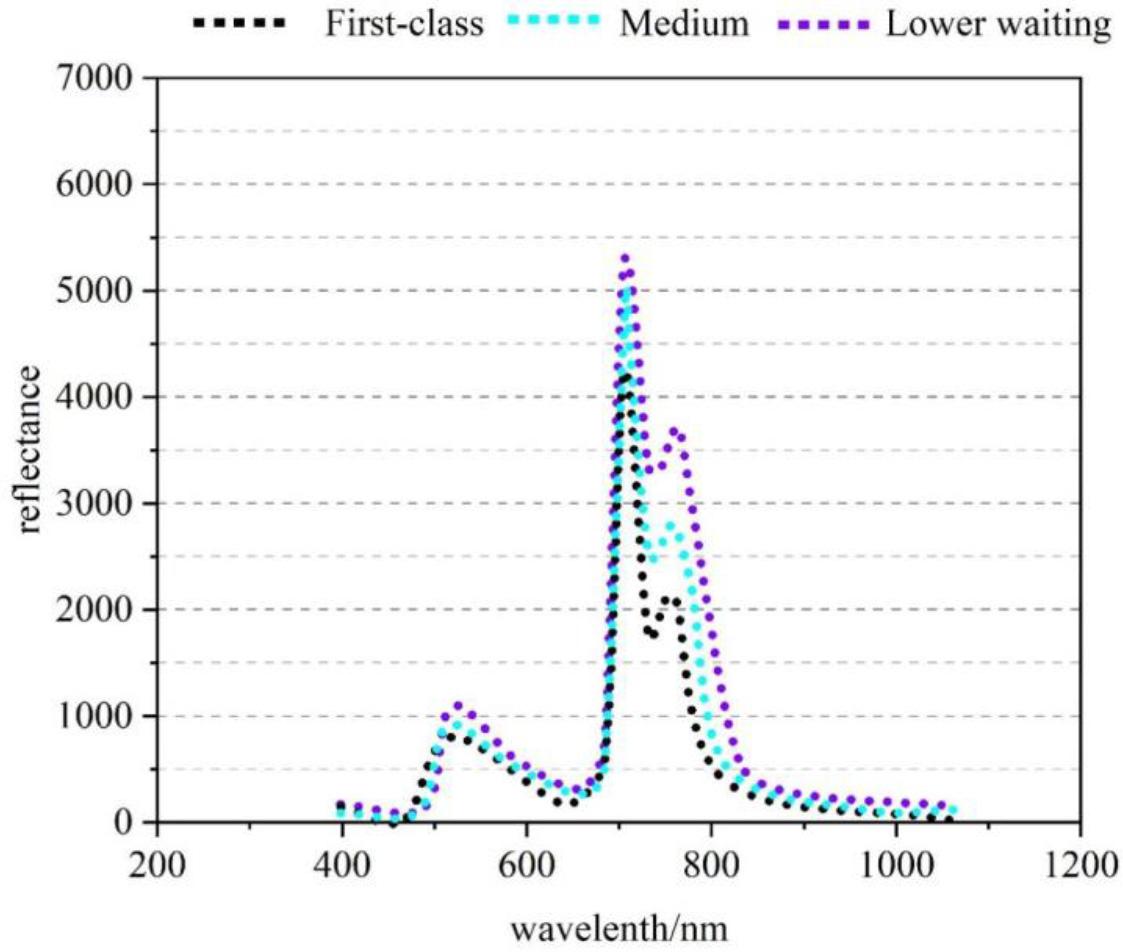
The average spectral curve of three kinds of tobacco
When these data were collected, the spectral data collected from different samples varied because of the noise data caused by light stability, instrument stability, dark current, light scattering, light refraction, and other light shifts when the samples to be tested were photographed. In order to eliminate the influence of non-quality factor information in the fluorescence hyperspectral data, and to obtain the hyperspectral data with original features as the input set for subsequent modeling, the sample spectral data were preprocessed using the PCV algorithm, and in addition, the SG and GWS preprocessing methods were used for a comparative analysis with the preprocessing method in this paper. After preprocessing, the recognition is carried out with the models SVM, RF and KNN and the improved CNN model in this paper, respectively, and the recognition accuracy is shown in Fig. 4, and the modeling time is shown in Table 4.
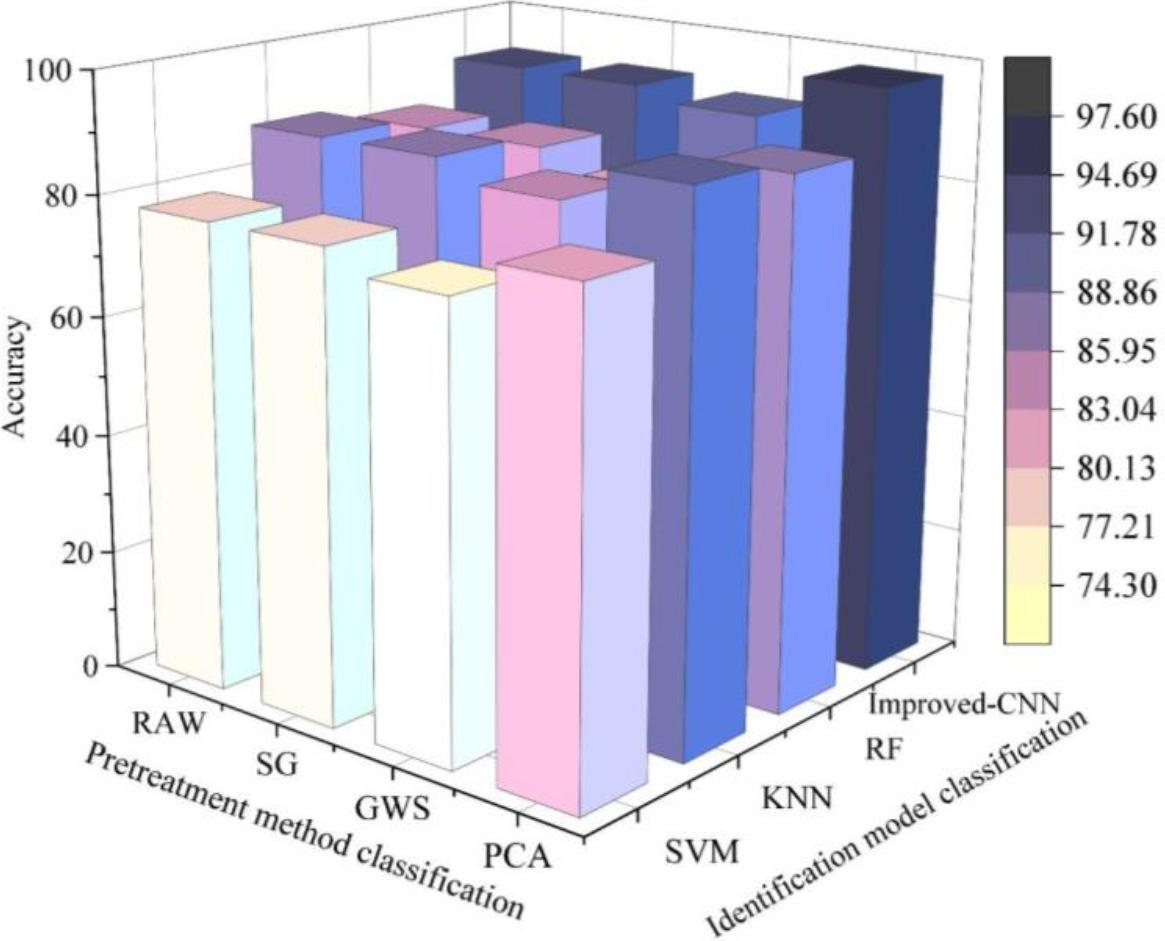
Different pretreatment method classification effect
| Methods | Modeling Time(s) | |||
|---|---|---|---|---|
| SVM | RF | KNN | This model | |
| RAW | 0.06 | 0.04 | 0.012 | 0.0003 |
| SG | 0.06 | 0.04 | 0.012 | 0.0003 |
| GWS | 0.062 | 0.043 | 0.011 | 0.00032 |
| PCA | 0.057 | 0.038 | 0.009 | 0.00021 |
From Table 4 and Fig. 4, it can be seen that: the classification effect of model SVM is the worst, the original data without data preprocessing is only 77.45%, and the original data after SG preprocessing has no effect on the classification effect, and after GWS preprocessing the classification effect is reduced instead, only 75.49%, and the classification effect of this model is much lower than the other three.
The classification effect of the model in this paper is the best, the original data without data preprocessing reached 92.15%, after the SG preprocessing has little effect on the classification effect, after the GWS preprocessing the classification effect is reduced instead, only 90.19%, after the PCA processed the recognition accuracy is significantly improved, reached 97.56%.
While the original data of this paper's model is not pre-processed modeling time is 0.0003s, after SG pre-processing modeling time is 0.0003s, there is no enhancement, after GWS pre-processing modeling time is 0.00032s, not enhancement instead of reduction, after this paper's pre-processing method, the modeling time is 0.00021s, which is enhanced by 30%.
From the above analysis, it can be seen that the application of PCA preprocessing method for feature dimensionality reduction and then use the improved CNN model for tobacco adulteration identification has the highest accuracy and reduces the modeling time most effectively.
Imported tobacco and Yunnan and other high sales of tobacco origin of tobacco quality is better, and Gansu Province and other dry environment of tobacco quality is more general, so in order to make profits, some businesses will be in the imported tobacco and high-quality origin tobacco adulterated with the quality of the more general, lower cost of tobacco, so for the adulteration of tobacco origin, the application of this paper's recognition model for the identification of the origin of the problem of tobacco, randomly selected Brazil, Yunnan, Gansu three origins of tobacco each 20 pieces, a total of 60 pieces to do the test set, the classification results shown in Table 5. The randomly selected Brazil, Yunnan, Gansu three origins of tobacco each 20 pieces, a total of 60 pieces to do the test set, the classification results are shown in Table 5.
| Num | Model | Accuracy | Precision | Recall | F1 |
|---|---|---|---|---|---|
| 1 | KNN | 89.78% | 89.58% | 86.45% | 87.41% |
| 2 | RF | 92.78% | 93.12% | 92.56% | 92.88^% |
| 3 | Improved CNN model | 96.45% | 97.42% | 97.62% | 97.88% |
| 4 | Artificial | 81.23% | 82.31% | 84.51% | 83.64% |
Based on the hyperspectral data of tobacco origin, after training, the KNN model, RF model and the improved CNN model in this paper have achieved relatively good recognition results, which are higher than the manual recognition accuracy, among which the improved CNN model in this paper has the best performance, with a recognition accuracy of 98.28%, a precision of 98.87%, a recall of 98.94%, an F1 value of 97.88%, and all the evaluation indexes are higher than those of other models. , and all the evaluation indexes are higher than other models. It proves that the improved CNN model in this paper gives full play to the superiority of network structure on the basis of CNN. It is able to distinguish tobacco of different origins well and provides a new idea for the study of tobacco adulteration.
In this paper, a method based on hyperspectral image technology is proposed to accurately detect the type of tobacco adulteration and the origin of adulteration, which shows good classification and recognition effect in detecting the adulteration of tobacco.
The recognition effect of the improved model in this paper is the best, the recognition accuracy of the original data reaches 92.15%, and the recognition accuracy after PCA processing is further improved to 97.56%. The modeling time of the original data of this paper's improved model without preprocessing is only 0.0003s, and after the original data dimensionality reduction by this paper's preprocessing method, the modeling time is reduced by 30% to 0.00021s, which illustrates that the tobacco adulteration recognition scheme combining the PCA preprocessing method and the improved CNN model of this paper has the best performance in terms of both accuracy and efficiency.
The KNN model, RF model and the improved CNN model in this paper all achieve better recognition results in tobacco adulteration origin recognition, and the recognition accuracy of the three models is higher than that of manual recognition, in which the improved model in this paper performs particularly well, with the recognition accuracy, precision, and recall reaching 98.28%, 98.87%, and 98.94%, respectively, and the F1 value is 97.88%. It proves the superior effect of the improved CNN model network structure in this paper. It can play the best performance in the problem of tobacco adulteration origin recognition, distinguishing the tobacco with different quality from different origins, and contributing to the research of tobacco adulteration recognition.
China Tobacco Hebei Industrial Co., LTD., intelligent research and application technology project of finished tobacco purity based on hyperspectral technology (HBZY2023A084).