Application of high-precision three-dimensional mapping technology in urban housing structural safety inspection
oraz
17 mar 2025

O artykule
Data publikacji: 17 mar 2025
Otrzymano: 09 paź 2024
Przyjęty: 04 lut 2025
DOI: https://doi.org/10.2478/amns-2025-0174
Słowa kluczowe
© 2025 Peijie Yu et al., published by Sciendo
This work is licensed under the Creative Commons Attribution 4.0 International License.
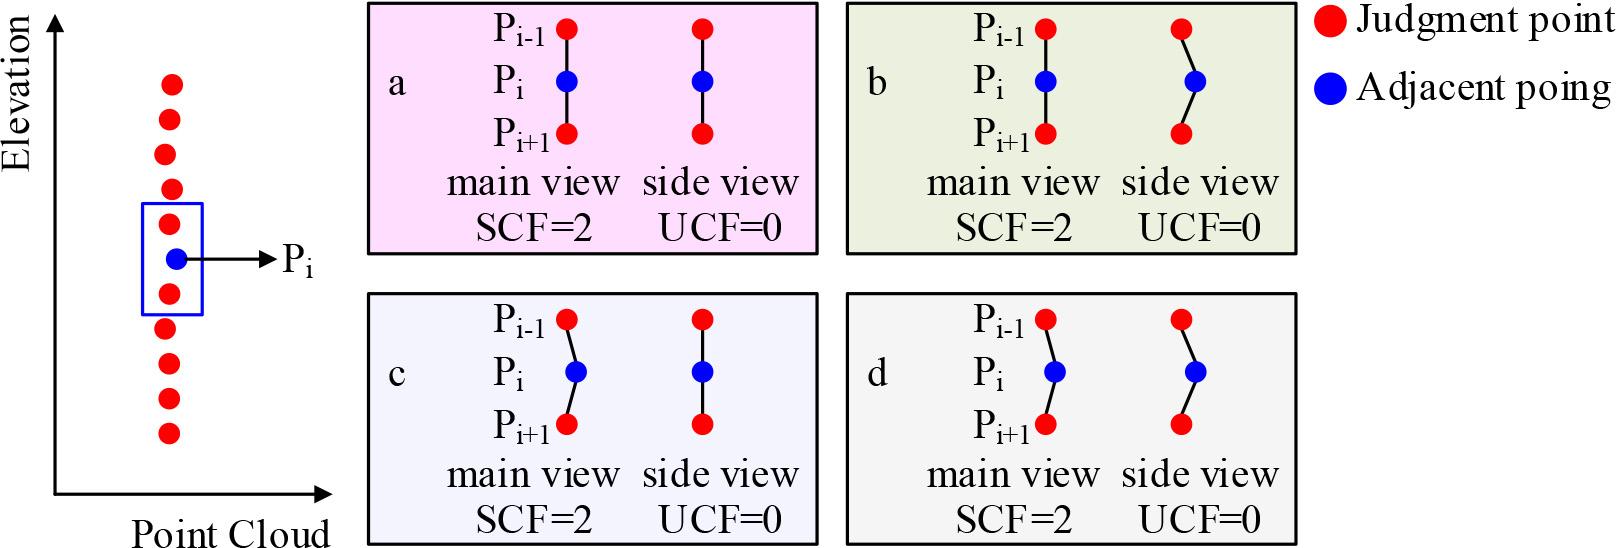
Figure 1.
Test data
| Sedimentation detection data(mm) | ||||||||||
|---|---|---|---|---|---|---|---|---|---|---|
| 2023.5.15 | 2023.5.16 | 2023.5.17 | 2023.5.18 | 2023.5.19 | ||||||
| 8:00 | 16:00 | 8:00 | 16:00 | 8:00 | 16:00 | 8:00 | 16:00 | 8:00 | 16:00 | |
| Varying quantity | 4.158 | 3.512 | 4.186 | 3.285 | 4.082 | 3.188 | 4.285 | 3.282 | ||
| Varying quantity | Tilt detection data(°) | |||||||||
| 2023.5.15 | 2023.5.16 | 2023.5.17 | 2023.5.18 | 2023.5.19 | ||||||
| 8:00 | 16:00 | 8:00 | 16:00 | 8:00 | 16:00 | 8:00 | 16:00 | 8:00 | 16:00 | |
| X | -1.285 | -1.562 | -1.065 | -1.156 | -1.089 | -1.087 | -1.048 | -1.096 | -1.152 | -1.065 |
| Y | -0.789 | -0.758 | -0.768 | -0.685 | -0.728 | -0.625 | -0.526 | -0.725 | -0.755 | -0.526 |
| Z | 88.485 | 88.685 | 88.957 | 88.964 | 88.765 | 88.756 | 88.966 | 88.755 | 88.645 | 88.845 |
| Varying quantity | Horizontal displacement detection data(mm) | |||||||||
| 2023.5.15 | 2023.5.16 | 2023.5.17 | 2023.5.18 | 2023.5.19 | ||||||
| 8:00 | 16:00 | 8:00 | 16:00 | 8:00 | 16:00 | 8:00 | 16:00 | 8:00 | 16:00 | |
| X | 1.758 | 2.162 | 2.218 | 3.948 | 3.942 | 1.925 | 1.826 | 1.822 | 1.826 | 1.526 |
| Y | -3.865 | -4.263 | -4.531 | -3.156 | -3.815 | -4.328 | -3.255 | -4.458 | -3.157 | -3.128 |
| Two dimensional displacement length | 4.125 | 4.684 | 5.035 | 3.655 | 4.728 | 4.062 | 5.063 | 3.566 | 4.053 | |
Additional sedimentation of each sedimentation column after modification of modulus
| E*104MPA | Column 1-A | Column 1-D | Column 5-A | Column 5-D | Column 9-A | Column 14-A | Column 14-D |
|---|---|---|---|---|---|---|---|
| 2.8 | |||||||
| 3 | 24.515 | 27.534 | 28.015 | 32.175 | 33.145 | 27.215 | 31.948 |
| 3.15 | 24.562 | 27.523 | 28.063 | 32.139 | 33.125 | 27.305 | 31.974 |
| 3.25 | 24.589 | 27.585 | 28.089 | 32.135 | 33.147 | 27.396 | 31.915 |
| E*104MPA | Column 2-A | Column 2-B | Column 2-C | Column 2-D | Column 3-A | Column 3-B | Column 3-C |
| 2.8 | 25.052 | 26.875 | 27.245 | 27.859 | 25.688 | 26.895 | 27.918 |
| 3 | 25.036 | 26.615 | 27.268 | 27.915 | 25.684 | 26.947 | 27.936 |
| 3.15 | 25.048 | 26.588 | 27.687 | 27.951 | 25.688 | 26.974 | 27.927 |
| 3.25 | 25.054 | 26.856 | 27.456 | 27.956 | 25.614 | 26.974 | 27.936 |
| E*104MPA | Column 1-A | Column 1-D | Column 5-A | Column 5-D | Column 9-A | Column 14-A | Column 14-D |
| 2.8 | 24.598 | 27.458 | 28.096 | 32.148 | 33.168 | 27.896 | 31.785 |
| 3 | 24.566 | 27.966 | 28.156 | 32.138 | 33.184 | 27.596 | 31.998 |
| 3.15 | 24.515 | 27.628 | 28.104 | 32.185 | 33.125 | 27.398 | 31.248 |
| 3.25 | 24.578 | 27.885 | 28.196 | 32.145 | 33.169 | 27.398 | 31.958 |
| E*104MPA | Column 1-A | Column 1-D | Column 5-A | Column 5-D | Column 9-A | Column 14-A | Column 14-D |
| 2.8 | 24.597 | 27.612 | 28.485 | 32.175 | 33.184 | 27.652 | 32.087 |
| 3 | 24.605 | 27.614 | 28.996 | 32.148 | 33.148 | 27.518 | 32.007 |
| 3.15 | 24.633 | 27.628 | 28.154 | 32.336 | 33.195 | 27.369 | 32.065 |
| 3.25 | 24.604 | 27.988 | 28.745 | 32.174 | 33.178 | 27.965 | 32.014 |
Housing structure test results
| Member | Conversion value of masonry mortar resistance(MPa) | Conversion value of brick resistance(MPa) | |||
|---|---|---|---|---|---|
| Name | Axis number | ||||
| Ground wall | 6~7/B | ||||
| 4/B~C | 4.325 | ||||
| Two-story wall | 1~2/A | 4.525 | 7.829 | ||
| 3~4/B | 3.974 | 8.156 | |||
| 7~8/B | 7.596 | ||||
| Member | Concrete anti-pressure conversion value(MPa) | The value of the strength of the cloud coagulation soil in the present age(MPa) | |||
| Name | Axis number | Mean value | Standard deviation | Minimum value | |
| Top beam | 8/B~C | 28.287 | 2.375 | 24.915 | 24.596 |
| 6/A~B | 28.653 | 1.818 | 25.631 | 25.485 | |
| Second floor top beam | 3/B~C | 29.185 | 2.569 | 26.278 | 25.385 |
| 3/A~B | 29.675 | 1.975 | 27.168 | ||
| 8/B~C | 29.169 | 3.278 | 27.294 | ||
| Test floor | Axis number | Measured beam base number | The measured band is the average spacing(mm) | The measured cross section width×height(mm) | |
| A top beam | 8/B~C | 4 root | Full section:205 | 254×505 | |
| 6/A~B | 5 root | Full section:215 | 253×207 | ||
| 5~6/B | 4 root | Full section:208 | 257×204 | ||
| Two-story roof beam | 3/B~C | 3 root | Full section:204 | 257×536 | |
| 3/A~B | 2 root | Full section:210 | 254×206 | ||
| Member | Average spacing of bar | ||||
| Name | Axis number | Steel direction | Measured measurement (mm) | Steel direction | Measured measurement(mm) |
| Top plate | 7~8/B~C | 7↔9 | B↔C | 187 | |
| 6~7/A~B | 5↔6 | A↔B | 235 | ||
| Two deck roof | 9~10/A~C | 8↔10 | 149 | A↔C | 157 |
| 3~4/B~C | 4↔5 | 164 | B↔C | 198 | |
Measurement of concrete strength of urban housing
| Floor | Build Type | Constructive strength(Mpa) | Design strength(Mpa) | Rebound value/design value |
|---|---|---|---|---|
| Sublayer | Floor Slab | 30.345 | 30 | 1.185 |
| Wall | 36.585 | 30 | 1.285 | |
| Underground Layer | Floor Slab | 32.748 | 30 | 1.093 |
| Wall | 38.128 | 30 | 1.275 | |
| Layer | Floor Slab | 24.374 | 27 | 0.925 |
| Wall | 28.945 | 30 | 0.948 | |
| Second Layer | Floor Slab | 24.348 | 26 | 0.972 |
| Wall | 29.348 | 25 | 0.974 | |
| Three-Ply | Floor Slab | 27.845 | 25 | 1.156 |
| Wall | 28.148 | 24 | 1.136 | |
| Four-Ply | Floor Slab | 24.263 | 26 | 0.948 |
| Wall | 24.317 | 25 | 0.978 | |
| Pentinterval | Floor Slab | 28.183 | 25 | 1.132 |
| Wall | 24.425 | 26 | 0.925 | |
| Sexosphere | Floor Slab | 24.382 | 25 | 0.985 |
| Wall | 24.874 | 26 | 0.974 | |
| Heptad | Floor Slab | 25.365 | 25 | 1.088 |
| Wall | 29.348 | 25 | 1.148 | |
| Octal Layer | Floor Slab | 25.558 | 25 | 1.054 |
| Wall | 28.533 | 26 | 1.154 | |
| Nine Floors | Floor Slab | 24.728 | 25 | 0.948 |
| Wall | 28.348 | 25 | 1.184 | |
| Decida | Floor Slab | 24.918 | 26 | 0.978 |
| Wall | 28.365 | 25 | 1.126 | |
| Ten Layers | Floor Slab | 30.482 | 25 | 1.254 |
| Wall | 28.485 | 26 | 1.156 |
Statistical result
| Precision index | Δ |
Δ |
Δ |
Δ |
Δ |
|
|---|---|---|---|---|---|---|
| Model measurement | Measurement point 1 | 29.458 | 30.548 | 66.158 | 9.085 | 11.758 |
| Measurement point 2 | 28.456 | 33.415 | 71.585 | 12.267 | 12.248 | |
| Measurement point 3 | 34.598 | 31.578 | 69.288 | 13.485 | 14.925 | |
| External measurement | Measurement point 1 | 30.278 | 30.524 | 70.488 | 9.158 | 9.514 |
| Measurement point 2 | 29.578 | 30.248 | 67.285 | 8.328 | 13.537 | |
| Measurement point 3 | 29.178 | 30.297 | 68.274 | 10.595 | 11.918 | |
| Maximum error | 4.258 | -3.275 | 3.718 | 4.812 | 5.418 | |
| Minimum error | 0.785 | 2.258 | ||||
| Middle error | 2.587 | 2.185 | 1.617 | 3.158 | 3.245 | |