Health Management Strategies for Medical Health Records Incorporating Graph Theory Methods
oraz
17 mar 2025

O artykule
Data publikacji: 17 mar 2025
Otrzymano: 29 paź 2024
Przyjęty: 13 lut 2025
DOI: https://doi.org/10.2478/amns-2025-0166
Słowa kluczowe
© 2025 Yanjie Wang et al., published by Sciendo
This work is licensed under the Creative Commons Attribution 4.0 International License.
Figure 1.
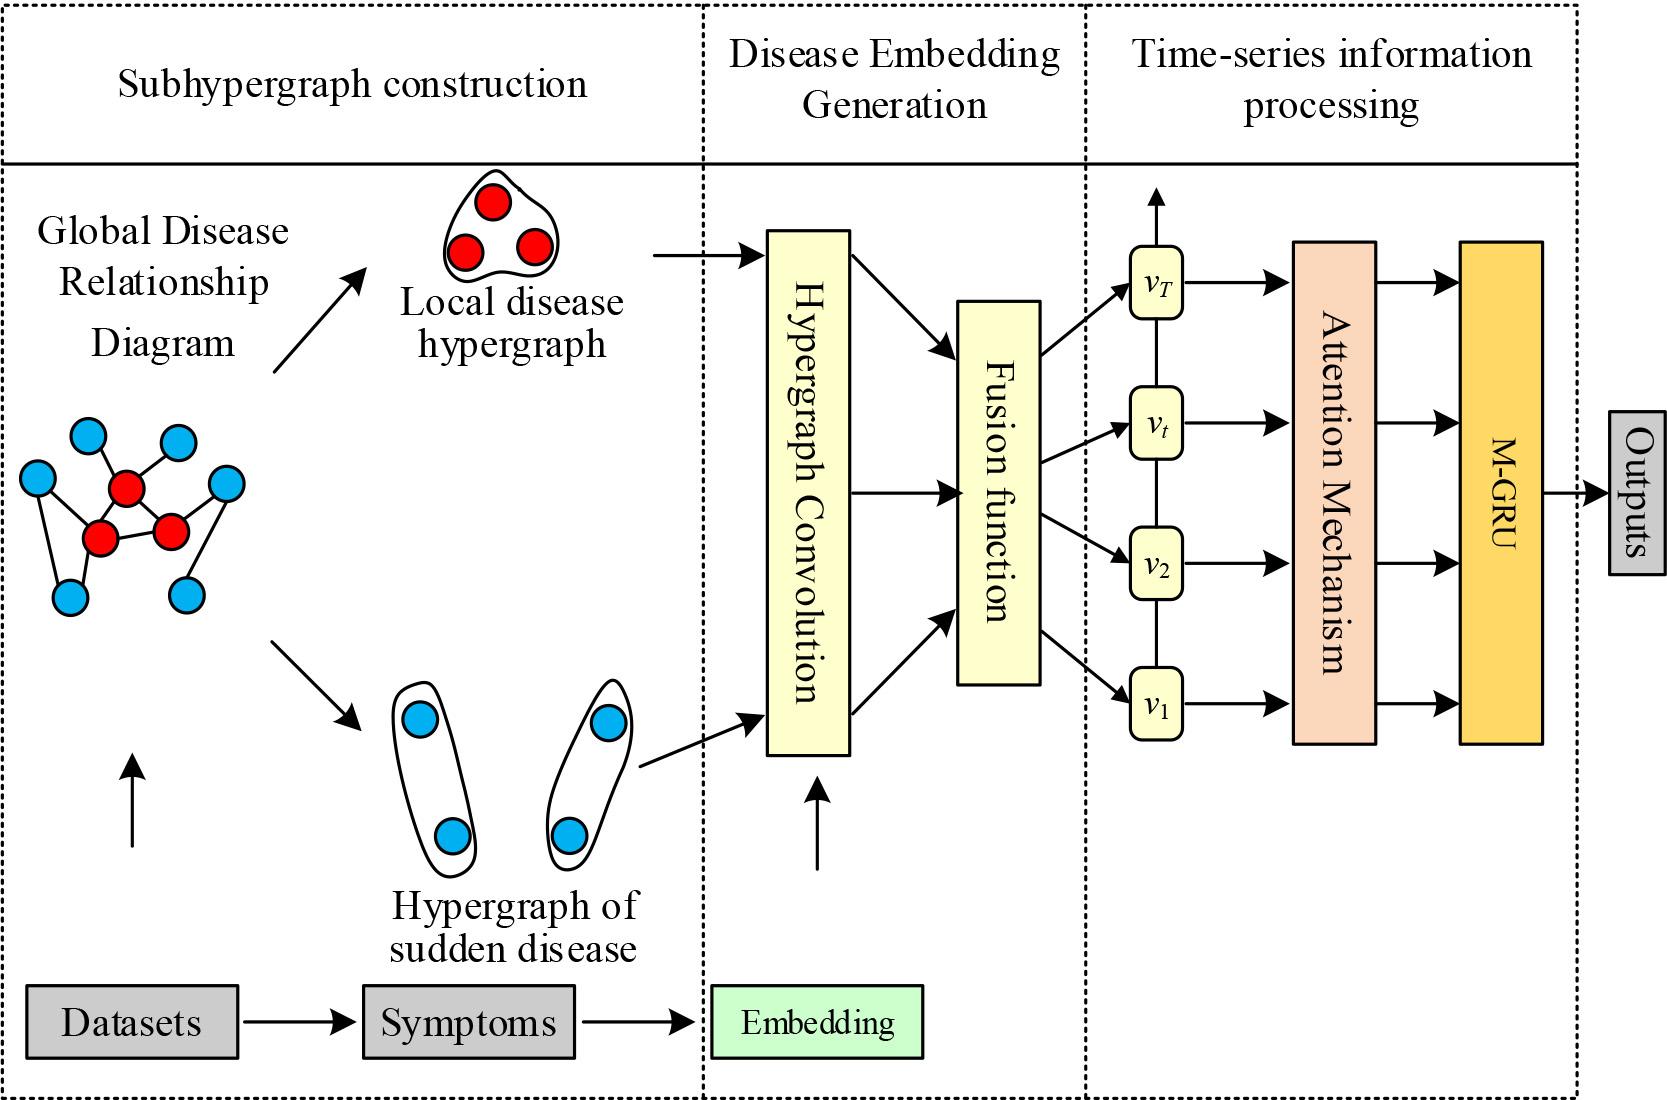
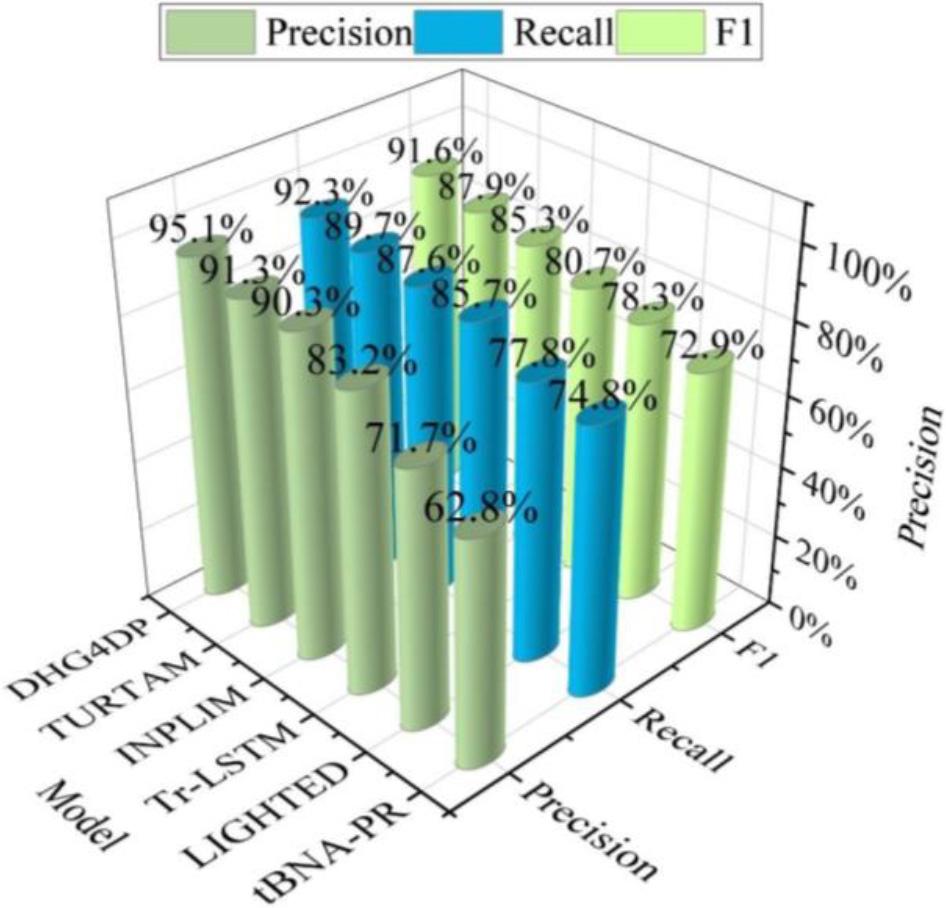
Figure 2.
Comparison of health knowledge scores of medical staff
| Group | N | B1 | B2 | B3 | |||
| M | SD | M | SD | M | SD | ||
| Control group | 180 | 55.36 | 5.36 | 61.33 | 5.85 | 59.63 | 5.77 |
| Observation group | 180 | 86.35 | 8.32 | 88.64 | 8.01 | 86.47 | 8.36 |
| t | - | 10.635 | 11.587 | 9.658 | |||
| P | - | 0.000 | 0.000 | 0.000 | |||
The incidence of emergency health events was compared
| Group | N | C1 | C2 | C3 | C4 | A5 | Total incidence |
| Control group | 1050 | 25 | 9 | 10 | 4 | 4 | 52(4.95%) |
| Observation group | 1050 | 9 | 7 | 4 | 0 | 0 | 20(1.9%) |
| c2 | - | - | - | - | - | - | 6.358 |
| P | - | - | - | - | - | - | 0.016 |
Survey data
| Data | Group | N | M | SD | t/c2 | P | |
| Gender | Female | Observation group | 71 | - | - | 0.0311 | 0.7896 |
| Male | 109 | - | - | ||||
| Female | Control group | 69 | - | - | |||
| Male | 111 | - | - | ||||
| Age | Observation group | 180 | 32.51 | 8.22 | 0.8724 | 0.4116 | |
| Control group | 180 | 33.53 | 8.01 | ||||
| Patient gender | Female | Observation group | 506 | - | - | 0.2468 | 0.6236 |
| Male | 544 | - | - | ||||
| Female | Control group | 495 | - | - | |||
| Male | 555 | - | - | ||||
| Patient age | Observation group | 1050 | 51.33 | 12.63 | 0.7365 | 0.4635 | |
| Control group | 1050 | 53.41 | 13.11 | ||||
MIMIC-III data set information
| Statistical Items | Quantity |
| Diagnoses | 1863 |
| Treatment procedures | 1365 |
| Patients | 5596 |
| Dictionary size of text data | 64352 |
| Average of diagnoses | 12.8 |
| Average of treatment procedures | 4.33 |
| Average word of per visit | 2234 |
Hospital health management performance ratings
| Group | N | A1 | A2 | A3 | A4 | A5 | |||||
| M | SD | M | SD | M | SD | M | SD | M | SD | ||
| Control group | 180 | 6.23 | 1.24 | 6.54 | 0.98 | 6.85 | 0.78 | 6.89 | 1.11 | 6.74 | 1.07 |
| Observation group | 180 | 9.47 | 0.33 | 9.51 | 0.16 | 9.44 | 0.24 | 9.66 | 0.32 | 9.55 | 0.29 |
| t | - | 4.485 | 2.364 | 4.514 | 4.189 | 3.367 | |||||
| P | - | 0.003 | 0.004 | 0.001 | 0.003 | 0.000 | |||||