Analysis of the Operation Mechanism of Rural Governance and the Realisation Path of Participatory Governance Based on Calculus Theory
17 mar 2025

O artykule
Data publikacji: 17 mar 2025
Otrzymano: 04 lis 2024
Przyjęty: 16 lut 2025
DOI: https://doi.org/10.2478/amns-2025-0155
Słowa kluczowe
© 2025 Hua Zhao, published by Sciendo
This work is licensed under the Creative Commons Attribution 4.0 International License.
Figure 1.
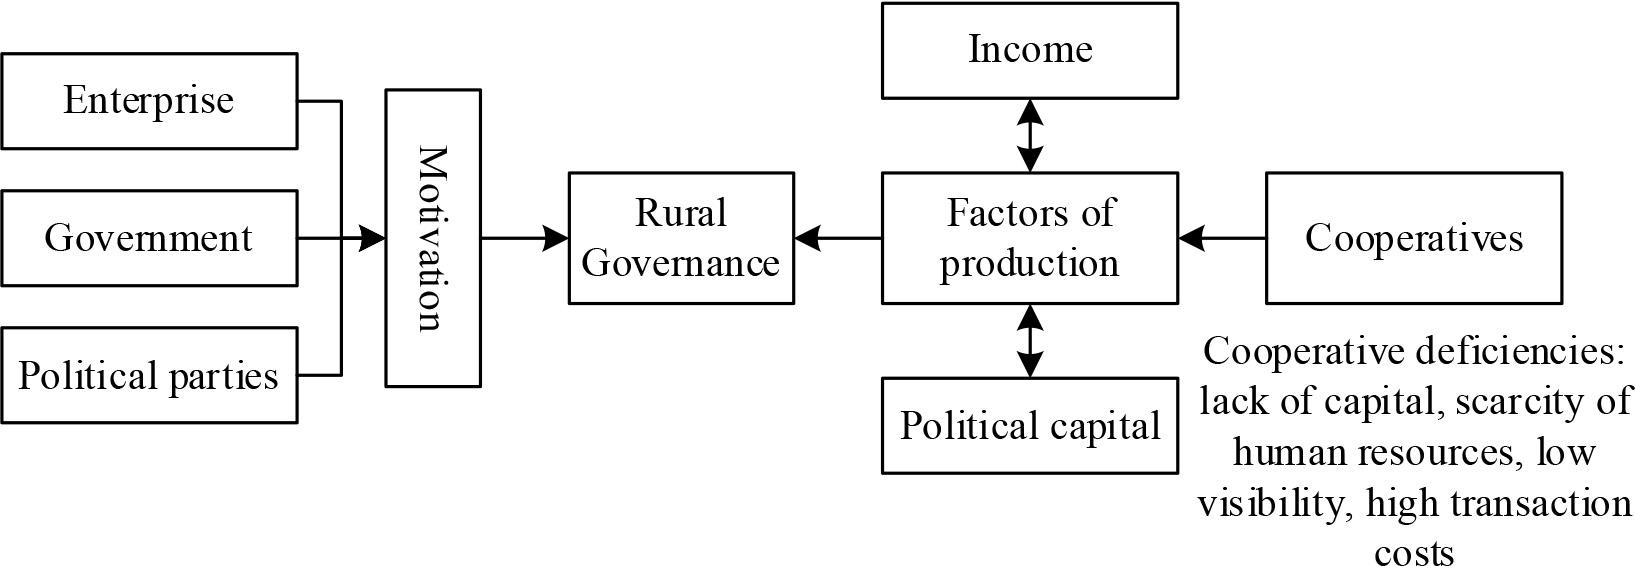
Figure 2.
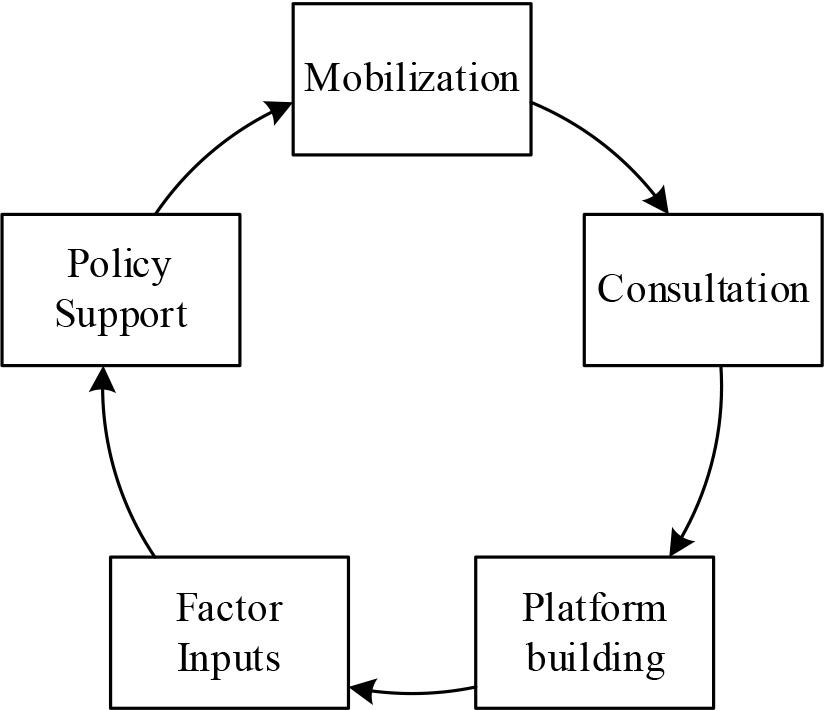
Figure 3.
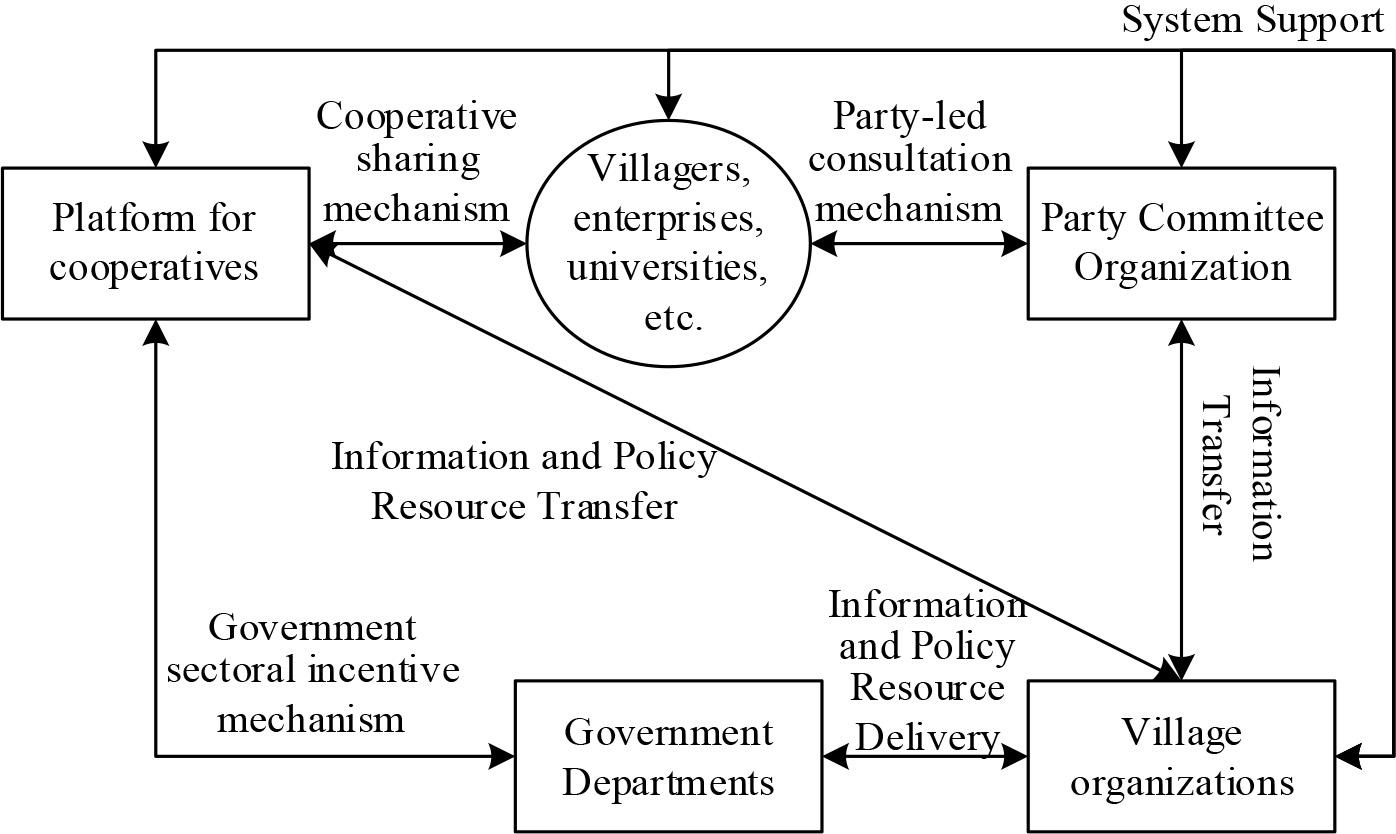
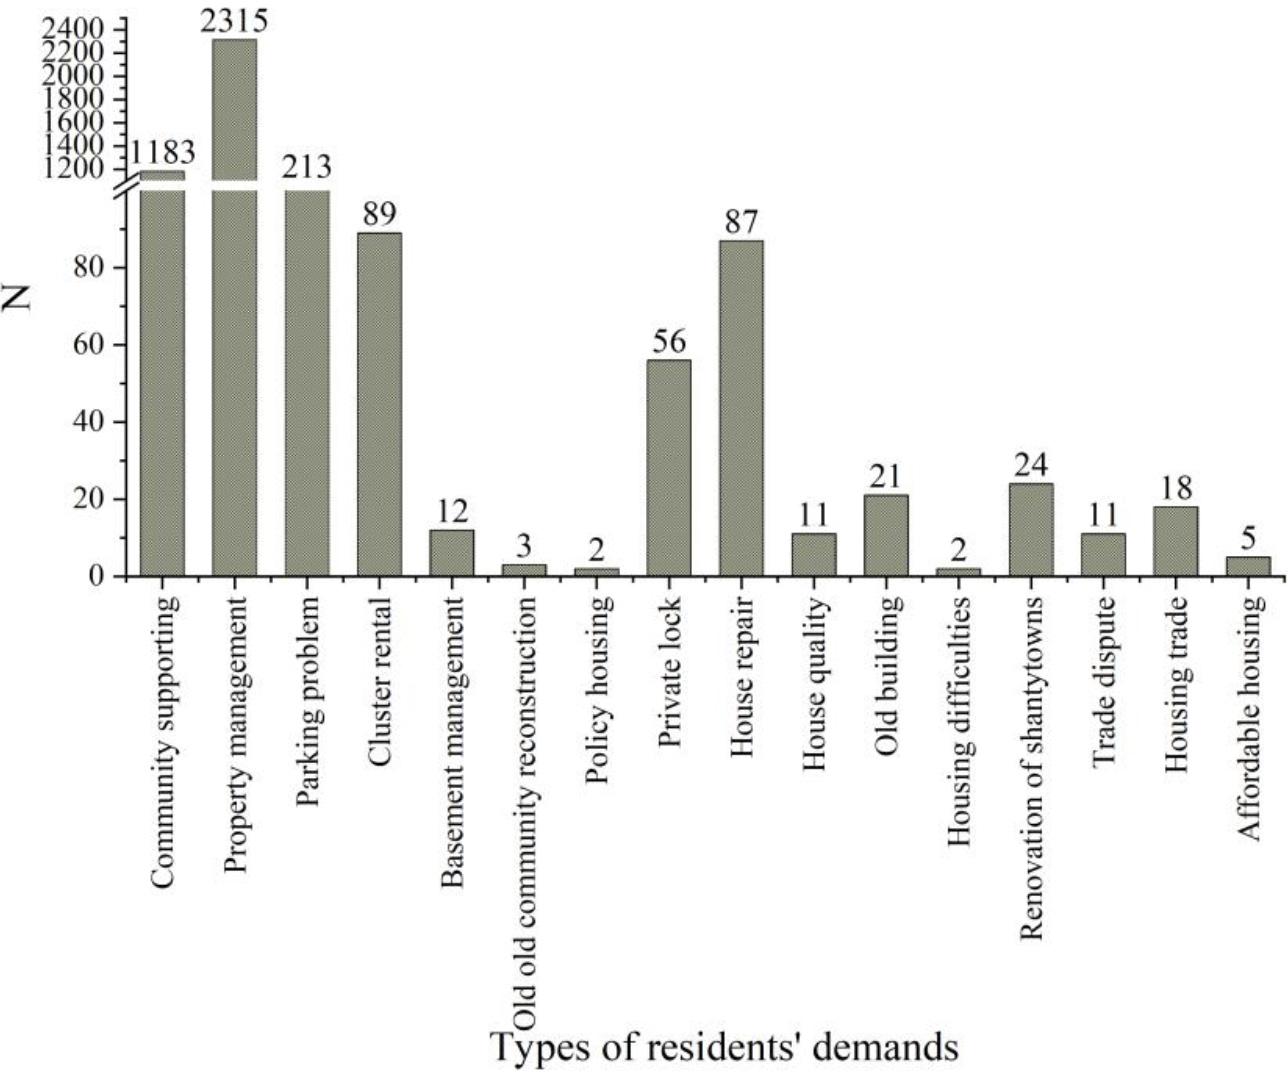
Figure 4.

Figure 5.
Income data of the study sample (unit: Yuan)
| ID | Take part | Economic income | ID | Take part | Economic income | ||||
|---|---|---|---|---|---|---|---|---|---|
| 2021 | 2022 | 2023 | 2021 | 2022 | 2023 | ||||
| 1 | 1 | 3100 | 4400 | 3800 | 41 | 0 | 3700 | 2900 | 3800 |
| 2 | 1 | 4500 | 3800 | 4300 | 42 | 0 | 2600 | 3400 | 4000 |
| 3 | 1 | 4200 | 4400 | 4700 | 43 | 0 | 3000 | 2800 | 2800 |
| 4 | 1 | 4200 | 3500 | 4000 | 44 | 0 | 2900 | 3500 | 3600 |
| 5 | 1 | 3500 | 3900 | 3500 | 45 | 0 | 2700 | 3600 | 2900 |
| 6 | 1 | 3800 | 4400 | 4600 | 46 | 0 | 3700 | 3500 | 3700 |
| 7 | 1 | 3500 | 3300 | 3500 | 47 | 0 | 3900 | 3300 | 3200 |
| 8 | 1 | 3600 | 4200 | 4200 | 48 | 0 | 2500 | 3700 | 4000 |
| 9 | 1 | 3200 | 3500 | 4100 | 49 | 0 | 2900 | 3400 | 3200 |
| 10 | 1 | 3400 | 4000 | 3500 | 50 | 0 | 2500 | 2800 | 3600 |
| 11 | 1 | 4200 | 3900 | 3500 | 51 | 0 | 3400 | 2800 | 3400 |
| 12 | 1 | 3500 | 3500 | 4500 | 52 | 0 | 3500 | 3400 | 3700 |
| 13 | 1 | 3600 | 3300 | 4600 | 53 | 0 | 2700 | 3600 | 3600 |
| 14 | 1 | 3400 | 3600 | 4100 | 54 | 0 | 3600 | 3400 | 3800 |
| 15 | 1 | 4100 | 3500 | 4800 | 55 | 0 | 2800 | 3600 | 3900 |
| 16 | 1 | 3900 | 4000 | 3700 | 56 | 0 | 2900 | 3300 | 4000 |
| 17 | 1 | 4100 | 3300 | 3800 | 57 | 0 | 4000 | 2900 | 3600 |
| 18 | 1 | 4400 | 3800 | 4800 | 58 | 0 | 2900 | 3100 | 3100 |
| 19 | 1 | 3500 | 3500 | 4200 | 59 | 0 | 4000 | 3000 | 4000 |
| 20 | 1 | 3300 | 3500 | 4500 | 60 | 0 | 3700 | 2800 | 3900 |
| 21 | 1 | 3900 | 4300 | 4800 | 61 | 0 | 4000 | 3500 | 2900 |
| 22 | 1 | 4400 | 4200 | 3800 | 62 | 0 | 3300 | 3200 | 3400 |
| 23 | 1 | 3500 | 4400 | 4000 | 63 | 0 | 4000 | 3300 | 3300 |
| 24 | 1 | 3200 | 3900 | 4200 | 64 | 0 | 3000 | 3600 | 3100 |
| 25 | 1 | 4100 | 4000 | 4300 | 65 | 0 | 2800 | 2800 | 3600 |
| 26 | 1 | 4300 | 4300 | 3500 | 66 | 0 | 3500 | 3300 | 3400 |
| 27 | 1 | 3800 | 4200 | 4300 | 67 | 0 | 3500 | 3700 | 3400 |
| 28 | 1 | 4100 | 4500 | 3700 | 68 | 0 | 3100 | 3100 | 4000 |
| 29 | 1 | 3700 | 3400 | 3700 | 69 | 0 | 2600 | 3100 | 3800 |
| 30 | 1 | 3300 | 4200 | 4200 | 70 | 0 | 2900 | 3200 | 3100 |
| 31 | 1 | 3200 | 3400 | 3500 | 71 | 0 | 3200 | 3300 | 3700 |
| 32 | 1 | 4300 | 3600 | 4500 | 72 | 0 | 3600 | 2900 | 2800 |
| 33 | 1 | 3000 | 4300 | 3700 | 73 | 0 | 3400 | 3800 | 3700 |
| 34 | 1 | 4400 | 3600 | 3800 | 74 | 0 | 3300 | 2800 | 2900 |
| 35 | 1 | 3600 | 4200 | 3500 | 75 | 0 | 3600 | 3000 | 4000 |
| 36 | 1 | 3600 | 4500 | 4300 | 76 | 0 | 2600 | 2900 | 3700 |
| 37 | 1 | 3900 | 4400 | 4100 | 77 | 0 | 3300 | 3500 | 2800 |
| 38 | 1 | 4500 | 4100 | 4500 | 78 | 0 | 3100 | 2800 | 3400 |
| 39 | 1 | 3800 | 3600 | 4600 | 79 | 0 | 2500 | 2900 | 4000 |
| 40 | 1 | 4000 | 3300 | 3900 | 80 | 0 | 3100 | 3400 | 3200 |
Choose whether to join the NPCE organization’s income statistics description
| Economic year | Sample size | Mean value | Std. Deviation | 95% confidence interval about the mean | ||
|---|---|---|---|---|---|---|
| Lower bound | Upper bound | |||||
| 2021 | 0 | 40 | 3207.5 | 496.19 | 3535.24 | 4535.77 |
| 1 | 40 | 3790 | 757.06 | 4935.21 | 5436.51 | |
| Totality | 80 | 3498.75 | 472.75 | 4224.52 | 4586.91 | |
| 2022 | 0 | 40 | 3222.5 | 551.62 | 2865.32 | 3145.06 |
| 1 | 40 | 3892.5 | 382.78 | 3515.16 | 5782.33 | |
| Totality | 80 | 3557.5 | 724.35 | 3206.24 | 5441.82 | |
| 2023 | 0 | 40 | 3500 | 560.88 | 2243.42 | 4536.52 |
| 1 | 40 | 4090 | 757.73 | 3015.58 | 6863.73 | |
| Totality | 80 | 3795 | 573.45 | 2678.33 | 3583.51 | |
Descriptive statistics of village level governance index
| Dimensionality | Mean | Coefficient of variation | Maximum | Minimum |
|---|---|---|---|---|
| Village level comprehensive management level | 0.638 | 0.138 | 0.805 | 0.422 |
| Economic development and industrial integration level | 0.492 | 0.391 | 0.856 | 0.031 |
| Democracy construction and organizational mobilization level | 0.534 | 0.277 | 0.897 | 0.155 |
| Infrastructure and public service level | 0.827 | 0.138 | 0.979 | 0.354 |
| Social stability and village order level | 0.705 | 0.097 | 0.988 | 0.423 |
Single Factor Analysis Results
| year | Error | Total sum of squares | Degree of freedom | Average sum of squares | F | Sig. |
|---|---|---|---|---|---|---|
| 2023 | Inter-group error | 3.952E7 | 1 | 3.952E7 | 306.838 | 0.0000 |
| Intra-group error | 1.058E7 | 78 | 131862.2 | |||
| Total error | 5.055E7 | 79 | ||||
| 2022 | Inter-group error | 1.775E8 | 1 | 1.775E8 | 5.338 | 0.0218 |
| Intra-group error | 2.636E9 | 78 | 3.312E7 | |||
| Total error | 2.837 E9 | 79 | ||||
| 2021 | Inter-group error | 1.105E7 | 1 | 1.105E7 | 69.243 | 0.000 |
| Intra-group error | 1.334E7 | 78 | 168843.4 | |||
| Total error | 2.468E7 | 79 |