Experimental investigation on the influence of scale effects on the permeability coefficient of coarse-grained soil

Data publikacji: 27 lut 2025
Otrzymano: 01 paź 2024
Przyjęty: 08 sty 2025
DOI: https://doi.org/10.2478/amns-2025-0150
Słowa kluczowe
© 2025 Yong Yang et al., published by Sciendo
This work is licensed under the Creative Commons Attribution 4.0 International License.
According to the latest guidance from the Ministry of Water Resources, the realization of Chinese- style modernization requires the establishment of a strong and modernized water conservancy support and guarantee system [1]. For this reason, China has accelerated the development of water projects. The earth-rock dam is one of the most widely used and rapidly developing dam types in global dam construction, characterized by high economic efficiency and fast construction progress. It can provide a strong guarantee for the development of China's energy and water conservancy projects [2-3]. As a superior fill material for earth-rock dams, coarse-grained soils are widely used in dam projects and artificial foundations. Coarse-grained soil exists as a loose accumulation of porous media, and its permeability characteristics are very important for the safety design of earth-rock dam projects. The permeability of a porous medium characterizes the ease of fluid flow in coarse-grained soils, and the coefficient of permeability is an important parameter describing the permeability properties of coarse-grained soils. Accurately grasping the coefficient of permeability of coarse-grained soils is the basis for an in-depth study of its permeability characteristics. It is conducive to the development of the dam zoning plan and engineering waterproof plan, with great significance to both theoretical research and engineering practice [4-6].
Current studies are mainly conducted to obtain the permeability coefficients by laboratory tests. Although test data are relatively easy to obtain, the limited size of the test instruments requires the original gradation in the field to be scaled to obtain a downsized specimen for testing. However, due to the change in pore size and connectivity between soil particles after scaling, the test results of scaled specimens often fail to accurately reflect the true condition of the original gradation, a phenomenon known as the scale effect [7-8]. Some studies argued that the root cause of the scale effect is the change in coarse-grained soil gradation [9-10]. Hence, it is essential to investigate the impact of the gradation of coarse-grained soil on its permeability coefficient and to formulate equations that depict their relationship. This will help elucidate and mitigate the influence of the scale effect on permeability characteristics.
To date, numerous scholars have conducted comprehensive research on the correlation between the characteristic parameters of coarse-grained soil gradation and permeability coefficient. The impact of particle gradation on the permeability coefficient of coarse-grained soils was determined by means of permeability experiments and other relevant methods. For example: Fu et al. [11] adopted the equivalent substitution method and the similar gradation method to study the reduction of the permeability coefficient of the same gradation curve in the field. The results showed that the permeability characteristics of the original gradation could not be truly reflected, i.e., the scale effect significantly influenced the determination of the permeability coefficient of coarse-grained soils. Chen et al. [12] conducted scaled permeability tests on gravel materials in the Dashixia dam. It was found that the permeability test results obtained for the downsized material would overestimate the drainage and penetration damage resistance of the original gradation. Based on this result, it was recommended that the permeability coefficient of gravel dam materials should be determined using the full gradation method. Zhu et al. [13] investigated the correlation between the inhomogeneity coefficient representing the particle gradation characteristics and the permeability coefficient. The results demonstrated a significant correlation between them. By performing orthogonal permeability test on coarse-grained soils. Wang et al. [14] found that the permeability coefficient increased with increasing characteristic parameter
In summary, the existing studies have investigated the impact of scale effect on the permeability coefficient by one or a few gradation parameters, making it difficult to completely reflect the gradation changes. As a result, characterizing the influence of the scale effect on the permeability coefficient became challenging. Moreover, the variation patterns of the permeability coefficients with gradation for coarse-grained soils after scaling are still insufficiently explained, remaining in the exploratory stage of in-depth qualitative research. In order to accurately study the influence of scale effect on the permeability coefficient of coarse-grained soils, 18 groups of coarse-grained soil specimens are designed by changing the gradation area
The test was conducted using a ST30-2A Vertical Penetrometer for coarse-grained soils, the test instrument and test process are shown in Figure 1. The equipment is mainly composed of three parts: specimen container, head manometer, and water tank. The water tank was mainly used to control the position of the head and adjust the head difference. The test container was of metal cylinder type, with a metal perforated, permeable plate and water outlet and overflow at the top and bottom of the container. The side of the specimen container was connected to a head manometer, and the central head manometer expressed the pressure mainly based on the height of the liquid column. Water inlets and overflows were provided at different heights on the sides to regulate and control the water level in the container. The permeation instrument allowed for the head permeation pressure to be set in the range of 0 to 50 kPa. This equipment could determine the vertical permeability coefficient of seepage water as it passed through a coarse-grained soil specimen, as well as the critical slope drop when fine particles were gradually lost with the seepage water (pipe surge) and the destructive slope drop when the soil was uplifted (runoff soil). The maximum applicable particle diameter was 60 mm, and the relative size of the test specimen is Φ300×300 mm for coarse-grained soils.
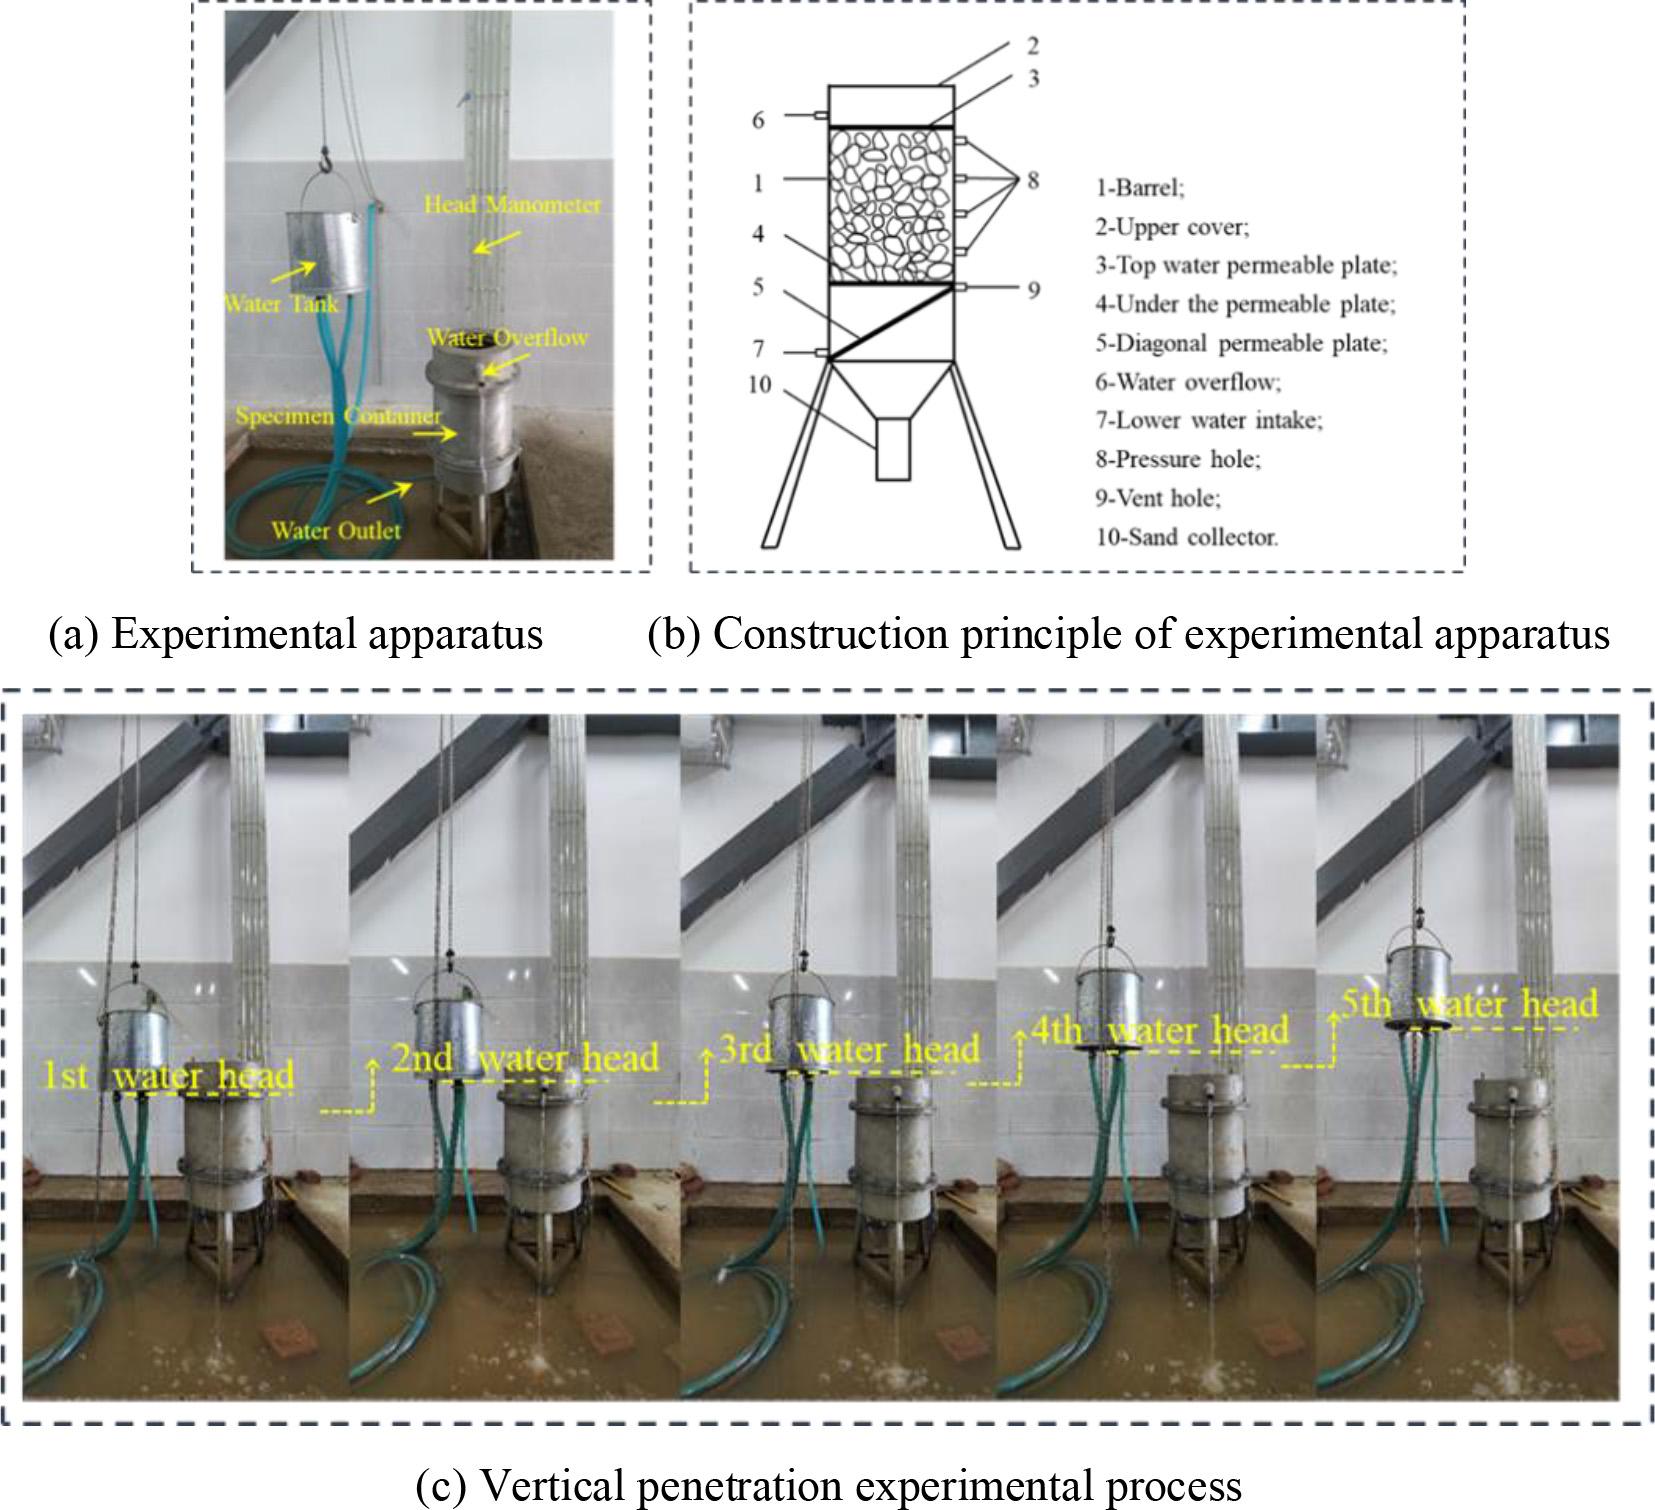
ST30-2A large-scale vertical infiltration apparatus for coarse-grained soil and test process
The test material was selected from the rockfill materials for the dam construction of Lincangdaqiaopo Reservoir in Yunnan Province. This material is artificially blasted and crushed rock with weakly weathered granite as its parent rock. The rock possesses an average saturated uniaxial compressive strength of 50 MPa, a softening coefficient of 0.79, and a specific gravity of 2.70.The specimens with original gradations were subjected to particle sieving using a vibratory sieving machine, and groups of specimens with diameters of 60 to 40 mm, 40 to 20 mm, 20 to 10 mm, 10 to 5 mm, 5 to 2 mm, 2 to 1 mm, 1 to 0.5 mm, and less than 2 mm were retained as specimen soils, as shown in Figure 2.
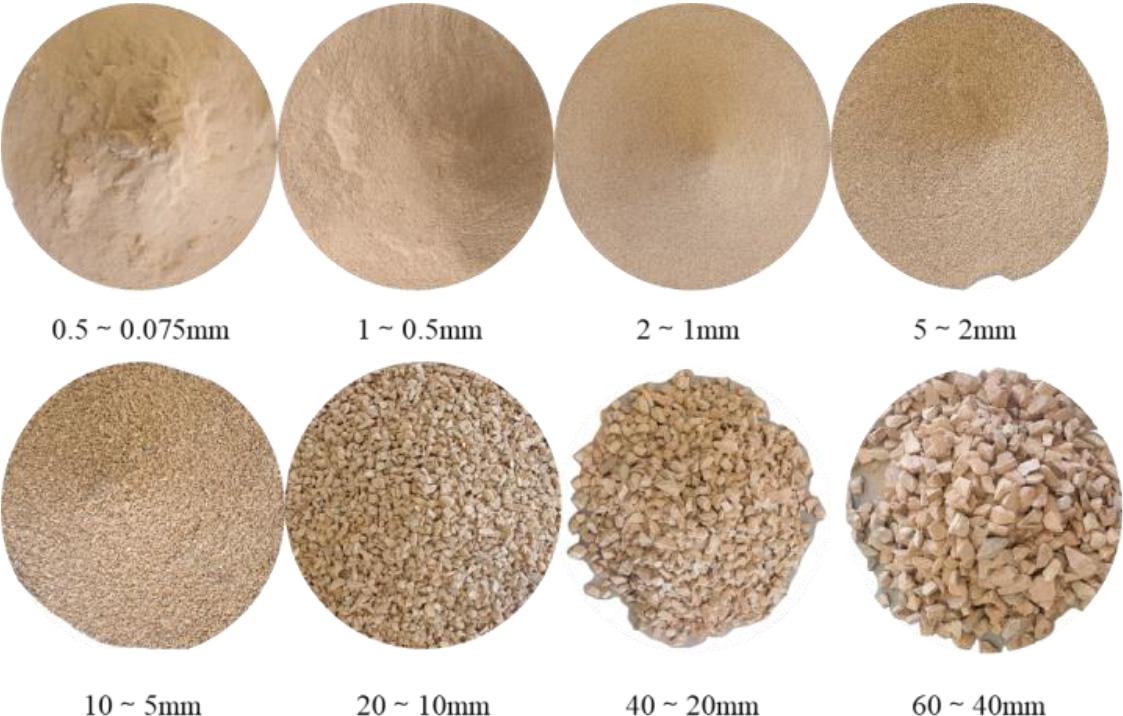
Grit and gravel of different grain size groups
In order to quantitatively analyze the effect of maximum grain size
According to the findings of Jiang et al. [21] on the scale effect, there are no obvious patterns between Gradation area diagram
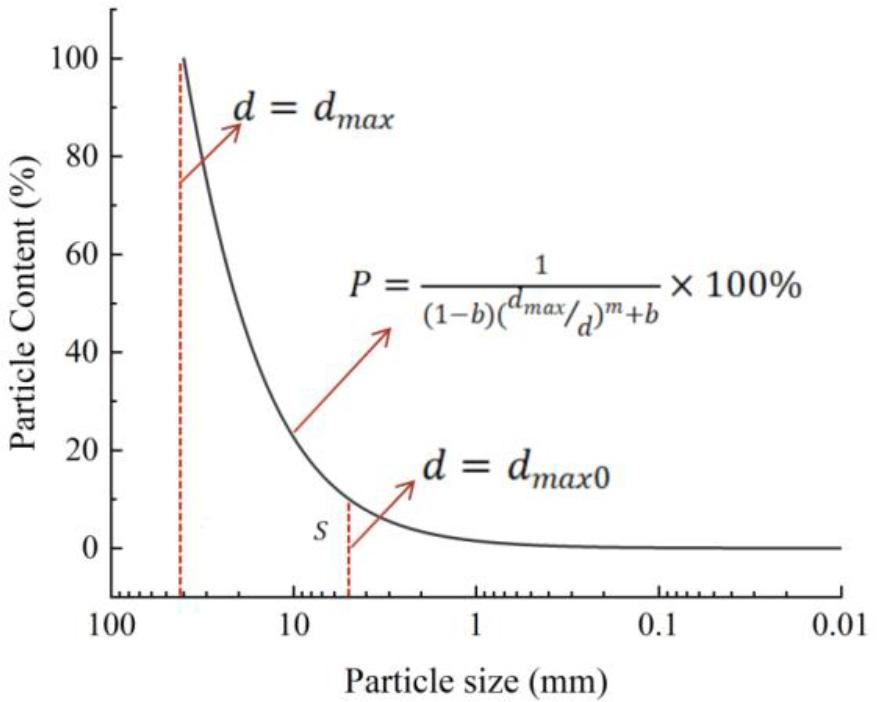
The
According to D. Gu et al. [22] and W. Guo et al. [23], the criterion for dividing gravel and sand is a particle diameter of 5 mm. Therefore, the minimum particle diameter
Grading parameters
| Test Number | Gradation Area |
Grading Parameters | ||
|---|---|---|---|---|
| 1 | 0.272 | 40 | 1.2 | -0.6 |
| 2 | 0.381 | 40 | 1.2 | 0.2 |
| 3 | 0.475 | 40 | 0.9 | 0.2 |
| 4 | 0.533 | 40 | 0.9 | 0.4 |
| 5 | 0.754 | 40 | 0.6 | 0.6 |
| 6 | 0.875 | 40 | 0.6 | 0.8 |
| 7 | 0.617 | 60 | 0.9 | 0.6 |
| 8 | 0.617 | 40 | 0.9 | 0.6 |
| 9 | 0.617 | 20 | 0.9 | 0.6 |
| 10 | 0.617 | 10 | 0.9 | 0.6 |
| 11 | 0.645 | 60 | 1.2 | 0.8 |
| 12 | 0.645 | 40 | 1.2 | 0.8 |
| 13 | 0.645 | 20 | 1.2 | 0.8 |
| 14 | 0.645 | 10 | 1.2 | 0.8 |
| 15 | 0.671 | 60 | 0.6 | 0.4 |
| 16 | 0.671 | 40 | 0.6 | 0.4 |
| 17 | 0.671 | 20 | 0.6 | 0.4 |
| 18 | 0.671 | 10 | 0.6 | 0.4 |
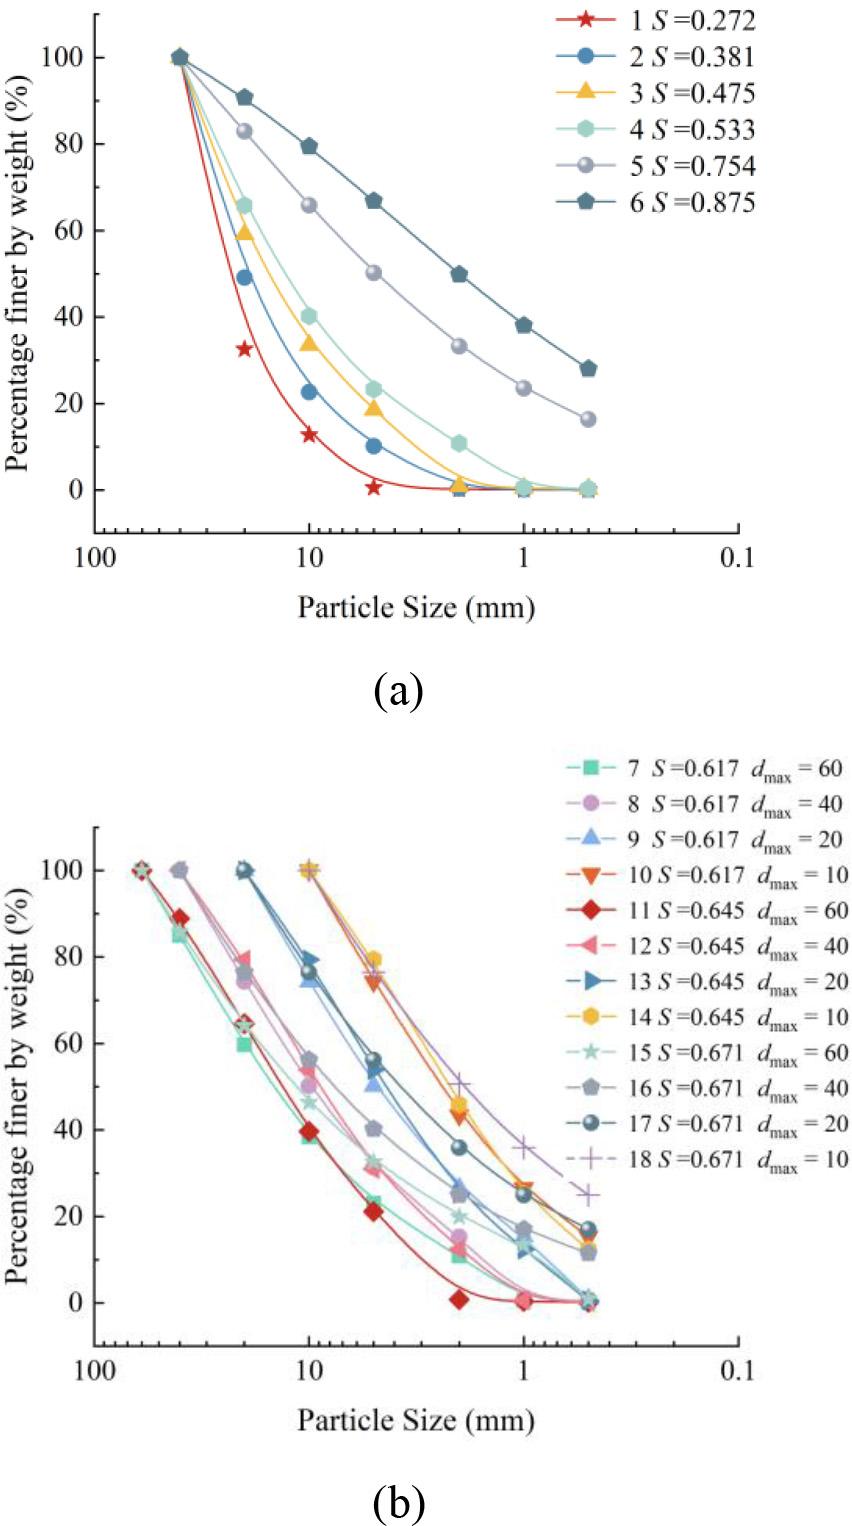
Sample gradation curve. (a) Area of different gradations
A constant head indoor test was performed to evaluate the permeability characteristics by applying a certain water head to the specimen. The permeation velocity was observed, and the permeability coefficient and other parameters were calculated. The particle size intervals were allocated according to the designed gradation curves and mixed homogeneously. The instrument was then checked for leaks at all piping connections. After confirming no water leakage, the specimens were loaded into the cylinder in layers. Each layer was 2 to 3 cm thick and was gently compacted to a certain thickness with a wooden hammer to control its porosity. Once the sample preparation was completed, the bolts were tightened, and the saturation was performed to ensure that the head difference was less than 2 cm until the water flowed continuously from the outlet pipe. The test was started after the saturation, and the water level in the pressure measuring tube was recorded after stabilization to obtain the difference between each pressure measuring tube.
With the change of water head height, the internal hydraulic slope of the coarse grained soil sample gradually increased, and the soil showed signs of permeability deformation to different degrees, as shown in Figure 5. As can be seen from the analysis in Fig.5, coarse-grained soil is composed of soil particles with different particle sizes filling each other. As the seepage hydraulic slope increases, the fine particles in the pores of the soil will be lost along with the seepage flow, resulting in seepage subsurface erosion deformation of the soil. Under the initial hydraulic gradient condition, the seepage flow continuously generates upward seepage along the pores of the soil and overflows the upper top surface of the soil. Since the fine particles in the pores cannot be carried away by the water flow, the overflow water is clear (Fig.5a). With the increase of hydraulic slope, the permeability in saturated soil also increases. Under the action of permeating water flow, fine particles in permeable unstable soil migrate, lose and redistribute in the pore channels of coarse particles, and lose fine particles on the upper surface of the soil, resulting in turbidity in the seepage water (Fig.5f). After the completion of the vertical penetration test, the upper top surface of the permeated soil sample was observed. Due to permeation-latent erosion, a large number of fine particles were permeated and deposited on the upper top surface of the soil sample (Fig.5j).
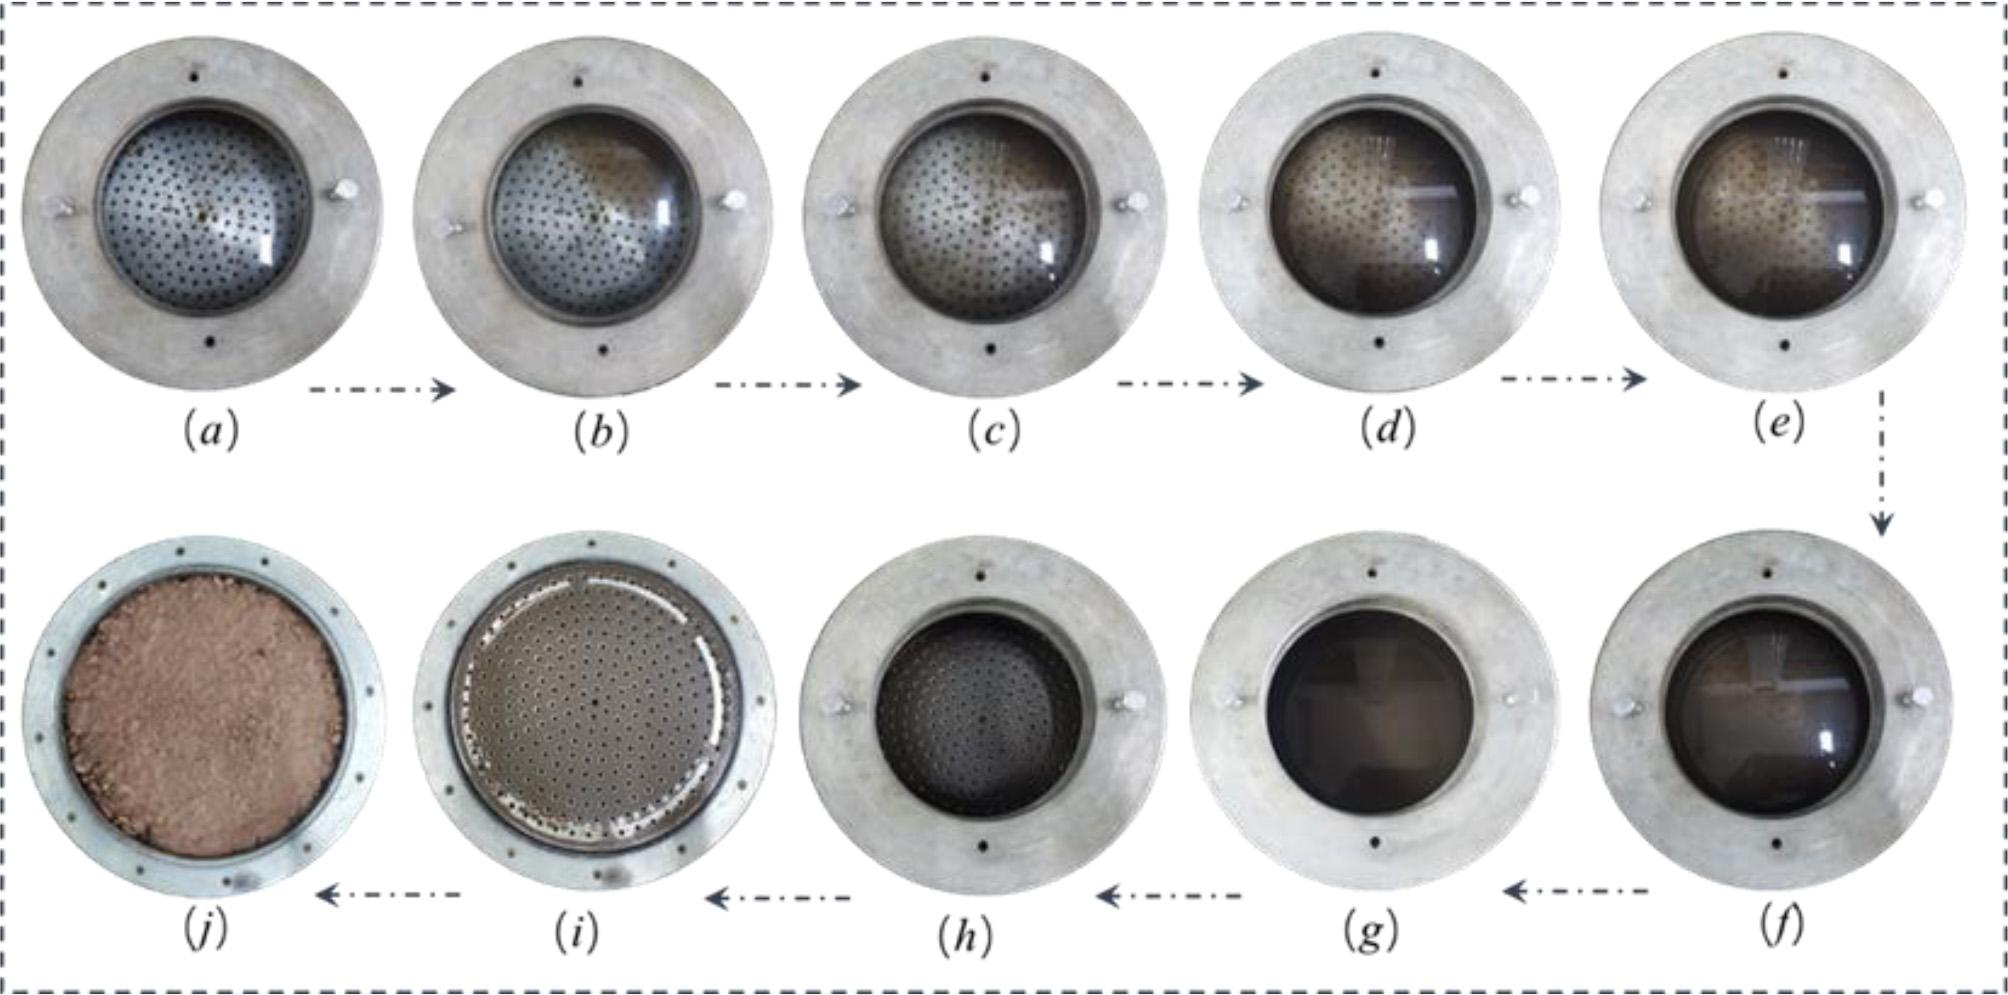
Characteristics of vertical permeability deformation of coarse-grained soil. (a) Water oozing from top surface; (b) The fine particles begin to dance; (c) The fine particles have increased throbbing; (d) The water creates turbidity; (e) The turbidity is getting worse; (f) Fine particles are carried out by the current; (g) The phenomenon of subduction has intensified; (h) A lot of fine particles are brought out; (i) The soil surface is submerged and deformed; (j) Cross section of permeating specimen.
By analyzing the results obtained from tests 1 to 8, the relationship between gradation area and permeability coefficient can be derived. The effect of
Equation (4) was used to fit the test results of specimens 1 to 6. The results of this analysis are presented in Table 2, and the corresponding fitted curves are illustrated in Figure 6.
Fitting results of Equation (4) for samples 1 to 6
| Fitting Parameters | Numerical Value |
|---|---|
| -0.909 | |
| 0.027 | |
| 5.851 | |
| 0.973 |
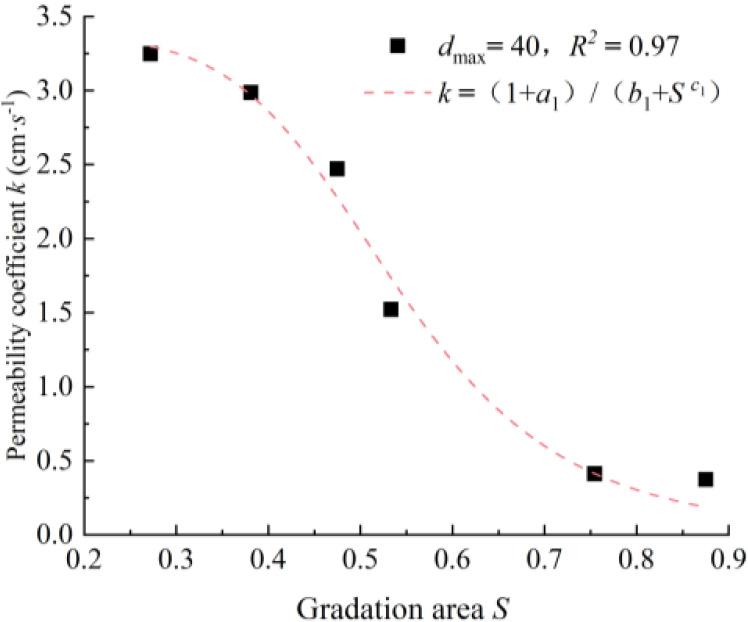
Fitting relationship between gradation area and permeability coefficient
It can be seen from the figure that the gradation area increases from 0.271 to 0.475, and the permeability coefficient of the sample decreases from 3.244 to 2.474, a decrease of 23.74 %. The grading area increased from 0.475 to 0.754, and the permeability coefficient of the sample decreased from 2.474 to 0.422, a decrease of 82.94 %. The grading area increased from 0.754 to 0.874, and the permeability coefficient of the sample decreased from 0.422 to 0.374, a decrease of 11.37 %. That is, with the increase of the grading area S, the permeability coefficient k gradually decreases, and with the further increase of the grading area, the change of the permeability coefficient gradually tends to be stable. At a constant maximum particle diameter, fine particles content (
At the same time, within the gradation area exceeding 0.4 and less than 0.7, there is a notable decrease in the permeability coefficient as the gradation area increases. When the gradation area surpasses 0.7, the permeability coefficient continues to decrease with an increased gradation area, although the rate of decrease is significantly reduced. This suggests that fine particles exhibit a more effective filling effect, and the permeability coefficient is more influenced by the content of fine particles, aligning with the observations of Bao [24].
As depicted in Figure 7, the fitted curves for the permeability coefficient (
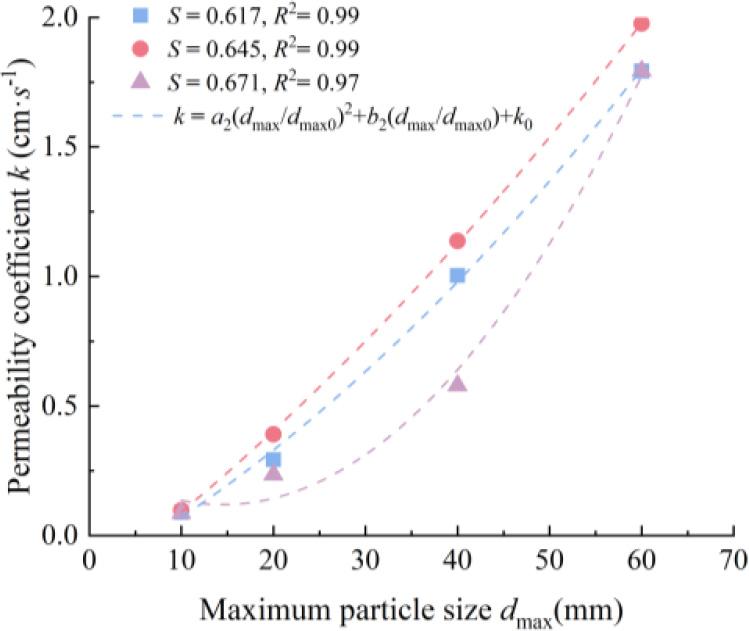
Fitting relationship between maximum particle size and permeability coefficient
Based on the test data analysis of specimens 9 to 18, the
The maximum particle size and permeability coefficients for specimens 9 to 18 were fitted by Equation (5). The fitting results are presented in Table 3, and the fitting curves are illustrated in Figure 7.
Fitting results of Equation (5) for samples 9 to 18
| S | a2 (10-4) | b2 | k0 | R2 |
|---|---|---|---|---|
| 0.617 | 7.983 | -0.023 | 0.287 | 0.99 |
| 0.645 | 1.594 | 0.026 | -0.192 | 0.99 |
| 0.671 | 2.148 | 0.020 | -0.147 | 0.97 |
Under the identical gradation area
It is observable from Figure 7, the fitted curves for the permeability coefficient
Building upon the aforementioned analysis, the connection between the permeability coefficient
For verification, Equation (6) was used to fit the test results of all specimens, and the fitting results are summarized in Table 4. The predicted permeability coefficients obtained from the fitting were contrasted with the measured values, as illustrated in Figure 8.
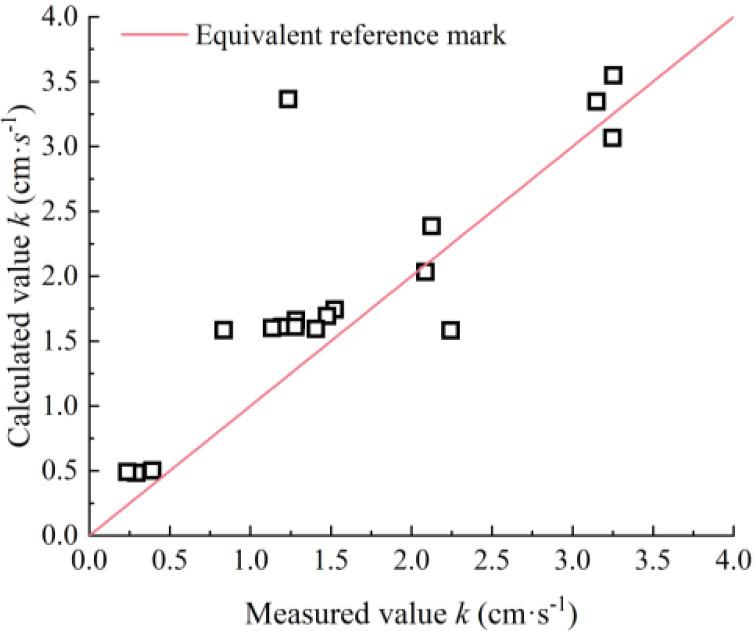
Measured and calculated values of permeability coefficient for coarse-grained soil
Fitting results of Equation (6) for samples 1 to 18
| Fitting Parameters | Numerical Value |
|---|---|
| a | 0.020 |
| b | 0.036 |
| c | -0.977 |
| e | 8.566 |
| f | 0.020 |
| R2 | 0.833 |
Notably, the predicted points for each group closely align with the measured points. While one point exhibits a significant error, likely due to a systematic error stemming from test operation issues, the majority of predicted values have an error of no more than 9% from the measured values. The coefficient of determination is 0.833. Hence, it can be inferred that the empirical formula accurately describes the influence of gradations on the permeability coefficients for coarse-grained soils.
To validate the applicability of the aforementioned empirical formula, Equation (6) was used to fit the results of the permeability tests on coarse-grained soils from the literature [25]. The fitted and actual values are shown in Figure 9, and the computational error values obtained from the fitting are listed in Table 5.
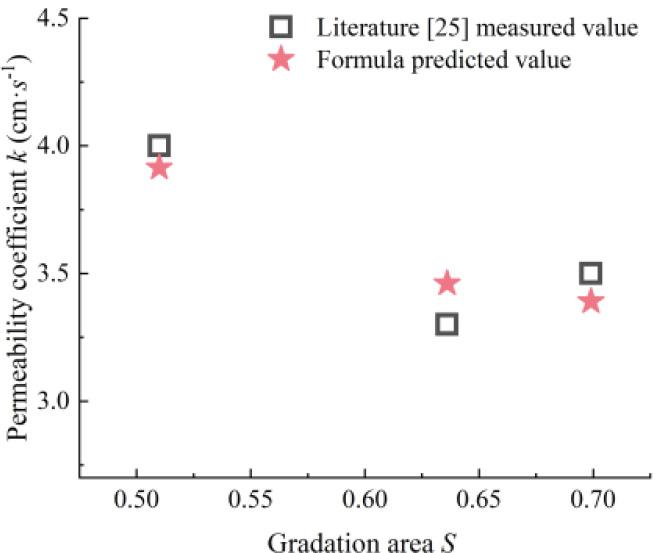
The relationship between the measured and fitted values of the permeability coefficient in literature [25] and the gradation area
Fitting literature [25] results
| Gradation Area |
Permeability Coefficient |
Error Values (%) | ||
|---|---|---|---|---|
| Measured values | Predicted values | |||
| 0.510 | 60 | 4.000 | 3.916 | 2.138 |
| 0.571 | 60 | 4.435 | 4.325 | 2.480 |
| 0.636 | 60 | 3.300 | 3.461 | 4.889 |
| 0.699 | 60 | 3.350 | 3.391 | 3.112 |
It is evident that the disparities between the calculated and tested values of Equation (6) are minimal, with a maximum error of less than 5%. Hence, Equation (6) can precisely and quantitatively portray the relationship between the permeability coefficient and gradation for coarse-grained soils.
Based on the above analysis, a method for determining the permeability coefficient of coarse-grained soils in actual projects using the indoor test results can be obtained: First, the coarse-grained soil in the field is scaled to obtain four or more sets of different gradation specimens satisfying the required size. Then, indoor tests are carried out on all the downsized specimens to obtain the permeability coefficients for each group of specimens. After incorporating the gradation parameters and permeability coefficients of specimens into Equation (6), the corresponding parameter values
Based on the continuous gradation equation, the results of the indoor constant head permeability test are analyzed using a vertical penetrometer for coarse-grained soils. A total of 18 sets of test soils are designed according to variables of gradation area At a constant maximum particle diameter At a constant gradation area The impact of the maximum particle diameter By establishing an empirical formula of permeability coefficient with four parameters, this study provides a method for engineering practice to predict the permeability coefficient of field original graded soil materials based on laboratory test results. This will help to accurately predict and evaluate the permeability of coarse-grained soil in engineering design and construction, and provide reference for engineering safety design. In addition, the empirical formula of this study shows high accuracy in literature verification, which provides reliable methods and ideas for similar research in the future.