Big data analytics in supply chain management and its impact on business performance

Pubblicato online: 17 mar 2025
Ricevuto: 18 ott 2024
Accettato: 15 feb 2025
DOI: https://doi.org/10.2478/amns-2025-0202
Parole chiave
© 2025 Di Yin et al., published by Sciendo
This work is licensed under the Creative Commons Attribution 4.0 International License.
Since the reform and opening up, China’s economy has begun to realize rapid growth, and all kinds of commodities have begun to circulate in a larger area, which requires the support of a good supply chain system [1-2]. At present, the transformation of traditional supply chain to modernized supply chain development is relatively slow, and it is difficult to effectively meet the needs of the current social development, and at the same time, the competitive relationship between the supply chain has also begun to gradually transform from the previous brand competition to industrial chain competition [3-5]. Therefore, in the existing environment, the supply chain needs to combine the development process of the current era, strengthen the use of big data, and scientifically and reasonably play its role, so as to ensure that the quality and efficiency of the management can be effectively and efficiently improved, and deepen the association with the upstream suppliers, which will provide an unnegligible help for the comprehensive development of the supply chain [6-8].
With the arrival of the big data era, enterprises are facing an increasingly complex and changing market environment, and cost management, as an important part of enterprise management, has a crucial impact on the competitiveness and profitability of enterprises [9-10]. In the supply chain perspective, optimizing the cost management process is particularly important, which will directly affect the efficiency and accuracy of the flow of goods, and have a significant impact on the production capacity and customer service ability of enterprises [11-12]. Cost management in the supply chain perspective of enterprises in the era of big data refers to the use of the supply chain perspective for cost management by enterprises in the context of big data [13-14]. The supply chain perspective implies that enterprises should control and optimize costs throughout the entire process from raw material procurement to final product delivery [15]. In the era of big data, enterprises can realize comprehensive monitoring and analysis of various resources, links and activities in the supply chain by fusing data from various links [16-17]. By collecting, storing, processing and analyzing massive data, enterprises can make better use of resources, improve efficiency, and can more accurately predict market demand and changes [18-19].
Currently, the rapid development of digital technology has given rise to new business models and formats, and digital transformation has become a key hand for enterprises to cope with market changes and shape competitive advantages [20-21]. Supply chain management, as a link connecting the upstream and downstream of enterprises, faces unprecedented challenges and opportunities in the digital era. The deep integration of digital technology and supply chain management provides a new path to optimize business processes, improve operational efficiency, and enhance risk resilience, which has a positive impact on the improvement of enterprise performance [22-23].
To summarize, scholars have all conducted research on big data, supply chain, enterprise performance and other variables to a certain extent, and have achieved some good results. However, from the point of view of the existing research results, most scholars only singularly analyze the relationship with enterprise performance and supply chain management from the perspective of big data, resulting in part of the research is not deep enough and the expression of the article is not comprehensive enough. This paper innovatively introduces supply chain flexibility as a mediating variable between big data analyzing ability and enterprise performance, and explores the mediating effect of the strength of supply chain flexibility affecting big data analyzing ability and enterprise performance. A new model is constructed to reveal the influence path of big data analytic capability on enterprise performance.
Resource-Based Theory (RBT) originated in the field of economics and was used more in the field of strategic management, and then gradually evolved into the fields of operations management, marketing, and human resource management and entrepreneurship management [24]. There are three main perspectives included in RBT, the resource-based perspective, the knowledge-based perspective, and the relationship-based perspective.
Enterprise resources are the basis for the formation of capabilities, through which capabilities are established and further developed into core capabilities. RBT theory summarizes the formation of core capabilities of an enterprise into three stages, and promotes the transformation of the three stages under the role of the environment, as shown in the specific model in Figure 1. In the first stage, the enterprise employees transform the enterprise resources into a kind of personal professional skills through learning, for example, the employees with IT technology background are converted to learn the big data analysis technology and become more and more professional in the field of big data analysis through work practice. In the second stage, each department of the enterprise learns to develop the work practices of the employees in the organization into an efficient operational practice. In the third stage, the organization learns how to respond to the external environment and develops its own core competencies.
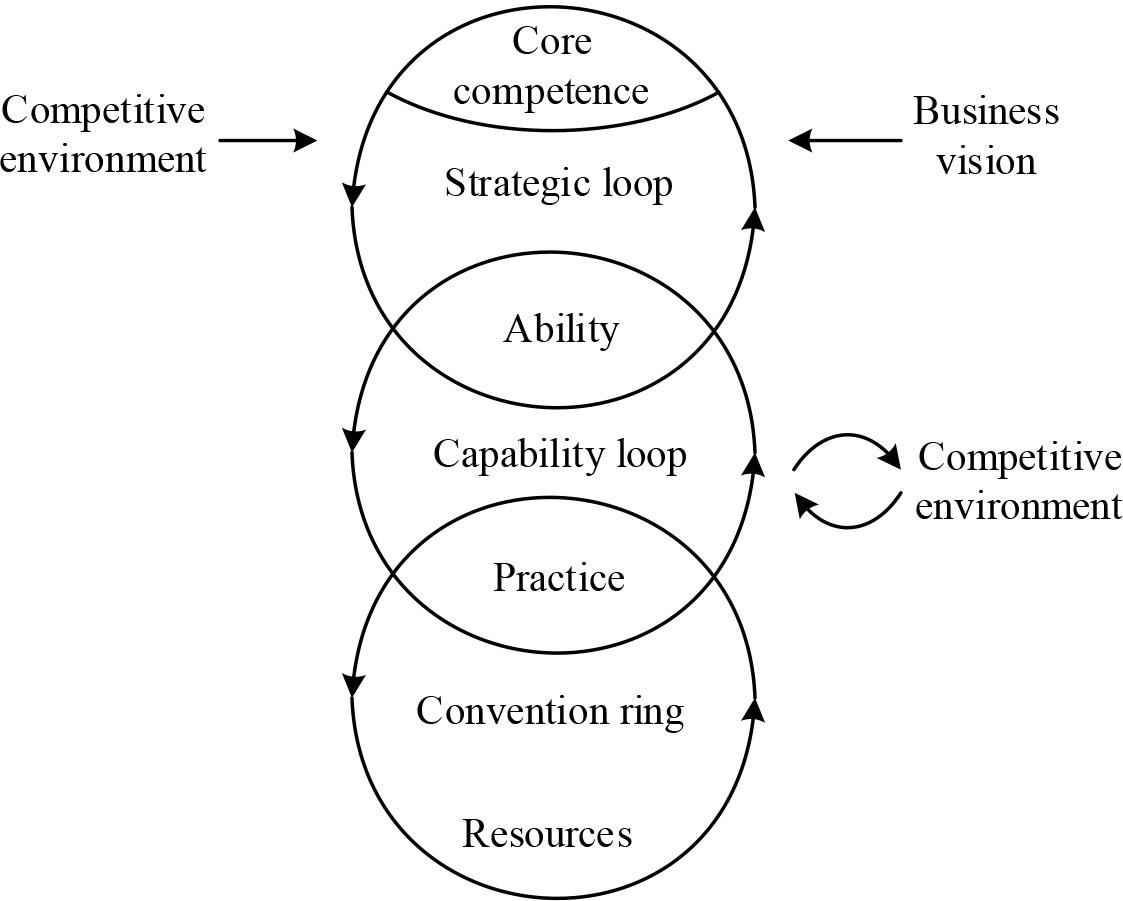
Formation process of core competence
The primary goal of enterprises to carry out big data analysis is to establish big data analysis capability, and what resources need to be available to enhance big data analysis capability is a key issue that enterprises need to think about, and resource-based theory provides a theoretical basis for the sources of big data analysis capability formation.
While RBT emphasizes the selection of resources, dynamic capabilities emphasize the development, allocation and renewal of resources. Having basic resources does not directly provide a sustainable competitive advantage for a firm, whereas dynamic capabilities help firms to solve problems systematically, allow them to make timely, market-oriented decisions, and introduce innovative changes in their operations that are more likely to produce superior performance [25].
The evolution of capabilities in a dynamic environment is proposed from an IT perspective as shown in Figure 2, where IT architectural capabilities provide access to information, increase information flow and collaboration opportunities, and are further elevated to the level of business capabilities of an organization that include dynamic capabilities, rapid response capabilities, and operational capabilities to bring about strategic advantages. Dynamic capabilities are also hierarchical, and the higher the hierarchy, the more abstract and complex they become. Dynamic capabilities are categorized into lower-order and higher-order dynamic capabilities, with higher-order dynamic capabilities representing higher levels of strategic insight and complex capabilities that are more difficult to observe and decode. Big data analytics capabilities face the status quo of rapidly changing technology and high investment in realizing the value of the enterprise, so the integrated hierarchical and contextual perspectives contribute to a better understanding of the value of big data analytics in this paper.
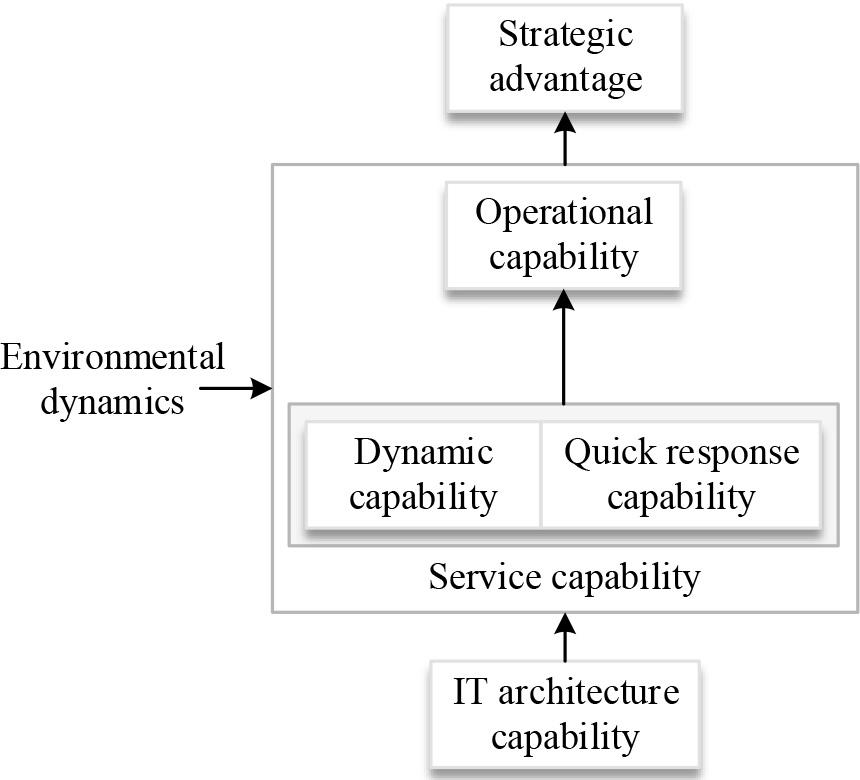
Hierarchical evolution process of capability
Value theory originated as an advancement of resource-based theory to help firms identify valuable resources. For enterprises, internal resources create use value and exchange value is realized through interaction with the outside world. At the same time they categorized value activities into 3 parts: value creation, value capture and value destruction [26].
The process of value creation depends on the theoretical perspective used and is understood differently at the individual, firm and societal levels. Achieving supply chain agility and enterprise performance are two of the goals that companies are more concerned with, so it is interesting to explore their value creation processes at the supply chain and enterprise levels in a big data analytics context.
Value capture comes along with value creation, when valuable resources are identified, competitors can take part of the value created by the enterprise. In order to prevent the value of resources from being captured, the enterprise should bundle the resources and further build them into capabilities, so as to ensure that the enterprise can capture value from the resources for a longer period of time.
Value destruction means that a company does many things well, but even doing only one thing wrong may destroy the value of those things done well. This means that companies should be more specific and comprehensive in their assessment of the value of their capabilities, so that they do not lose the possibility of bringing more value by failing to bring value in one area.
Innovation is the source of enterprise survival and development, the key to the success or failure of enterprises lies in innovation, and the key to the success or failure of innovation lies in management [27]. The innovation choice space model is shown in Figure 3 to analyze the sources of innovation activities. The vertical coordinate of the model represents the two dimensions of innovation, “incremental and breakthrough innovation”, and the horizontal coordinate represents “the degree of environmental uncertainty (the higher the degree represents the greater the number of environmental elements and the closer the potential interaction between the elements)”. Regions 1 and 2 are two types of innovation activities of firms when the level of environmental uncertainty is low, when firms still innovate according to the established framework due to the relative stability of environmental elements. Region 1 Exploitation is the most basic category of innovation activity, where a stable shared framework is assumed to exist and firms realize improvements in the tools and methods of technological research and market research through adaptive and incremental exploitation. Area 2 limited search is an option when entering new areas that have stretched the known boundaries of the firm, and the firm’s innovative activities are usually realized by deepening its connections with its stakeholders.
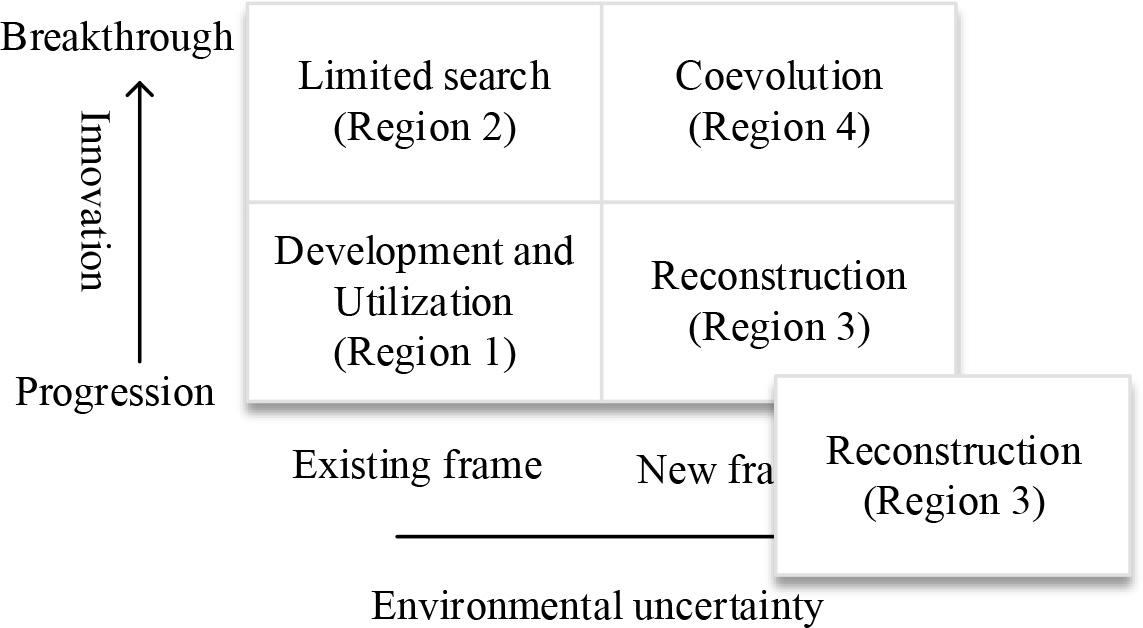
Innovation choice space model
Regions 3 and 4 are two types of innovation activities for firms when the level of environmental uncertainty is high, when firms need to seek new frameworks to sustain their growth or ensure competitive advantage due to the close interaction between environmental factors and firms. Area 3 reconfiguration is an attempt to explore different permutations of environmental factors and reorganize the business model to match the environmental factors. This phase is riskier for the firm and may lead to failure of the transformation or to the emergence of a strong business model and the formation of a virtuous cycle. Area 4 synergistic evolution is an unprecedented innovation for firms and represents a passive innovation activity with blurred boundaries.
The innovation theory sheds light on this paper in the following ways:
First, the innovation theory explains that the innovation activities of enterprises need to experience the transformation of factor combination from progressive to breakthrough. Strategic flexibility emphasizes the flexible adjustment of the resource portfolio, and strategic innovation emphasizes the breakthrough, reorganization and innovation of the resource portfolio model, and it is obvious that strategic flexibility is the foundation and prerequisite for enterprises to realize strategic innovation, which provides the basis for the research hypothesis that strategic flexibility promotes strategic innovation.
Secondly, the innovation choice space model illustrates that along with the enhancement of the enterprise’s recognition of environmental factors, the enterprise is able to realize the transformation from the existing framework to the new framework and achieve sustainable growth.
Specifically, with the enhancement of analyzing power of consumer market, enterprises can satisfy consumers’ changing consumer needs and further creatively reshape consumer needs, so as to seize the consumer market and establish competitive advantages, which provides the basis for this paper to explore the chain relationship of “big data analyzing power - strategic flexibility - strategic innovation - enterprise performance” based on the theory of innovation. This provides the basis for this paper to investigate the chain relationship of “big data analytic capability--strategic flexibility--strategic innovation--enterprise performance” based on innovation theory.
Supply chain management plays a pivotal role for organizations, especially in the face of unexpected crises, timely supply/delivery and responding to customer demand often tends to plague organizations. Taking a retail enterprise as an example, in understanding the impact of big data analytics capability on supply agility, it is important to reflect not only the results but also the process. First understand the enterprise’s big data analytics in the supply side of the application mechanism as shown in Figure 4, the diversification of application scenarios to enhance the depth of cooperation with suppliers, mainly reflected in product development, inventory replenishment, product traceability, advertising and marketing, supply logistics and supply selection, a total of six aspects.
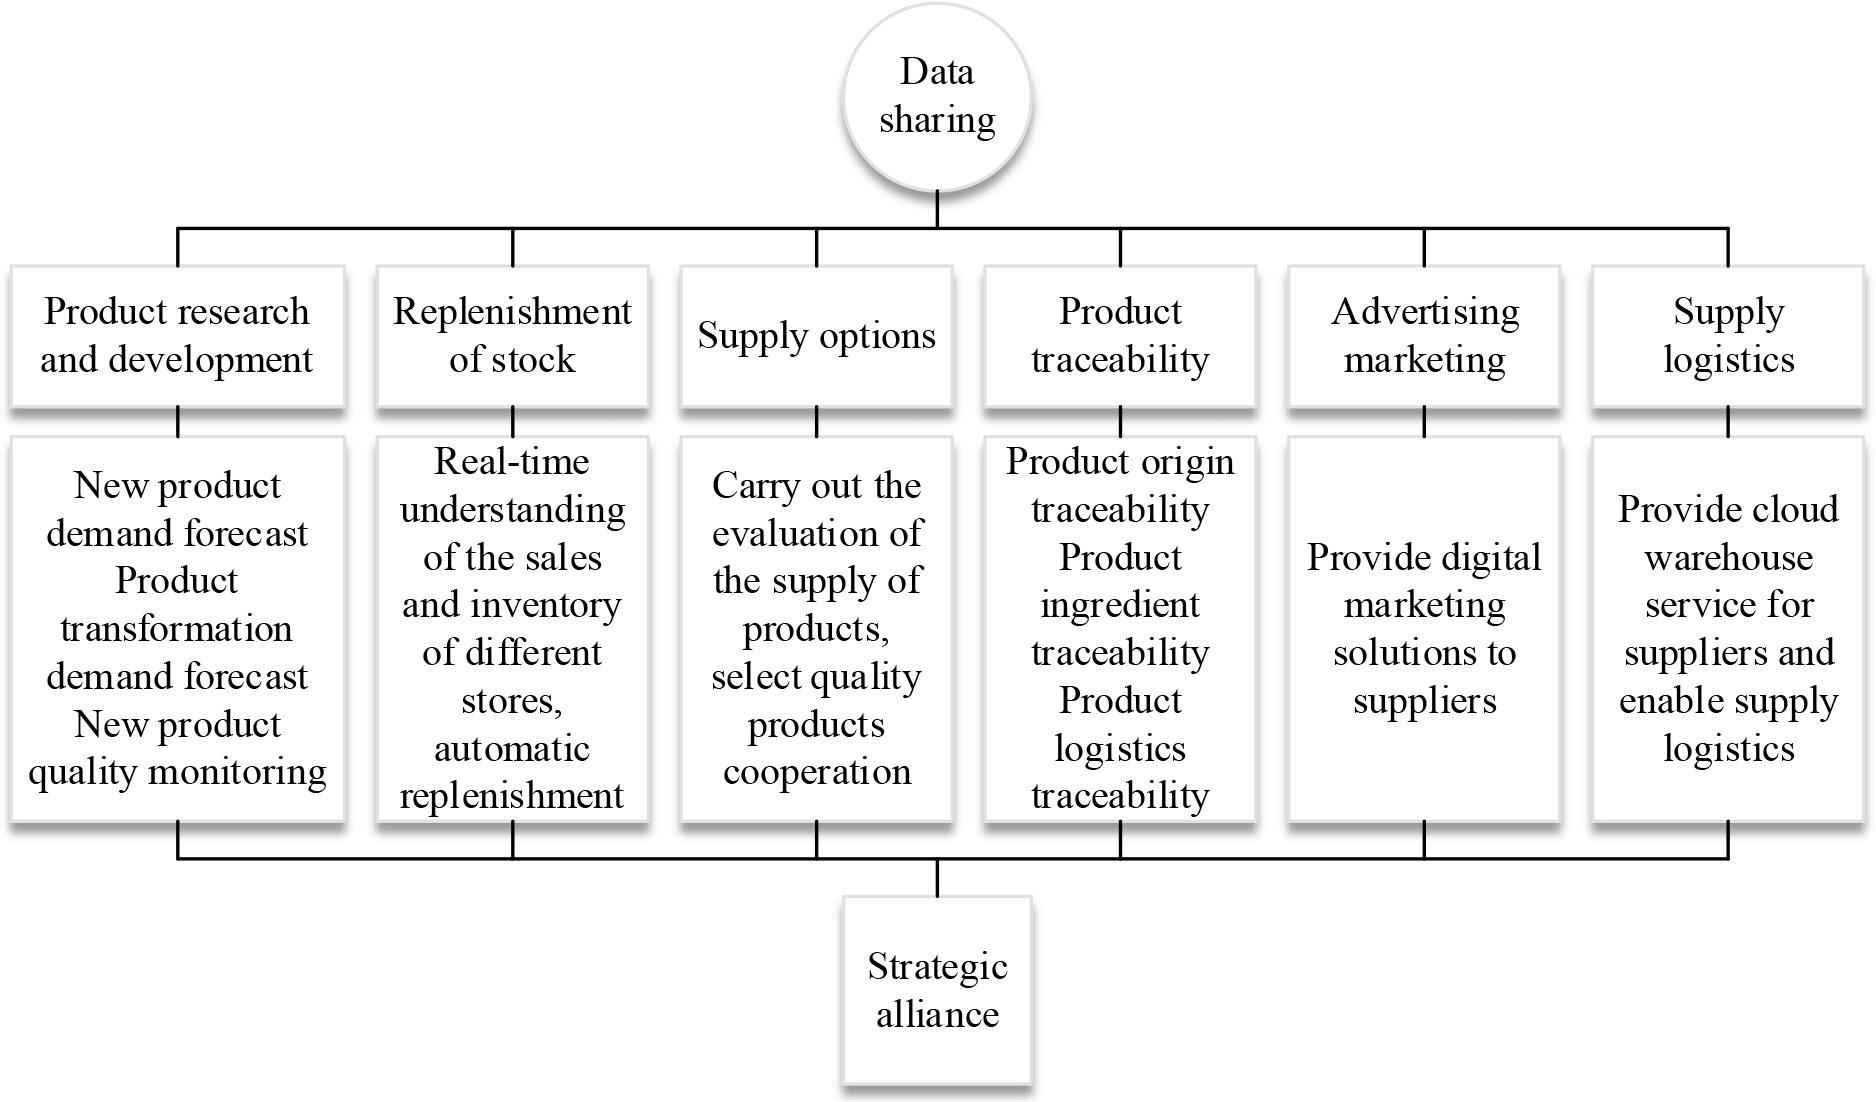
Big data analysis on the supply end
Enterprises master a large number of consumer data, data analysis to get customer demand after cooperation with the relevant brand enterprises, joint development to achieve manufacturing production.
The enterprise has several self-owned warehouses across the country, and the warehouse replenishment system can send notices to suppliers according to the instructions of the data analysis system, so as to achieve timely replenishment.
Product traceability is a concern for many consumers, through the thousands of products labeled traceability, can quickly find out the cause of the problem.
Enterprises use data analysis to give customized marketing programs for different suppliers, reducing suppliers’ marketing problems.
In addition to its own warehouses, the company has also built a cloud warehouse, an order-oriented front warehouse service to reduce logistics losses and solve the problem of suppliers under the fluctuating demand for products.
In supply selection, the application of big data analysis technology can also analyze the more popular products in different regions and ages, thus helping to select fast-selling products.
In this paper, we have sorted out the relevant theories of big data capability, strategic flexibility, strategic innovation, environmental uncertainty, enterprise performance, and Internet enterprise. Further, based on the resource base theory, dynamic capability theory, innovation theory, and value theory, and taking supply chain management enterprises as the research object, the impact of big data analytic capability on enterprise performance is discussed in depth, the important mediators and weighting factors between the two are analyzed, and the theoretical model of the mechanism of the role of big data analytic capability on enterprise performance is constructed as shown in Fig. 5.
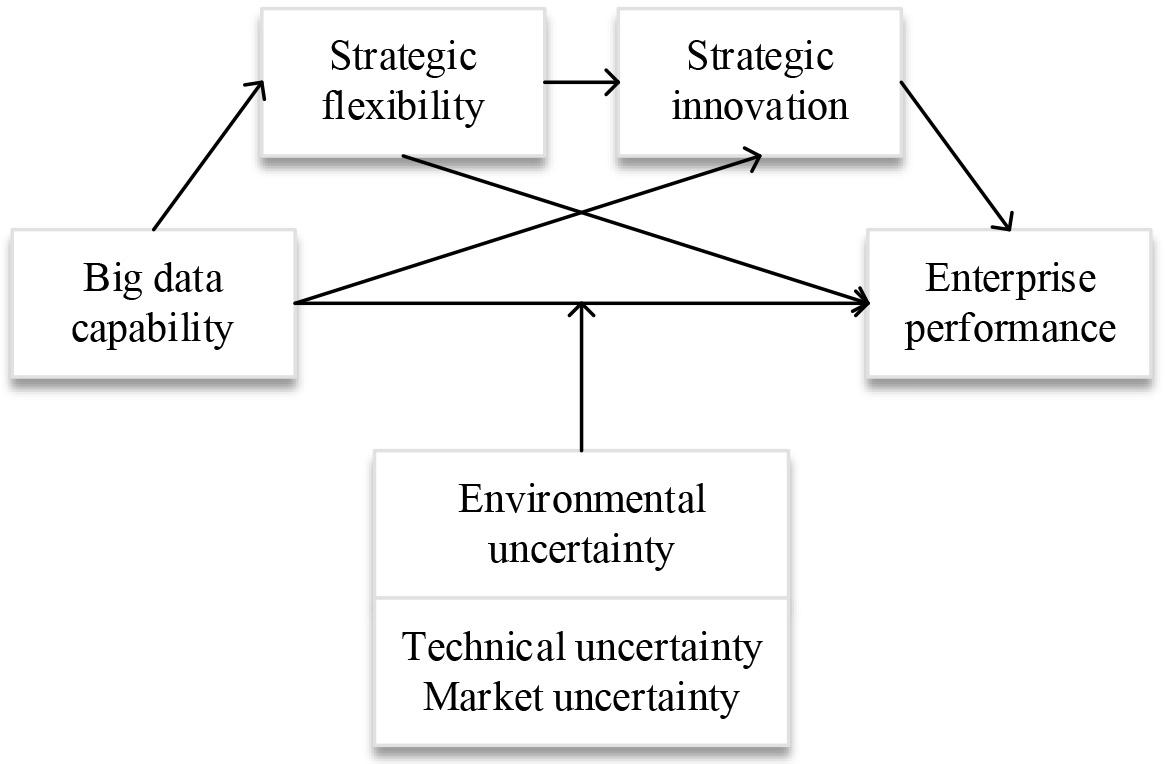
Theoretical model of big data analysis ability on enterprise performance
The theoretical model contains the following main elements:
The purpose of this paper is to discuss the relationship between big data analytic capability and enterprise performance, so big data capability is taken as the independent variable and enterprise performance as the dependent variable in the model to analyze the direct effect of big data capability on enterprise performance.
This paper aims to explore the mediation path of big data analytic capability affecting enterprise performance from the perspective of enterprise supply chain management, so it introduces two variables, strategic flexibility and strategic innovation, into the model, and analyzes the single mediating role, and the chain mediating role, played by strategic flexibility and strategic innovation between big data capability and enterprise performance.
The purpose of this paper is to explore the weighting factors of big data analytics capability affecting enterprise performance from the external environmental factors, so the variable of environmental uncertainty and the two constituent dimensions of technological uncertainty and market uncertainty are introduced into the model, and their moderating roles in the relationship between big data capability and enterprise performance are analyzed respectively.
Based on the above analysis, this paper constructs an integrated theoretical model.
The use of big data technology in the supply chain can enhance the flexibility of the supply chain, reduce the whiplash effect among supply chain members, strengthen the integration of supply chain resources and accelerate the transmission of information, so that supply chain-related enterprises can better cope with the increasingly competitive market environment and enhance their market competitiveness.
Based on big data technology and closed-loop supply chain, a competitive intelligence system has been established to provide effective support for realizing supply chain flexibilization. Based on the dynamic capability theory to study the realization mechanism of big data on enterprise supply chain agility, it is found that the reasonable use of big data analysis technology is of great significance to improve the flexibility of supply chain.
Therefore, this paper makes the following hypotheses:
H1, big data analytics capability positively affects supply chain flexibility. H2, big data analytic capability positively affects process flexibility in supply chain flexibility. H3, big data analytic capability positively affects logistics flexibility in supply chain flexibility.
With the rapid development of big data technology, the competition among enterprises has developed from the competition of products to the competition of comprehensive strength of enterprises. Big data can indirectly improve the overall performance of enterprises by improving tangible and intangible benefits. The relationship model between data empowerment, strategic flexibility and enterprise performance is constructed with strategic flexibility as the mediating variable, and it is found that data empowerment has a significant effect on enterprise performance. Enterprises apply big data technology to transform data into various information assets, from which they can analyze the needs of customers to realize precise marketing, increase the order rate of customers, expand market share, and promote the growth of enterprise performance.
Therefore, this paper makes the following hypotheses:
H4, Big data analytics capability positively affects able firm performance.
The development of supply chain flexibilization allows firms to engage in real-time sharing of information in order to provide the most rapid response to changing market and customer demands, and to coordinate inventory quantities, reduce unnecessary cost expenditures, and promote growth in performance among supply chain firms.
Therefore, this paper makes the following hypotheses:
H5, supply chain flexibility positively affects firm performance. H6, process flexibility in supply chain flexibility positively affects firm performance. H7, logistics flexibility in supply chain flexibility has a positive impact on firm performance.
To sum up, on the one hand, big data analytics can uncover useful information from a large amount of data, thus improving the flexibility of enterprise supply chain management. On the other hand, the enhancement of supply chain flexibility can also improve enterprise performance, in which the agile supply chain effect plays a partly mediating role in enterprise partnership and enterprise performance. This paper adopts process flexibility and logistics flexibility to measure supply chain flexibility, and analyzes the mediating effect of supply chain flexibility between big data and enterprise performance.
Therefore, this paper makes the following assumptions:
H8, Supply chain flexibility mediates between big data analytics capabilities and firm performance. H9, Process flexibility mediates between big data analytic capability and firm performance. H10, Logistics flexibility mediates between big data analysis capability and firm performance.
This study selects high-tech enterprises containing supply chain management as the research sample, mainly through offline visits to research high-tech enterprises for questionnaire collection. First of all, the enterprises in the Haikou High-tech Industrial Development Zone conducted a small-scale research, issued paper questionnaires or electronic questionnaires to the employees or managers of the technical department in the enterprises, predicted the questionnaires, and further improved the questionnaires according to the results of the survey. Then in the formal questionnaire collection, expand the scope of research, increase the number of research enterprises, distribute questionnaires to employees and managers related to big data analysis technology in the process of enterprise research, and distribute questionnaires to middle and senior managers of high-tech enterprises through the teacher’s project resources.
In the end, 321 questionnaires were collected, excluding some extreme and consecutive options consistent questionnaires, a total of 264 valid questionnaires were obtained, and the effective recovery rate of the questionnaires was 82.24%.
Since this study was conducted in the context of big data analysis in enterprise supply chain management, the Big Data Analytics Competency Measurement Scale was used to measure big data analytics competency, and the specific test items measured are shown in Table 1. Big data analysis ability is divided into 3 dimensions, namely, resource acquisition ability, integration and analysis ability, and insight and prediction ability, with a total of 12 items.
Questionnaire of Big Data Capability
| Variable | Dimensionality | Question number | Item |
|---|---|---|---|
| Big data analysis ability (BDAC) | Resource acquisition ability (BDAC1) | BDAC11 | The enterprise can obtain internal and external data resources to support the business. |
| BDAC12 | Companies can get enough data to analyze the required professionals. | ||
| BDAC13 | Enterprises can obtain sufficient technical equipment and skills needed for data analysis. | ||
| BDAC14 | Companies can update the data, talent, and technical resources they need in a timely manner. | ||
| Integration and analytical ability (BDAC2) | BDAC21 | Enterprise big data analysts have the basic skills to complete big data analysis. | |
| BDAC22 | Companies can integrate internal data with external data to facilitate analysis of the business environment. | ||
| BDAC23 | Organizations can analyze very large amounts of unstructured or highly dynamic data. | ||
| BDAC24 | Enterprises can identify and screen out commercially valuable information from massive data. | ||
| Insight and prediction ability (BDAC3) | BDAC31 | Companies base their decisions on big data analytics rather than intuition. | |
| BDAC32 | Big data analytics can support business activities. | ||
| BDAC33 | Enterprises can achieve real-time insights into the market based on big data analysis. | ||
| BDAC34 | Enterprises can discover the potential needs of customers through data analysis. |
For the measurement of firm performance, the instrument used in this paper is shown in Table 2, which will measure firm performance in two dimensions, market performance and operational performance, with a total of eight question items.
Enterprise performance measurement scale
| Variable | Dimensionality | Question number | Item |
|---|---|---|---|
| Enterprise performance (EP) | Market performance (EP1) | EP11 | Firms enter new markets faster than their competitors. |
| EP12 | Companies bring new products or services to market faster than their competitors. | ||
| EP13 | The success rate of a company’s new product or service is consistently higher than that of its competitors. | ||
| EP14 | The company’s market share has surpassed that of its competitors. | ||
| Operational performance (EP2) | EP21 | The productivity of the company has surpassed that of its competitors | |
| EP22 | The company’s profit margin exceeds that of its competitors. | ||
| EP23 | The company’s return on investment exceeds that of its competitors. | ||
| EP24 | The company’s sales revenue exceeded that of its competitors. |
In this study, supply chain flexibility refers to, through effective supply chain management, the ability to collaborate with supply chain members to economically and quickly produce products oriented to consumer demand. This paper combines the two divisions of supply chain flexibility structural dimensions, and based on this design enterprise supply chain flexibility measurement tool as shown in Table 3. The scale divides supply chain flexibility into new product flexibility, procurement flexibility, product flexibility, delivery flexibility and information system flexibility, totaling five dimensions. The scale adopts a Likert 5-level scale with a total of 22 items.
Questionnaire of Supply Chain Flexibility
| Variable | Index | Question number | Item |
|---|---|---|---|
| Supply chain flexibility (SCF) | New product flexibility (SCF1) | SCF11 | The ability of the company to introduce new products every year |
| SCF12 | The degree of consumer involvement in the development of new products. | ||
| SCF13 | Use computer technology to assist in the design and production of new products. | ||
| SCF14 | Effectively plan development cost and time during new product development. | ||
| Procurement flexibility (SCF2) | SCF21 | The ability of enterprises to maintain supplier relationships in a changing environment. | |
| SCF22 | The ability of suppliers to respond to changes in raw material types and demand. | ||
| SCF23 | The ability of enterprises to quickly meet the diversification of raw material demand. | ||
| SCF24 | Enterprise’s ability to change suppliers. | ||
| SCF25 | The company’s ability to adapt to changes in supplier delivery cycles. | ||
| Product flexibility (SCF3) | SCF31 | Ability to offer different product combinations according to consumer needs. | |
| SCF32 | Change the ability of existing product design quickly and accurately according to consumer demand. | ||
| SCF33 | Enterprise production equipment can rapidly transform functions to produce the ability of different products. | ||
| SCF34 | The time and cost required to produce non-standard products. | ||
| Delivery flexibility (SCF4) | SCF41 | The enterprise can provide a variety of distribution modes for each product. | |
| SCF42 | The ability to adjust the distribution mode to meet the urgent needs of customers. | ||
| SCF43 | Coordinate warehouse, distribution channel and factory to complete user order. | ||
| SCF44 | Cost and time can be effectively controlled when changing the quantity and type of products shipped. | ||
| Information system flexibility (SCF5) | SCF51 | The ability to communicate timely information between supply chain partners. | |
| SCF52 | The ability to meet different information needs through existing information systems. | ||
| SCF53 | Quality and accuracy of information transfer between supply chain enterprises. | ||
| SCF54 | Supply chain information system can be reused and reconfigurable. | ||
| SCF55 | The scalability of supply chain information system according to business needs. |
In order to ensure the reliability of the questionnaire, the study analyzed the reliability of the variable scales of the valid questionnaire using SPSS 26.0, where the Cronbach’s
The results of the reliability analysis of big data analytic ability are shown in Table 4, the overall Cronbach’s ɑ value is 0.8618, the Cronbach’s ɑ value of each dimension is 0.8437, 0.8532, 0.8442, which are all greater than 0.7, and the CITC value of each question item is greater than 0.4. Therefore, it indicates that the scale used in this study to measure the big data analytic ability has a high reliability.
The results of the reliability analysis of corporate performance are shown in Table 5, the Cronbach’s ɑ value of the overall scale of corporate performance is 0.8446, the Cronbach’s ɑ value of each dimension is 0.8508, 0.8513, respectively, which is greater than 0.7, and the CITC value of each question item is greater than 0.4. Therefore, it indicates that the scale of corporate performance measurement, has good reliability.
The reliability test results of supply chain flexibility are shown in Table 6, which shows that the overall Cronbach’s ɑ value of the scale is 0.8687, and the Cronbach’s ɑ values of each dimension are 0.8864, 0.8646, 0.8247, 0.8306, and 0.8583, which are all greater than 0.7, and the CITC value of each item is greater than 0.4. In summary, it can be seen that supply chain flexibility scale has high internal consistency. It can be seen that the supply chain flexibility scale has high internal consistency.
Reliability analysis results of big data analysis capability
| Variable | Dimensionality | Question number | CITC | After deletion Cronbach’s |
Cronbach’s |
|
|---|---|---|---|---|---|---|
| Big data analysis ability (BDAC) | Resource acquisition ability (BDAC1) | BDAC11 | 0.4337 | 0.8567 | 0.8437 | 0.8618 |
| BDAC12 | 0.6128 | 0.8443 | ||||
| BDAC13 | 0.5436 | 0.8592 | ||||
| BDAC14 | 0.5208 | 0.8560 | ||||
| Integration and analytical ability (BDAC2) | BDAC21 | 0.4783 | 0.8546 | 0.8532 | ||
| BDAC22 | 0.6254 | 0.8433 | ||||
| BDAC23 | 0.4759 | 0.8583 | ||||
| BDAC24 | 0.6001 | 0.8472 | ||||
| Insight and prediction ability (BDAC3) | BDAC31 | 0.5225 | 0.8406 | 0.8442 | ||
| BDAC32 | 0.6237 | 0.8428 | ||||
| BDAC33 | 0.4332 | 0.8555 | ||||
| BDAC34 | 0.6108 | 0.8443 | ||||
Results of enterprise performance reliability analysis
| Variable | Dimensionality | Question number | CITC | After deletion Cronbach’s |
Cronbach’s |
|
|---|---|---|---|---|---|---|
| Enterprise performance (EP) | Market performance (EP1) | EP11 | 0.5537 | 0.8092 | 0.8508 | 0.8446 |
| EP12 | 0.5229 | 0.8165 | ||||
| EP13 | 0.6237 | 0.8017 | ||||
| EP14 | 0.4804 | 0.8205 | ||||
| Operational performance (EP2) | EP21 | 0.6018 | 0.8026 | 0.8513 | ||
| EP22 | 0.5921 | 0.8368 | ||||
| EP23 | 0.6206 | 0.8007 | ||||
| EP24 | 0.4498 | 0.8223 | ||||
Reliability test results of supply chain flexibility
| Variable | Index | Question number | CITC | After deletion Cronbach’s |
Cronbach’s |
|
|---|---|---|---|---|---|---|
| Supply chain flexibility (SCF) | New product flexibility (SCF1) | SCF11 | 0.6073 | 0.8823 | 0.8864 | 0.8687 |
| SCF12 | 0.6445 | 0.9355 | ||||
| SCF13 | 0.6302 | 0.8852 | ||||
| SCF14 | 0.5203 | 0.8673 | ||||
| Procurement flexibility (SCF2) | SCF21 | 0.6288 | 0.8718 | 0.8646 | ||
| SCF22 | 0.7889 | 0.8969 | ||||
| SCF23 | 0.6625 | 0.9115 | ||||
| SCF24 | 0.8032 | 0.9332 | ||||
| SCF25 | 0.7155 | 0.8995 | ||||
| Product flexibility (SCF3) | SCF31 | 0.7489 | 0.9329 | 0.8247 | ||
| SCF32 | 0.6441 | 0.8791 | ||||
| SCF33 | 0.7799 | 0.9149 | ||||
| SCF34 | 0.7236 | 0.8756 | ||||
| Delivery flexibility (SCF4) | SCF41 | 0.7124 | 0.9174 | 0.8306 | ||
| SCF42 | 0.7781 | 0.9301 | ||||
| SCF43 | 0.7875 | 0.9085 | ||||
| SCF44 | 0.8420 | 0.9410 | ||||
| Information system flexibility (SCF5) | SCF51 | 0.5991 | 0.9091 | 0.8583 | ||
| SCF52 | 0.8380 | 0.9170 | ||||
| SCF53 | 0.7736 | 0.8816 | ||||
| SCF54 | 0.6873 | 0.8753 | ||||
| SCF55 | 0.5390 | 0.8820 | ||||
For the scales in this paper, both supply chain flexibility and enterprise performance use mature scales, so they have good content validity. The scale of big data analyzing ability is also revised on the basis of the scales of previous studies, which also has good content validity. The measurement of construct validity was mainly conducted by factor analysis. Before conducting exploratory factor analysis, KMO test and Bartlett’s sphericity test were first performed to determine whether the data were suitable for factor analysis. If the KMO value is above 0.9, the data is very suitable for factor analysis, and above 0.8 is more suitable for factor analysis. Meanwhile, Bartlett’s spherical test result reaches the significant level, i.e. Sig.<0.05, the data has good correlation and is suitable for factor analysis.
The results of KMO and Bartlett spherical test of big data analysis ability are shown in Table 7, and its total variance explained statistics are shown in Table 8. The KMO value of big data analysis ability is 0.861 and the significance coefficient of Bartlett’s spherical test is 0.000, indicating that the data are suitable for factor analysis. After extracting the factors with eigenvalues greater than 1, all the question items were aggregated into 3 factors, and the cumulative explanation rate of the 3 factors reached 71.5138%. Therefore, it can be assumed that the Big Data Analytics Energy Scale is qualified for factor analysis.
The results of KMO and Bartlett’s Spherical Test of Supply Chain Flexibility Scale are shown in Table 9, and its total variance explained statistics are shown in Table 10.The KMO value is 0.837 and the significance coefficient of Bartlett’s Spherical Test is 0.000, which indicates that the data are suitable for factor analysis. After extracting the factors with eigenvalues greater than 1, all the question items were aggregated into five factors, and the cumulative explanation rate of the five factors reached 75.4298%. Therefore, it can be considered that the Supply Chain Flexibility Scale has the conditions for factor analysis.
The corporate performance KMO and Bartlett spherical test, and the total variance explained statistics are shown in Table 11 and Table 12, respectively. The KMO value of the corporate performance measurement tool used in this paper is 0.858, and the significance coefficient of the Bartlett’s spherical test is 0.000, indicating that the data are suitable for factor analysis. After extracting the factors with eigenvalues greater than 1, all the question items were aggregated into 2 factors, and the cumulative explanation rate of the 2 factors reached 73.6526%. Therefore, it can be concluded that the Enterprise Performance Scale is qualified for factor analysis.
KMO and Bartlett Test of Big Data Analysis Capability
| KMO and Bartlett sphericity test | ||
|---|---|---|
| KMO measures adequacy of sampling | 0.861 | |
| Bartlett sphericity test | Approximate chi-square | 785.342 |
| Df | 135 | |
| Sig. | 0.000 | |
Total Variance Explained of Big Data Analysis Capability
| Factor | Initial eigenvalue | Extract sum of squares and load | ||||
|---|---|---|---|---|---|---|
| Total | Variation% | Cumulative % | Total | Variation% | Cumulative % | |
| 1 | 7.6703 | 49.0995 | 49.0995 | 7.6703 | 49.0995 | 49.0995 |
| 2 | 2.3125 | 14.7197 | 63.8192 | 2.3125 | 14.7197 | 63.8192 |
| 3 | 1.2198 | 7.6946 | 71.5138 | 1.2198 | 7.6946 | 71.5138 |
| 4 | 0.8230 | 5.5841 | 77.0979 | |||
| 5 | 0.6382 | 4.1689 | 81.2668 | |||
| 6 | 0.4696 | 3.0857 | 84.3525 | |||
| 7 | 0.4316 | 2.8568 | 87.2093 | |||
| 8 | 0.4001 | 2.4866 | 89.6959 | |||
| 9 | 0.2917 | 2.006 | 91.7019 | |||
| 10 | 0.2690 | 1.9935 | 93.6954 | |||
| 11 | 0.2530 | 1.6704 | 95.3658 | |||
| 12 | 0.2129 | 1.4801 | 96.8459 | |||
| 13 | 0.2070 | 1.2864 | 98.1323 | |||
| 14 | 0.1005 | 0.974 | 99.1063 | |||
| 15 | 0.0907 | 0.8937 | 100.0000 | |||
KMO and Bartlett Test of Supply Chain Flexibility
| KMO and Bartlett sphericity test | ||
|---|---|---|
| KMO measures adequacy of sampling | 0.837 | |
| Bartlett sphericity test | Approximate chi-square | 1080.533 |
| Df | 234 | |
| Sig. | 0.000 | |
Total Variance Explained of Supply Chain Flexibility
| Factor | Initial eigenvalue | Extract sum of squares and load | ||||
|---|---|---|---|---|---|---|
| Total | Variation% | Cumulative % | Total | Variation% | Cumulative % | |
| 1 | 7.8453 | 36.7231 | 36.7231 | 7.8453 | 36.7231 | 36.7231 |
| 2 | 4.3710 | 20.0144 | 56.7375 | 4.3710 | 20.0144 | 56.7375 |
| 3 | 1.8433 | 8.3794 | 65.1169 | 1.8433 | 8.3794 | 65.1169 |
| 4 | 1.2137 | 5.7011 | 70.8180 | 1.2137 | 5.7011 | 70.8180 |
| 5 | 1.0580 | 4.6118 | 75.4298 | 1.0580 | 4.6118 | 75.4298 |
| 6 | 0.7835 | 3.7012 | 79.1310 | |||
| 7 | 0.5294 | 2.4963 | 81.6273 | |||
| 8 | 0.4905 | 2.4440 | 84.0713 | |||
| 9 | 0.4826 | 2.1544 | 86.2257 | |||
| 10 | 0.3701 | 1.9600 | 88.1857 | |||
| 11 | 0.3553 | 1.8825 | 90.0682 | |||
| 12 | 0.3132 | 1.5074 | 91.5756 | |||
| 13 | 0.2756 | 1.3818 | 92.9574 | |||
| 14 | 0.2224 | 1.3044 | 94.2618 | |||
| 15 | 0.1979 | 1.0637 | 95.3255 | |||
| 16 | 0.2907 | 1.0399 | 96.3654 | |||
| 17 | 0.1806 | 0.9884 | 97.3538 | |||
| 18 | 0.1326 | 0.7926 | 98.1464 | |||
| 19 | 0.0836 | 0.5862 | 98.7326 | |||
| 20 | 0.0793 | 0.5364 | 99.2690 | |||
| 21 | 0.0678 | 0.3854 | 99.6544 | |||
| 22 | 0.0515 | 0.3456 | 100.0000 | |||
KMO and Bartlett Test of Firm Performance
| KMO and Bartlett sphericity test | ||
|---|---|---|
| KMO measures adequacy of sampling | 0.858 | |
| Bartlett sphericity test | Approximate chi-square | 422.805 |
| Df | 39 | |
| Sig. | 0.000 | |
Total Variance Explained of Firm Performance
| Factor | Initial eigenvalue | Extract sum of squares and load | ||||
|---|---|---|---|---|---|---|
| Total | Variation% | Cumulative % | Total | Variation% | Cumulative % | |
| 1 | 5.2155 | 58.6864 | 58.6864 | 5.2155 | 58.6864 | 58.6864 |
| 2 | 1.1438 | 14.9662 | 73.6526 | 1.1438 | 14.9662 | 73.6526 |
| 3 | 0.6628 | 8.1228 | 81.7754 | |||
| 4 | 0.4656 | 5.2589 | 87.0343 | |||
| 5 | 0.3335 | 4.3841 | 91.4184 | |||
| 6 | 0.2958 | 3.7094 | 95.1278 | |||
| 7 | 0.2378 | 2.8466 | 97.9744 | |||
| 8 | 0.1616 | 2.0256 | 100.0000 | |||
In conclusion, it can be seen that the questionnaire of this study showed good reliability and validity in the pre-test research and can be used in the formal research.
In order to ensure the representativeness of the data, before the empirical analysis, the 264 valid samples recovered were subjected to general collation statistics, and the results are shown in Table 13. From the results, the position is mainly the manager of the company. The age of the company is mainly more than 5 years (87.5%). In terms of company ownership, private companies accounted for the largest share of 64.77%. In terms of industry distribution, manufacturing companies accounted for the largest proportion at 45.83%. The largest percentage of company capitalization is in not more than 10 million yuan, which is 38.26%. Therefore, it can be considered that the representation of the data collected in this paper is good to a certain extent.
Descriptive statistics of the samples
| Information | Type | Frequency | % | Cumulative % |
|---|---|---|---|---|
| Gender | Male | 121 | 45.83 | 45.83 |
| Female | 143 | 54.17 | 100 | |
| Position | Senior manager | 31 | 11.74 | 11.74 |
| Middle manager | 99 | 37.50 | 49.24 | |
| Grass-roots manager | 130 | 49.24 | 98.48 | |
| Other personnel | 4 | 1.52 | 100.00 | |
| Establishment period | Less than 3 years | 9 | 3.41 | 3.41 |
| 3-5 years | 24 | 9.09 | 12.50 | |
| 5-10 years | 67 | 25.38 | 37.88 | |
| 10-20 years | 101 | 38.26 | 76.14 | |
| More than 20 years | 63 | 23.86 | 100.00 | |
| Nature of company | State-owned enterprise | 48 | 18.18 | 18.18 |
| Joint venture | 31 | 11.74 | 29.92 | |
| Private enterprise | 171 | 64.77 | 94.70 | |
| Foreign-funded enterprise | 10 | 3.79 | 98.48 | |
| Other | 4 | 1.52 | 100.00 | |
| Industry category | Manufacturing industry | 121 | 45.83 | 45.83 |
| Service industry | 61 | 23.11 | 68.94 | |
| High-tech industry | 59 | 22.35 | 91.29 | |
| Other | 23 | 8.71 | 100.00 | |
| Personnel size | Less than 100 | 63 | 23.86 | 23.86 |
| 101-500 | 141 | 53.41 | 77.27 | |
| 501-1000 | 33 | 12.50 | 89.77 | |
| 1001-500 | 21 | 7.95 | 97.73 | |
| More than 5000 | 6 | 2.27 | 100.00 | |
| Corporate capital | Less than 10 million | 101 | 38.26 | 38.26 |
| 10.1-50 million | 67 | 25.38 | 63.64 | |
| 50.01-100 million | 71 | 26.89 | 90.53 | |
| 100.01- 500 million | 23 | 8.71 | 99.24 | |
| More than 500 million | 2 | 0.76 | 100.00 |
Table 14 shows the descriptive statistical analysis of the variables, which demonstrates the descriptive statistical results of the independent variable (firms’ big data analytics capabilities), the mediator variable (supply chain flexibility), and the dependent variable (firms’ performance), with a total sample of 264, for the extremes, means, and standard deviations. The results show that the data collected in this study are good. In particular, the mean values of market performance and operational performance in enterprise performance are 5.7819 and 5.7858, respectively, which are in line with the actual situation, and the statistical results of the variables have a certain degree of credibility.
Descriptive statistics of variables
| Variable | N | Minimum | Maximum | Mean | SD | ||
|---|---|---|---|---|---|---|---|
| Dependent variable | Enterprise performance | EP1 | 264 | 3.2505 | 7.0000 | 5.7819 | 0.7206 |
| EP2 | 264 | 2.7510 | 7.0000 | 5.7858 | 0.6347 | ||
| Independent variable | Big data analysis ability | BDAC1 | 264 | 3.8234 | 7.0000 | 5.7305 | 0.6782 |
| BDAC2 | 264 | 3.6761 | 7.0000 | 5.7912 | 0.6833 | ||
| BDAC3 | 264 | 3.5681 | 6.9342 | 5.7548 | 0.6359 | ||
| Mediation variable | Supply chain flexibility | SCF1 | 264 | 4.0000 | 7.0000 | 5.9595 | 0.7225 |
| SCF2 | 264 | 4.0000 | 7.0000 | 5.7814 | 0.7019 | ||
| SCF3 | 264 | 4.0000 | 7.0000 | 5.6533 | 0.8912 | ||
| SCF4 | 264 | 4.0000 | 7.0000 | 5.7316 | 0.7437 | ||
| SCF5 | 264 | 4.0000 | 7.0000 | 5.5051 | 0.7553 | ||
In this section, the structural model (inner model) in the structural equation modeling is tested, which in turn verifies whether the influence relationship in the hypothesis is valid. Subsequently, the mediating role in the hypotheses is further tested and explained with reference to the testing procedure for mediating effects.
Before testing the path coefficients in the structural model, this paper first provides a discriminative description of the fitness and validity of the structural model.
Regarding the fitness of the structural model, the index provided by SmartPLS software is the SRMR value. When the SRMR value is less than 0.08, it indicates that the fitness of the model is good. In this paper, the software’s PLS algorithm is used to calculate the SRMR value, and the result shows that the SRMR value is 0.071 < 0.08, which indicates that the fitness of this model is good.
Regarding the validity of the structural model, the software provides
First, this paper utilizes the software’s PLS algorithm to calculate the
Subsequently, this paper utilizes the software’s Blindfolding algorithm to calculate
Finally, in order to ensure the accuracy of the regression between the latent variables, this paper also calculated the covariance statistic (VIF) corresponding to each measurement question item using the PLS algorithm of the software. The results show that the VIF value corresponding to each question item is less than 3.5, which is within the suggested threshold (less than 5), indicating that there is no covariance problem in this model.
The structural equation model, i.e. PLS-SEM, constructed in this paper using SmartPLS software is shown in Fig. 6, which is composed of a measurement model and a structural model. After completing the discriminative description of the fitness and validity of the structural model, this paper utilizes the Bootstrapping function of the software to test the path coefficients of the structural model and its significance. Among them, the Bootstrapping function mainly uses the random sampling of the observations therein from the original dataset by pulling out and putting back to create a sub-sample, and the number of sampling times is set to 1000 in this study.
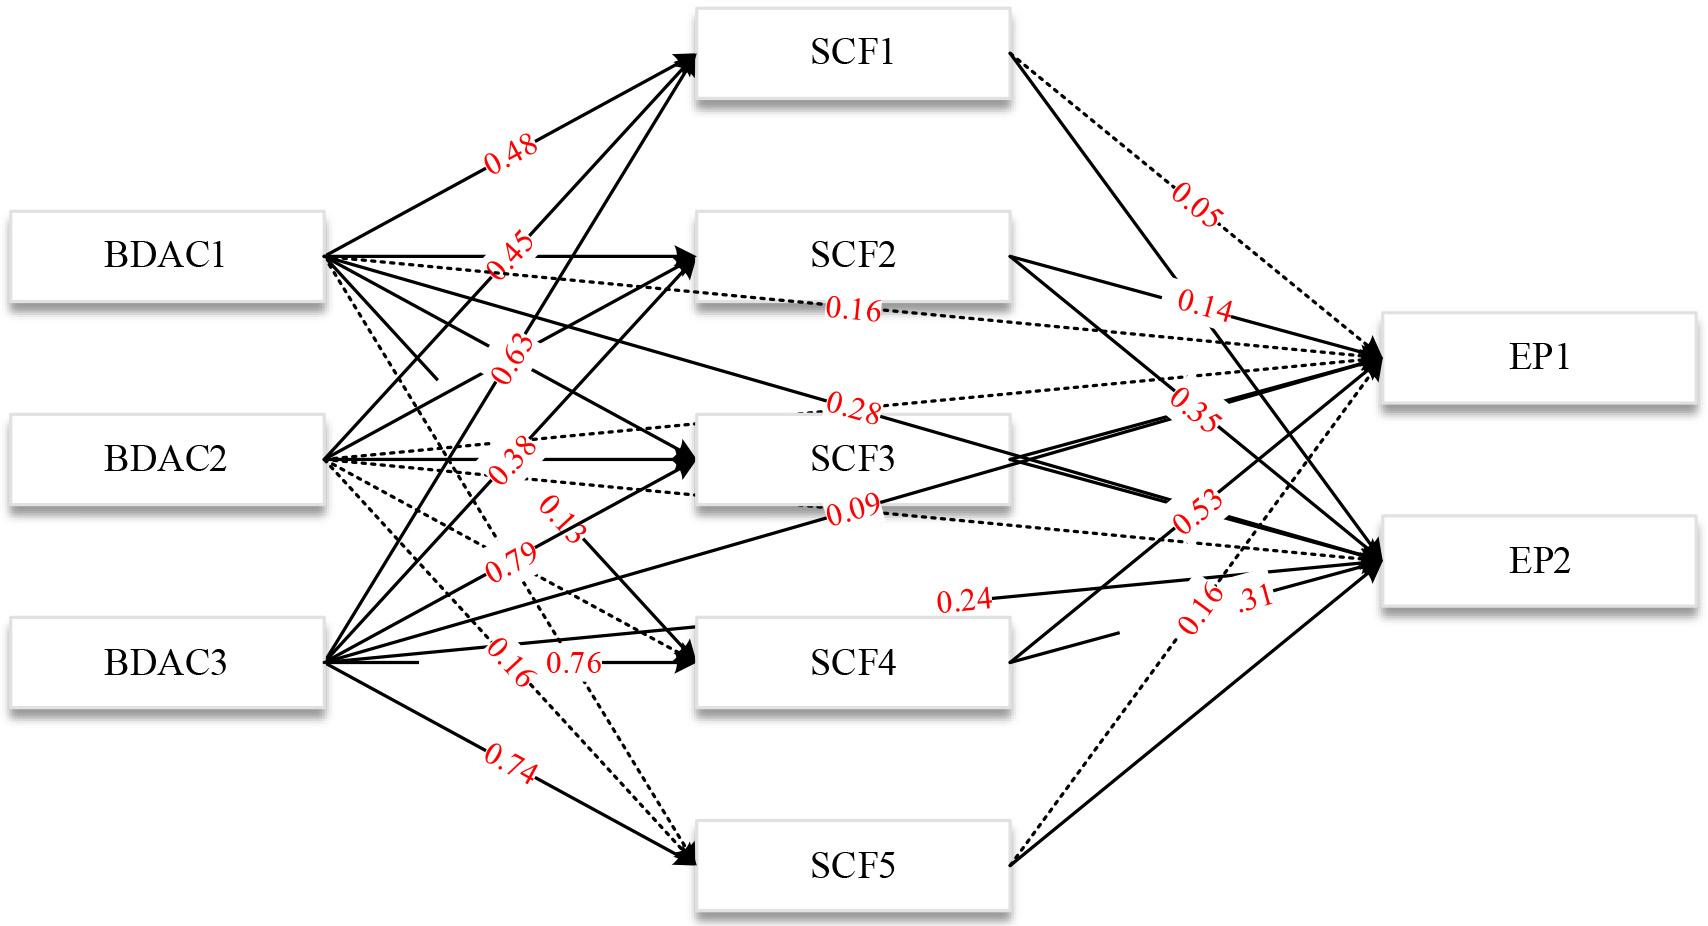
Structural equation model
The results of the path coefficient test of the impact relationship are shown in Table 15. Regarding the test results of H1, between big data analytics capability and supply chain flexibility, it presents a significance at the 0.001 level (standardized coefficient
Test results of the path coefficients affecting the relationship
| Path | S.E. | C.R. | P | Result | ||
|---|---|---|---|---|---|---|
| H1 | BDAC → SCF | 0.441 | 0.081 | 5.735 | 0.000 | Support |
| H2 | BDAC → SCF1 | 0.448 | 0.098 | 5.551 | 0.000 | Support |
| H3 | BDAC → SCF2 | 0.637 | 0.075 | 6.637 | 0.000 | Support |
| H4 | BDAC → EP | 0.481 | 0.105 | 4.388 | 0.000 | Support |
| H5 | SCF → EP | 0.432 | 0.114 | 3.251 | 0.008 | Support |
| H6 | SCF1 → EP | 0.386 | 0.045 | 2.667 | 0.004 | Support |
| H7 | SCF2 → EP | 0.503 | 0.091 | 2.735 | 0.009 | Support |
The standardized coefficient
This paper sequentially tests the mediating role of supply chain flexibility between big data analytics capabilities and firm performance based on the testing procedure for mediating effects. The test of mediating effect includes the following steps:
In the first step, model 1, i.e., the total effect c and its significance between big data analytic capability and firm performance, is tested.
In the second step, model 2, i.e., the regression coefficient a of big data analytic capability on supply chain flexibility and its significance, is tested.
In the last step, model 3 is tested, i.e., both the direct effect
The results of the mediating effect analysis are shown in Table 16, which shows that the mediating variable, supply chain flexibility, plays a partial mediating effect in the effect of big data analytic capability on enterprise performance, and its effect value is 0.237. Therefore, supply chain flexibility plays a mediating role between big data analytic capability and enterprise performance, and hypothesis H8 is valid. The effect values of process flexibility and logistics flexibility between big data analytic capability and firm performance are 0.041 (35.02%) and 0.154 (64.98%), respectively, and hypotheses H9 and H10 hold.
Results of mediation analysis
| Path | SE | Effect value | Bias-corrected 95% CI | P | Ratio of total effect | ||
|---|---|---|---|---|---|---|---|
| Lower | Upper | ||||||
| H8 | BDAC → SCF → EP | 0.081 | 0.237 | 0.105 | 0.449 | 0.003 | 100% |
| H9 | BDAC → SCF1 → EP | 0.041 | 0.083 | 0.015 | 0.142 | 0.021 | 35.02% |
| H10 | BDAC → SCF2 → EP | 0.083 | 0.154 | 0.031 | 0.385 | 0.031 | 64.98% |
This study explores the structural dimensions of big data analytic capabilities of enterprises, the impact of big data analytic capabilities on enterprise performance, and the mediating effect of supply chain flexibility. First, based on the resource-based theory and dynamic capability theory, the structural dimensions of big data capability in this paper are defined on the basis of the previous structural dimensions of big data capability, which are the capability of big data basic resources, the capability of big data technology utilization, and the capability of big data management application. After that, the research model of this paper is established by analyzing the relationship between big data analysis capability, supply chain flexibility and enterprise performance. Finally, the data are collected by questionnaire survey method and the influence mechanism of big data analyzing ability on enterprise performance is explored. The main research conclusions of this paper are as follows:
1) Between big data analytics capabilities and supply chain flexibility, presenting a significance at the 0.001 level (standardized coefficient 2) The standardized coefficient between big data analytic capability and enterprise performance is 0.481, which presents a significance at the 0.001 level (p=0.000<0.001), indicating that big data analytic capability has a significant positive effect on enterprise performance. 3) Supply chain flexibility plays a partial mediating effect in the influence of big data analytic capability on enterprise performance, with an effect value of 0.237. Process flexibility and logistics flexibility account for 0.041 (35.02%) and 0.154 (64.98%) of the total effect in it, indicating that logistics flexibility has a greater influence on this path.
In summary, this paper reveals the “black box” of the value creation mechanism of big data analytics capability from the perspective of supply chain flexibility, i.e., supply chain flexibility plays an intermediary role in the process of big data capability affecting enterprise performance, which provides theoretical guidance for enterprises’ unique competitive advantage.