Fusion of RF algorithm and logistic regression model for high-speed illegal toll evasion vehicle inspection

Pubblicato online: 17 mar 2025
Ricevuto: 19 ott 2024
Accettato: 15 feb 2025
DOI: https://doi.org/10.2478/amns-2025-0182
Parole chiave
© 2025 Haiyan Wu, published by Sciendo
This work is licensed under the Creative Commons Attribution 4.0 International License.
Highway tolls emphasize that consumers need to pay when they pass through the highway, and consumers regard the highway as a special commodity, so in order to guarantee to meet the needs of consumers, the quality of the highway needs to be highly valued [1-2]. At the same time, the effective collection of highway tolls is beneficial to enhance the economic development gains, reduce the cost of road repair expenditure burden, to ensure the scientific and effective economic development, and to improve the construction funds of road network environment [3-4]. And some highway users in the economic interests of the drive, take all kinds of means to refuse to pay, escape payment, underpayment of tolls. A large number of vehicles in order to avoid paying tolls to take illegal means, resulting in the increase of car accident accident rate, at the same time, breaking the stable highway toll standards and norms, resulting in the destruction of the market [5-7]. In addition to this, high-speed illegal toll evasion vehicles also reduce the economic benefits that should have been obtained before the highway operating units and construction and investment bodies, contrary to the principle of development, and undermine the goal of sustainable development of highways [8-10]. This not only reflects the lack of road users’ sense of integrity and legal knowledge, which is not conducive to creating a good social environment, but also brings hidden dangers to social security [11]. However, due to the high number of highways, the management is difficult and the lack of strict management system, which leads to the phenomenon of toll evasion intensified, hindering the development of highways. Restricted by the development of the real conditions and the impact of the difficulty of guaranteeing the good development and management of the highway, the phenomenon of toll evasion on the highway has intensified, and even presented the characteristics of organization and specialization, and should pay attention to strengthening the corresponding management efforts [12-14].
Although some current research has attempted to use data mining techniques to identify TEVs, they are often restricted to a single algorithm or model, thereby not fully utilizing the advantages of multi-algorithm fusion. In addition, due to the complexity and diversity of TEB, it is difficult for a single model to fully capture the characteristics of TEB, resulting in limited prediction accuracy and generalization ability. Given these challenges, this study constructs a fusion model, RF-logit-BPNN, based on RF, LR, and Back Propagation Neural Network (BPNN), aiming to perfect the recognition performance of TEV by leveraging the complementary advantages of algorithms. The innovation of this study lies in the fusion of RF, LR, and BPNN algorithms, using RF for feature selection, LR for probability prediction, and BPNN for type recognition, fully leveraging the advantages of each algorithm. By adopting Min-Max Standardization (Min-Max-S) and type variable virtualization, the dimensional differences and numerical spans between attributes of the data have been effectively eliminated, improving the comparability of the data and the model’s accuracy. A detailed classification of TEB is carried out, and based on this, a TEV model is designed, which improves the pertinence and practicality of the model.The paper offers a new technological path for TEV recognition and provides useful reference for intelligent highway management.
The primary goal of data standardization is to reduce the issues caused by unit differences between different attributes and large numerical spans between the same attributes.To reduce significant biases in the data, it is necessary to limit the data to a narrow interval when building a model, with the goal of improving the accuracy of the Euclidean distance calculation algorithm. In the process of in-depth analysis of highway traffic data, the inconsistency of data units and the wide range of attribute values may have a significant impact on the accuracy of constructing TEV detection models. It is particularly important to standardize abnormal charging data to ensure that the model can accurately identify TEB.Firstly, this study requires data preprocessing, including data cleaning, handling missing values, and outlier detection.During the data cleansing process, this study will identify and correct any erroneous or inconsistent data records, or delete them entirely.Next, this study will standardize the data to eliminate significant differences in attribute value ranges. The basic idea of using the Min-Max-S is to use a specific algorithm to compress the numerical range of data attributes into the range of 0 to 1. The maximum value of the data is set to 1, and the minimum is set to 0. This method is easy to operate and can adjust attribute data through linear transformation to adapt to the characteristics of non-normal distribution data [15-16]. The specific calculation is shown in equation (1).
In equation (1),
In equation (2),
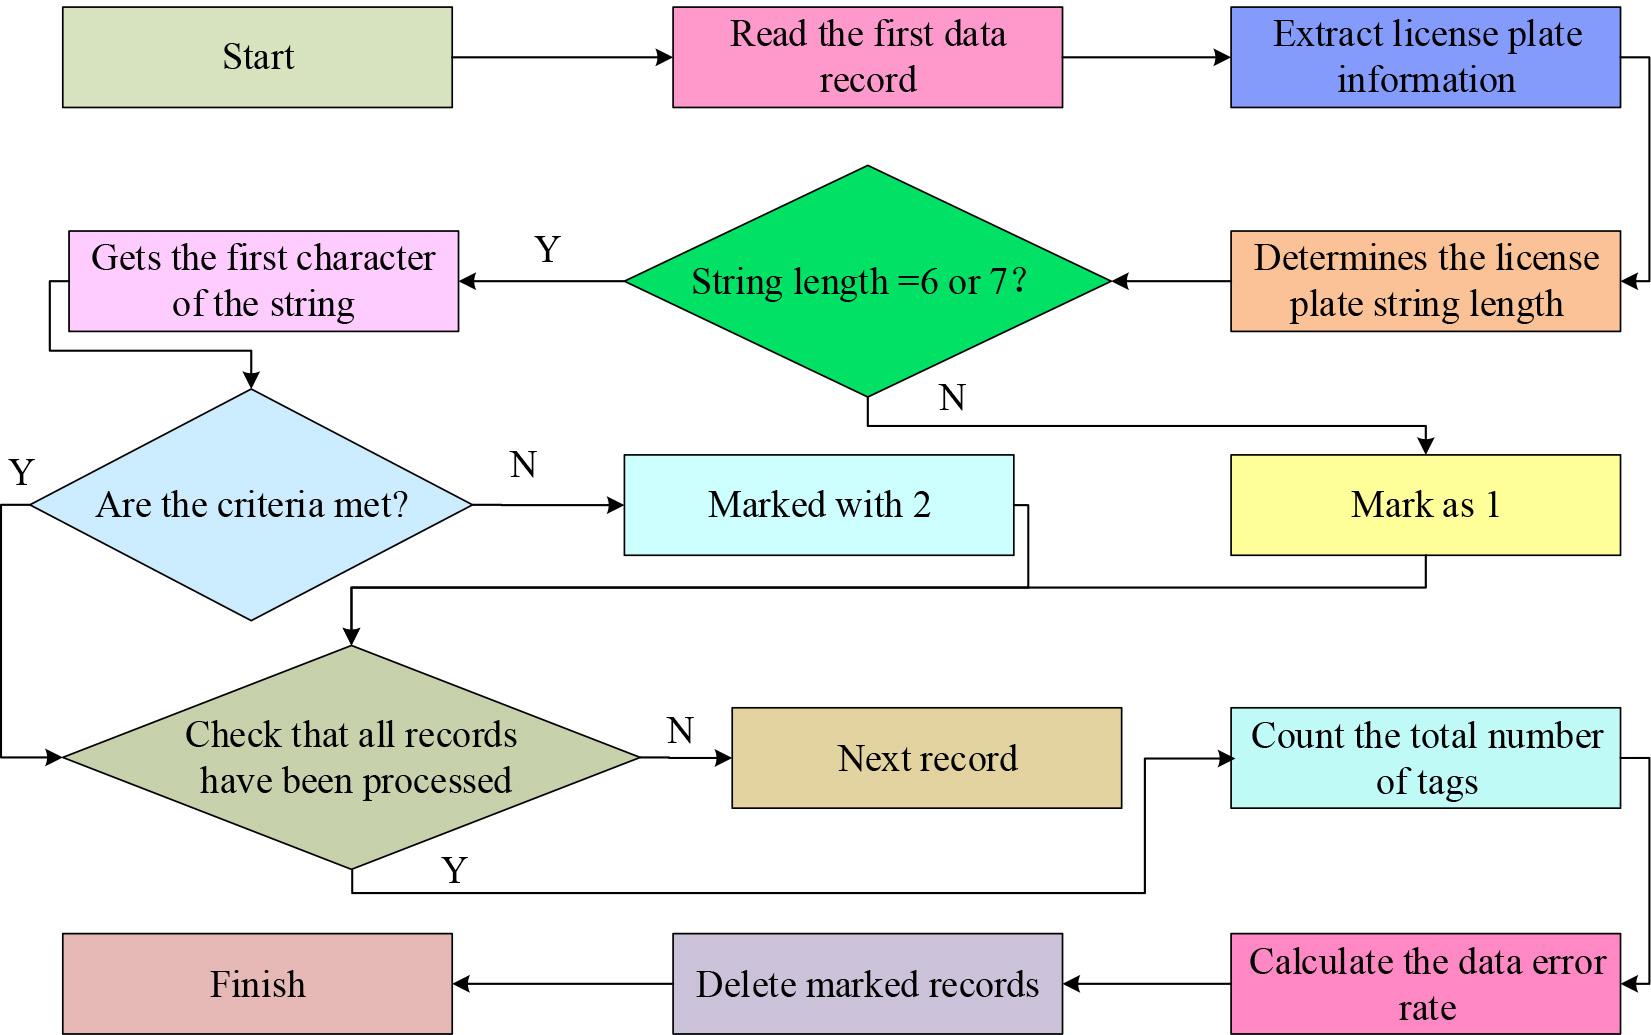
Flowchart of data cleaning
Figure 1 depicts an automated method for cleaning license plate numbers that are incorrect. It starts by reading data records, extracting license plate number strings, and checking if their length meets the standard. Records that do not match will be marked. Next, records that meet the length requirements will be further checked to see if the first character of the license plate number meets the prescribed standards, while those that do not will also be marked. After processing all records, the total number of marked records is counted and the data error rate is calculated. All marked records are ultimately deleted to guarantee the accuracy and quality of the data.
After processing the data of abnormal toll vehicles on highways, this study uses big data technology to screen key information from a large dataset, and uses machine learning technology to establish and analyze models to assist in decision-making. The aim of the research is to identify abnormal toll behavior and develop a efficient TEV recognition system by sorting out toll data on highways. The period of establishing the TEV recognition model is displayed in Figure 2.
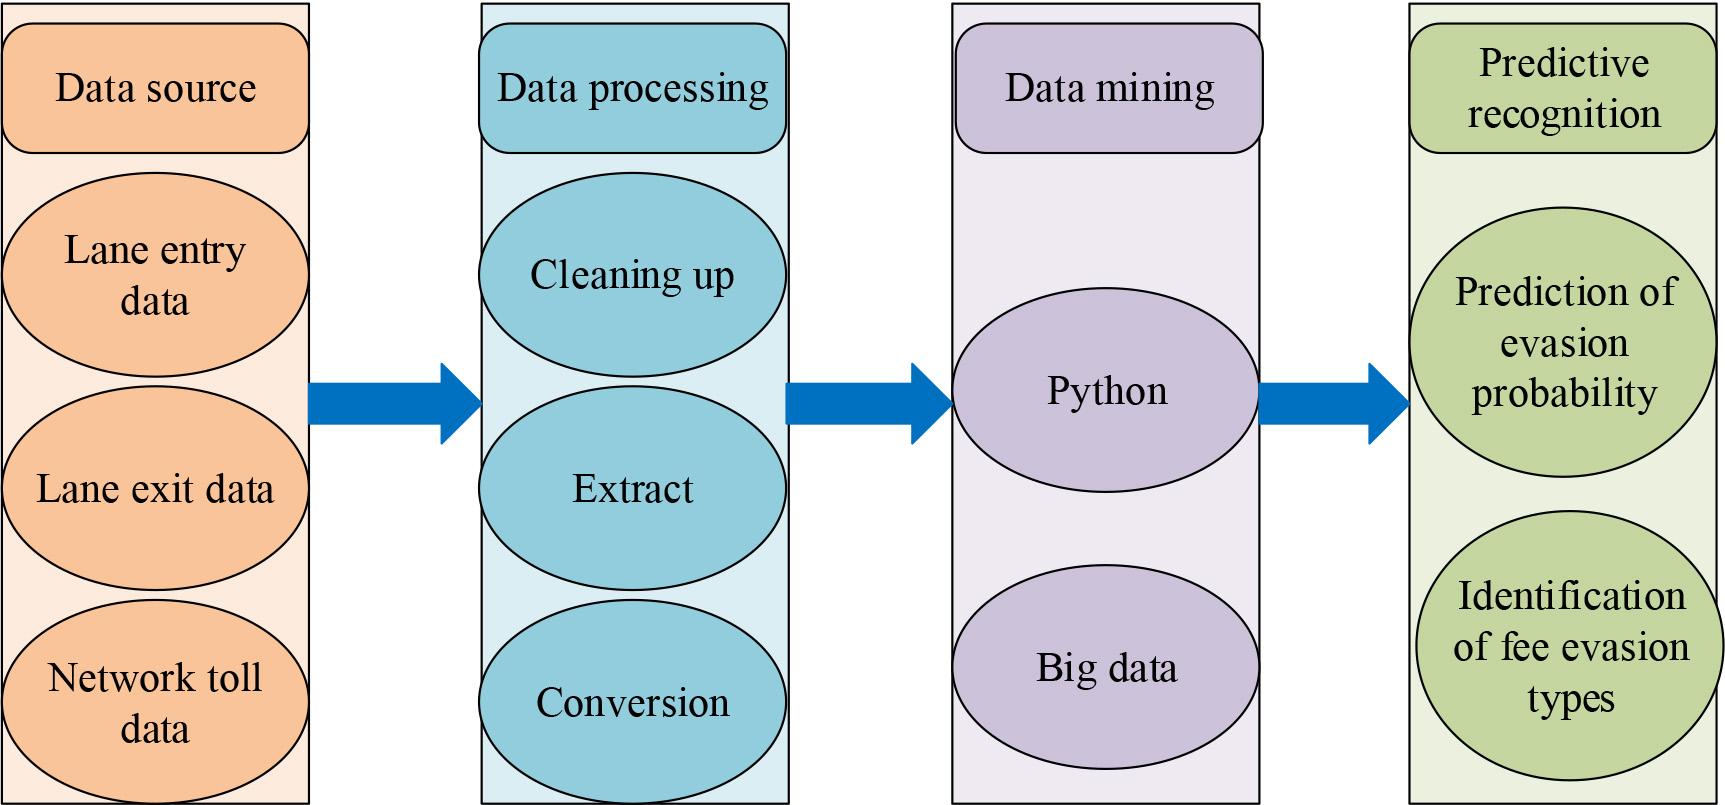
Architecture diagram of vehicle recognition model for toll evasion
In Figure 2, the core steps of the constructed TEV recognition model involve data collection, data preprocessing, feature extraction, and TEB prediction. Firstly, an in-depth analysis is carried out on the toll system of highways, including data acquisition, transmission paths, and billing rules. The avoidance of toll operations was classified into different categories. Subsequently, in the data preparation stage, advanced data analysis techniques are utilized to clean and standardize the payment data format. An in-depth analysis of the features of TEV is conducted and their criticality in identifying TEB is evaluated to ensure the accuracy of data input. Subsequently, in the feature extraction stage, this study utilizes machine learning algorithms to extract key fee evasion features from a large amount of billing data, and optimizes the traditional TEV detection model to establish a more accurate recognition system. Finally, in the prediction phase, the established model is utilized to predict the likelihood of TEV and perform precise TEB identification to determine the specific type of fare evasion. To enhance the objectivity and accuracy of TEV feature extraction, an RF algorithm is introduced for feature selection.RF is an ensemble learning method that constructs multiple datasets for classification or regression, and votes or averages the results to improve prediction accuracy [19-20]. The mathematical expression of RF is shown in equation (3).
In equation (3), RF(
In equation (4),
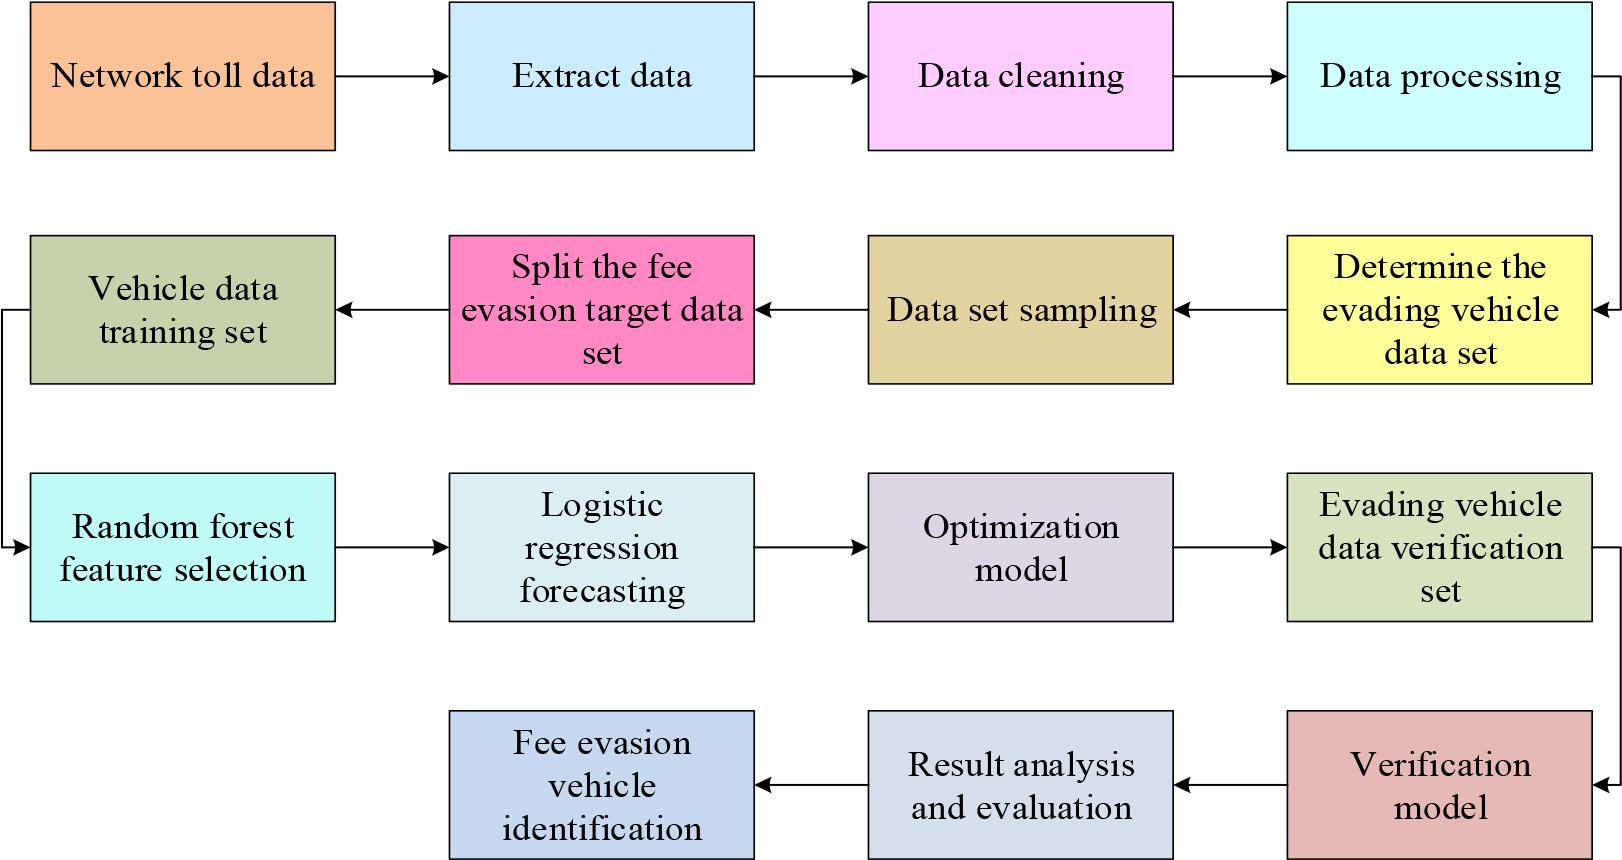
Flowchart of vehicle identification for toll evasion based on RF-logit model
In Figure 3, the evasion target dataset is first determined and split from the networked charging data, and then the data are extracted and cleaned, including normalization and virtualization of type variables. Next, the RF algorithm is used to identify key features that affect TEB. Subsequently, these features are applied to the training and prediction process of the LR model to estimate the likelihood of vehicles evading tolls.
On the basis of constructing a TEV recognition model based on RF-logit, to deeply identify TEVs and analyze and evaluate their prediction results, TEB classification is defined as a multi class prediction problem. Given the outstanding performance of neural networks in handling such problems, this study selects BPNN to identify different evasion patterns of TEVs, in order to establish an accurate recognition model.BPNN is made up of numerous units that are interconnected through a complex network of connections, which simulates the storage function of the human brain. Each connection has a specific weight value, and the unit uses an activation function to determine the output result [21]. Figure 4 shows the structure of the neural unit.
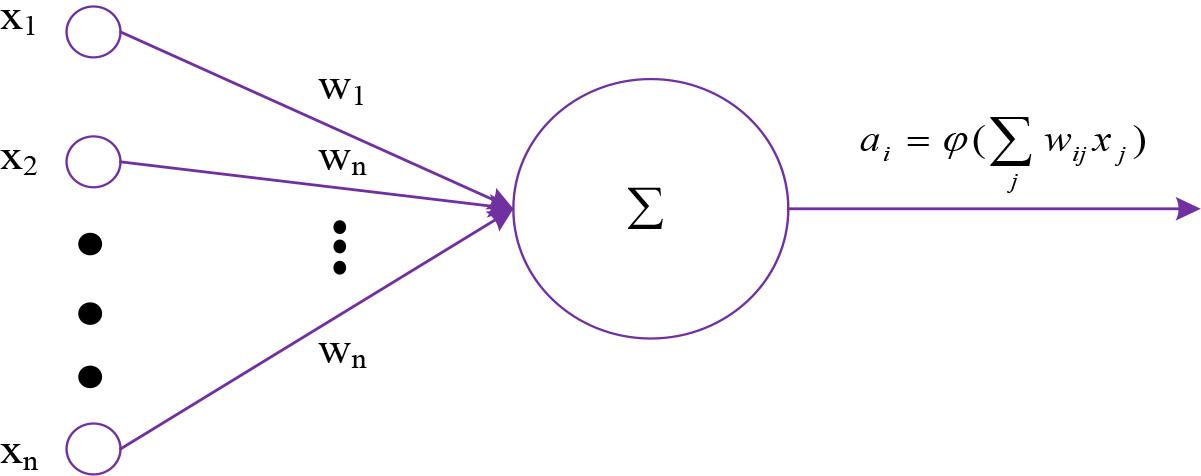
Details of the construction of the neuron
Figure 4 illustrates the input-output relationship of artificial neurons, as shown in equation (5).
In equation (5),
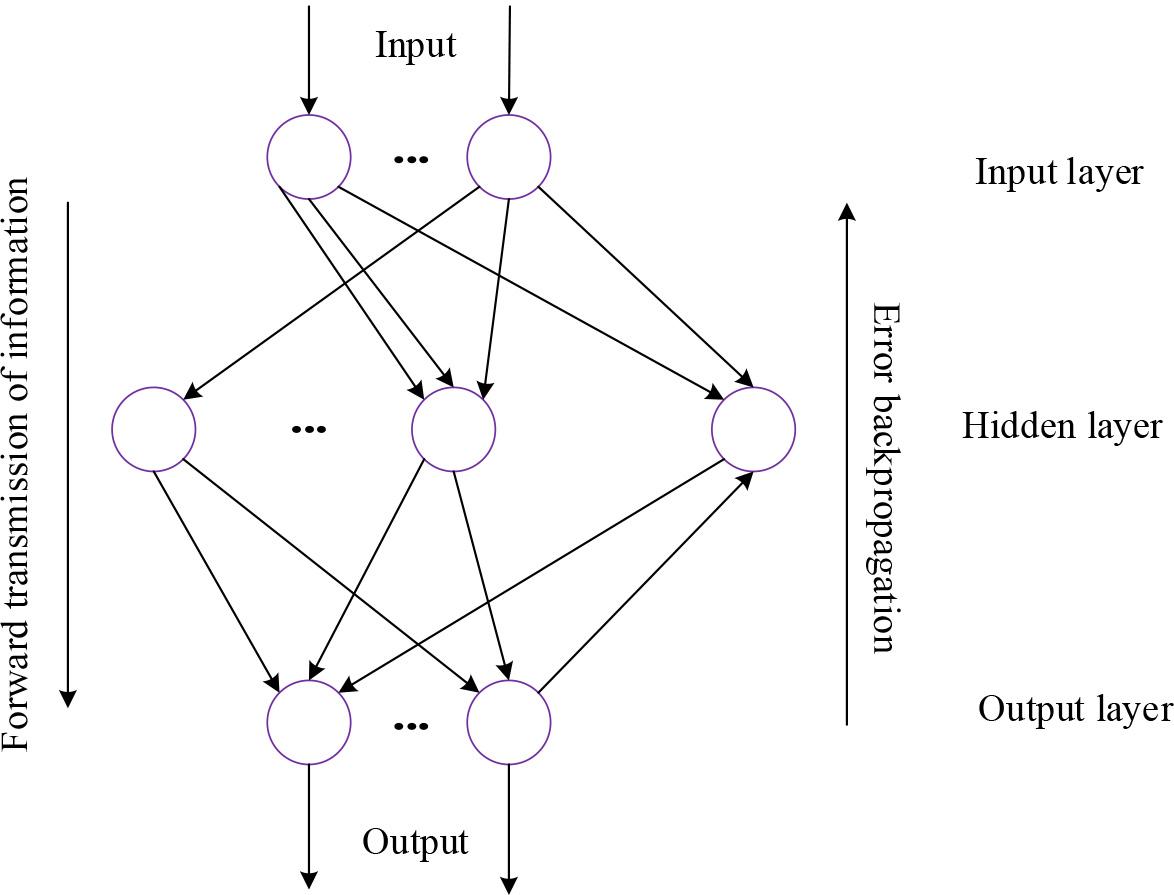
BPNN structure
In Figure 5, during the training and propagation process of BPNN, each layer’s nodes are learned and adjusted through the model. The output function of the hidden layer is given by equation (6).
In equation (6),
In equation (7),
This study first constructs a TEV dataset, performs preliminary cleaning and processing on the data, and then selects and organizes the data built on the data characteristics and the cases of fare evasion recorded at toll stations, based on previous analysis of TEB on highways. Python programming language is used for model construction and data analysis. This study first normalizes the raw data by using the Min-Max-S scheme to scale it to the [0, 1] interval, and virtualizes the type variables to eliminate their impact.The LR’s parameters are optimized using the maximum likelihood estimation method. The BPNN model is trained using gradient descent. The learning rate is 0.1 after 20,000 iterations. Table 1 displays the data specifics of various TEBs.
| Type of fee evasion | Fee evasion | Data quantity |
|---|---|---|
| Imitation category | License plate does not match | 514 |
| Cheating class | U-shape | 52 |
| No card Gear shift | 64 | |
| Change of weight | 96 | |
| Overtime | 152 | |
| Defect class | Excess weight | 78 |
| There is no weight on the weighing table | 45 | |
| Fight one’s way through a pass | 41 | |
| Violation category | Outlet suspension shaft | 32 |
| Inlet suspension shaft | 7 | |
| Inlet weightless | 39 | |
| Fee evasion | 17 |
In Table 1, by analyzing the toll data, twelve types of vehicle information violations are selected and integrated into the TEV dataset, including inconsistent license plates, U-shaped driving, no pass card, gear shifting behavior, abnormal weight measurement data, overtime parking, overloading and exceeding limits, no readings from weighing equipment, forced card punching, abnormal exit axle load, abnormal entrance axle load, and failure to weigh. To verify the performance of the RF-logit-BPNN, it is compared with RF-logit, RF-BPNN, RF+SVM [22], and Gradient Boosting Machine (GBM) [23]. Figure 6 illustrates the accuracy and recall of the five algorithm models.
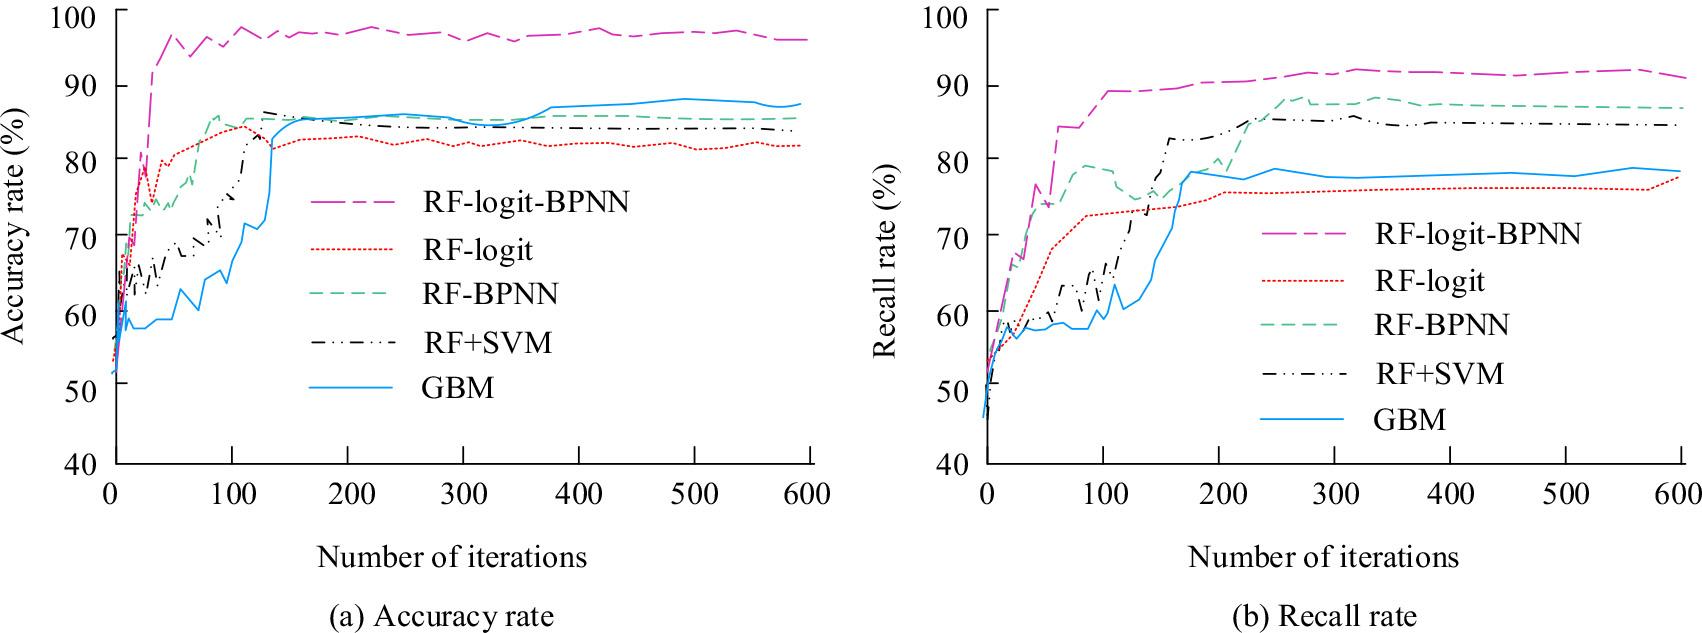
Comparison of accuracy and recall
Figure 6 (a) shows that the RF-logit-BPNN has a higher accuracy rate than other models, ultimately reaching 99%.This indicates that the model can significantly reduce the misclassification of non-TEVs as TEVs when predicting TEVs, thereby effectively improving the accuracy of the prediction.The research model’s advantage in recall rate was demonstrated in Figure 6 (b), with a final recall rate of 92%. This means that the model can successfully identify 92% of actual TEVs, while other models have relatively low recall rates, resulting in more TEVs being missed. The high recall rate of the research model indicates that it is more comprehensive and effective in identifying TEVs, and can minimize misjudgments of TEBs to the greatest extent possible. The error fitting curve between the RF-logit-BPNN model and RF+SVM is shown in Figure 7.
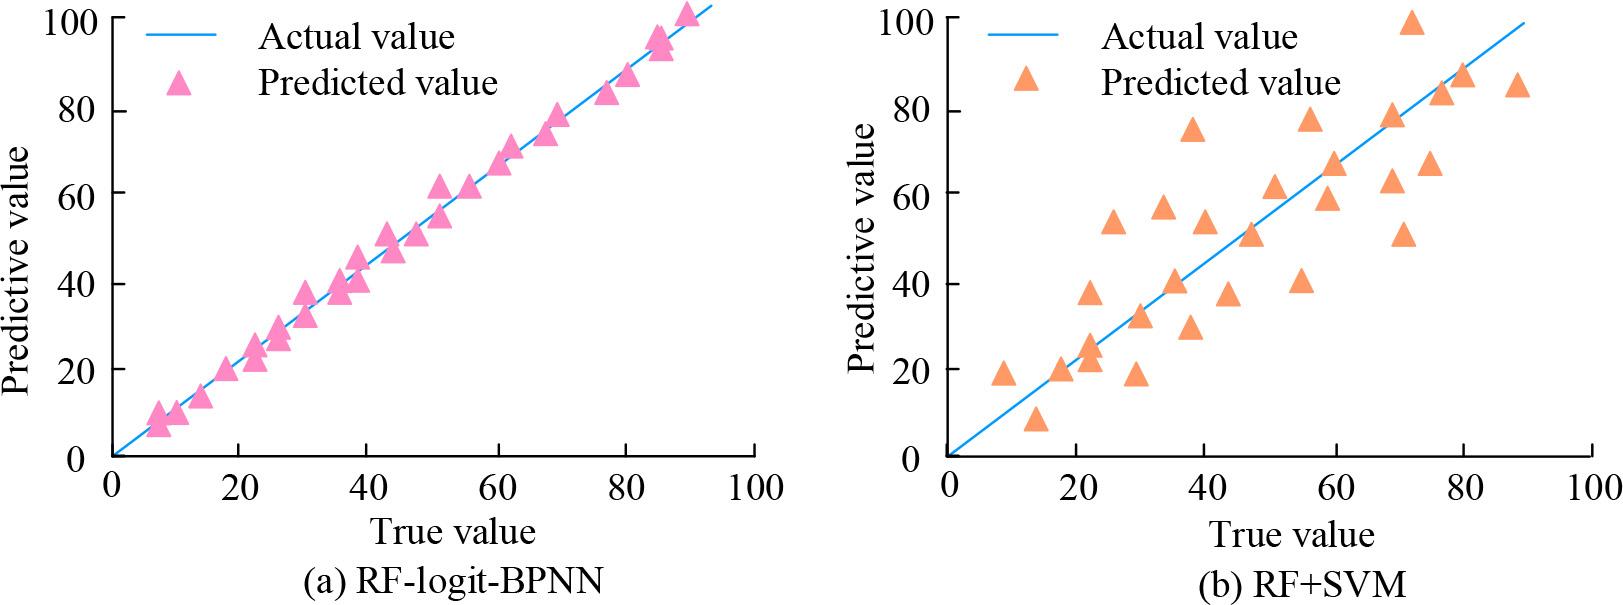
Comparison of error fitting curves
In Figure 7 (a), the fitting degree of the RF-logit-BPNN model reaches over 99%. This high degree of fit means that the model can predict TEV very accurately, and the predicted results are very close to the actual data. This reflects the strong recognition ability of the model for TEB. This indicates that the RF-logit-BPNN can effectively capture relevant patterns and trends when handling TEV inspection tasks on highways. In contrast, in Figure 7 (b), the fitting degree of the RF+SVM is only about 50%, indicating lower accuracy in predicting TEV and an obvious deviation between the predicted results and the real cost evasion situation. RF-logit-BPNN outperforms RF+SVM in fitting, demonstrating its practical application potential in TEV inspection. The high performance of the research model is attributed to its combination of RF feature selection ability, LR classification ability, and BPNN non-linear modeling ability, making it more advantageous in handling complex evasion detection tasks.
to comprehensively evaluate the effectiveness of the RF-logit-BPNN model in detecting high-speed illegal TEVs, it is compared with RF-logit, RF-BPNN, RF+SVM, and GBM. Comparative indicators include prediction accuracy, classification accuracy, inspection time, Mean Squared Error (MSE), Root Mean Squared Error (RMSE), and stability. The final result of normalizing all indicators can be found in Table 2.
| Models | Prediction accuracy | Classification accuracy | Audit time | MSE | RMSE | Stability |
|---|---|---|---|---|---|---|
| RF-logit | 0.88 | 0.87 | 0.86 | 0.89 | 0.77 | 0.85 |
| RF-BPNN | 0.85 | 0.84 | 0.83 | 0.86 | 0.84 | 0.83 |
| RF+SVM | 0.87 | 0.86 | 0.85 | 0.88 | 0.86 | 0.87 |
| GBM | 0.74 | 0.83 | 0.82 | 0.75 | 0.83 | 0.84 |
| RF-logit-BPNN | 0.92 | 0.94 | 0.90 | 0.92 | 0.91 | 0.93 |
In Table 2, the RF-logit-BPNN model shows the optimal performance, with scores above 0.9, significantly better than other models. This indicates that RF-logit-BPNN has high accuracy, efficiency, and stability in TEV inspection tasks, and can be used as an effective tool for highway toll evasion inspection. The Receiver Operating Characteristic (ROC) curves of the RF-logit-BPNN and RF+SVM models for predicting TEV probabilities are shown in Figure 8.
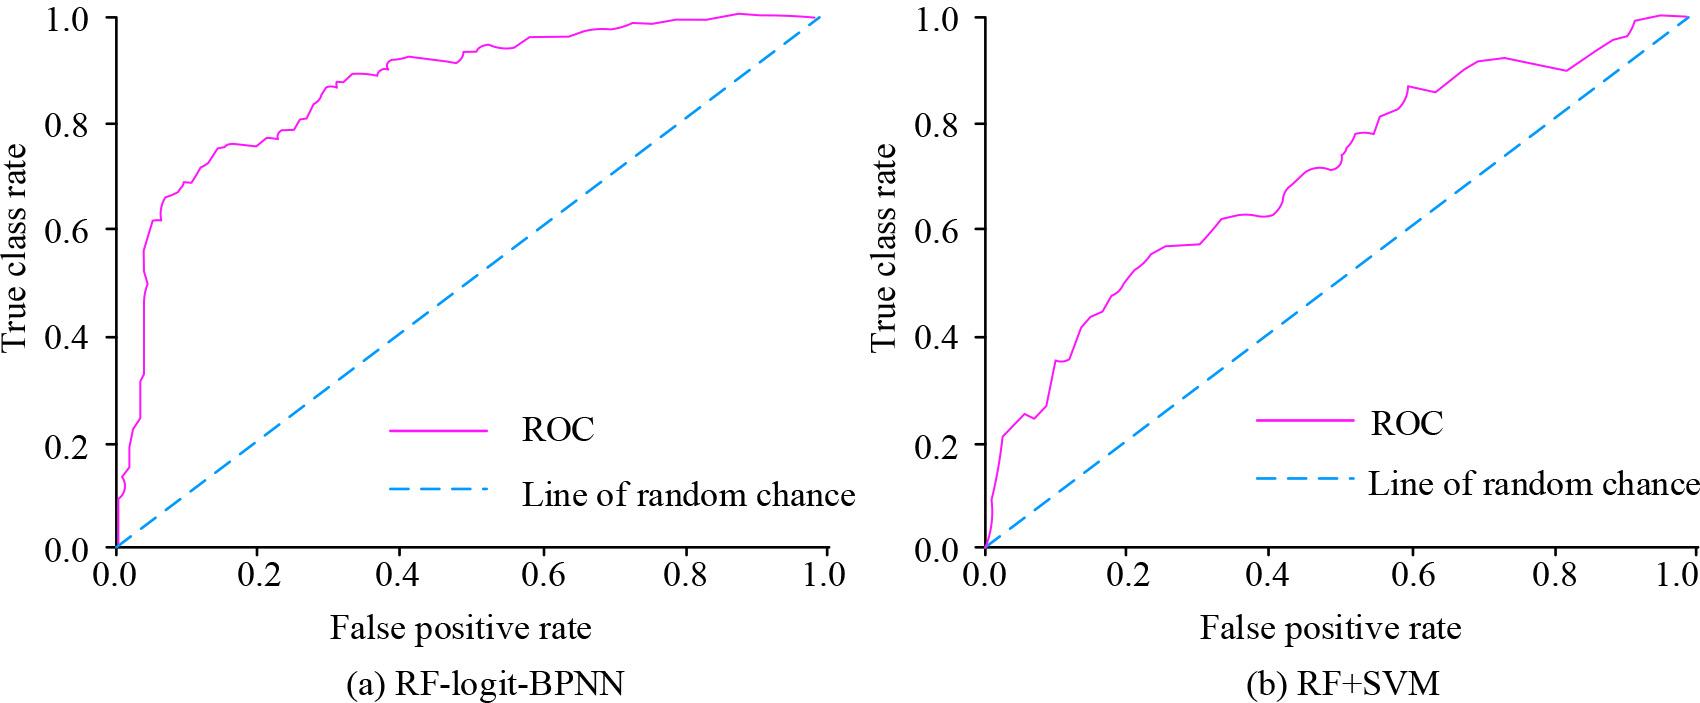
Comparison of ROC curves
In Figure 8 (a), the AUC of the RF-logit-BPNN reaches 0.9, indicating excellent performance in TEV prediction. The research model has demonstrated efficient and reliable predictive ability in TEV recognition. In Figure 8 (b), the AUC of the RF+SVM is only 0.6, indicating its limited performance in predicting TEV. The predictive performance of this model is comparable to random guessing and fails to distinguish between toll evasion and non-TEV. The RF+SVM has certain limitations in capturing data complexity or patterns when dealing with TEV recognition problems.
In response to the increasingly serious problem of TEB on highways, this study proposed a TEV recognition model, RF-logit-BPNN, that integrates RF, LR, and BPNN to improve the accuracy of TEV recognition and inspection efficiency. The RF algorithm was used to identify features that have a significant impact on TEB, and the LR model was utilized to estimate the probability of vehicle fare evasion. Finally, BPNN was used to accurately classify the types of TEB. In the experiment, the prediction accuracy of RF-logit-BPNN reached 92%, indicating that it can correctly identify 92% of TEVs. The model’s recall rate of 94.71% indicates that it can detect 94.71% of actual TEBs. The model’s powerful ability to distinguish between toll evasion and non-TEV was further validated by the AUC value reaching 96%. The efficiency and accuracy of the RF-logit-BPNN model were exemplified by the impressive performance of these key data indicators in recognizing complex TEB. Although the RF-logit-BPNN model performed well in experiments, there are still some shortcomings. For instance, models may exhibit bias when confronted with extreme or anomalous data, and there is still scope for enhancement in real-time updates and adaptation to new data. Future research can further optimize algorithms, improve the model’s ability to handle abnormal data, enhance the model’s real-time update mechanism, and enable it to quickly adapt to new TEB modes.