Design of new energy market indicator system and dynamic risk assessment based on graph neural network: enhancing market monitoring and forecasting capability
, , e
17 mar 2025
INFORMAZIONI SU QUESTO ARTICOLO
Pubblicato online: 17 mar 2025
Ricevuto: 25 ott 2024
Accettato: 04 feb 2025
DOI: https://doi.org/10.2478/amns-2025-0165
Parole chiave
© 2025 Xiaolu Wang et al., published by Sciendo
This work is licensed under the Creative Commons Attribution 4.0 International License.
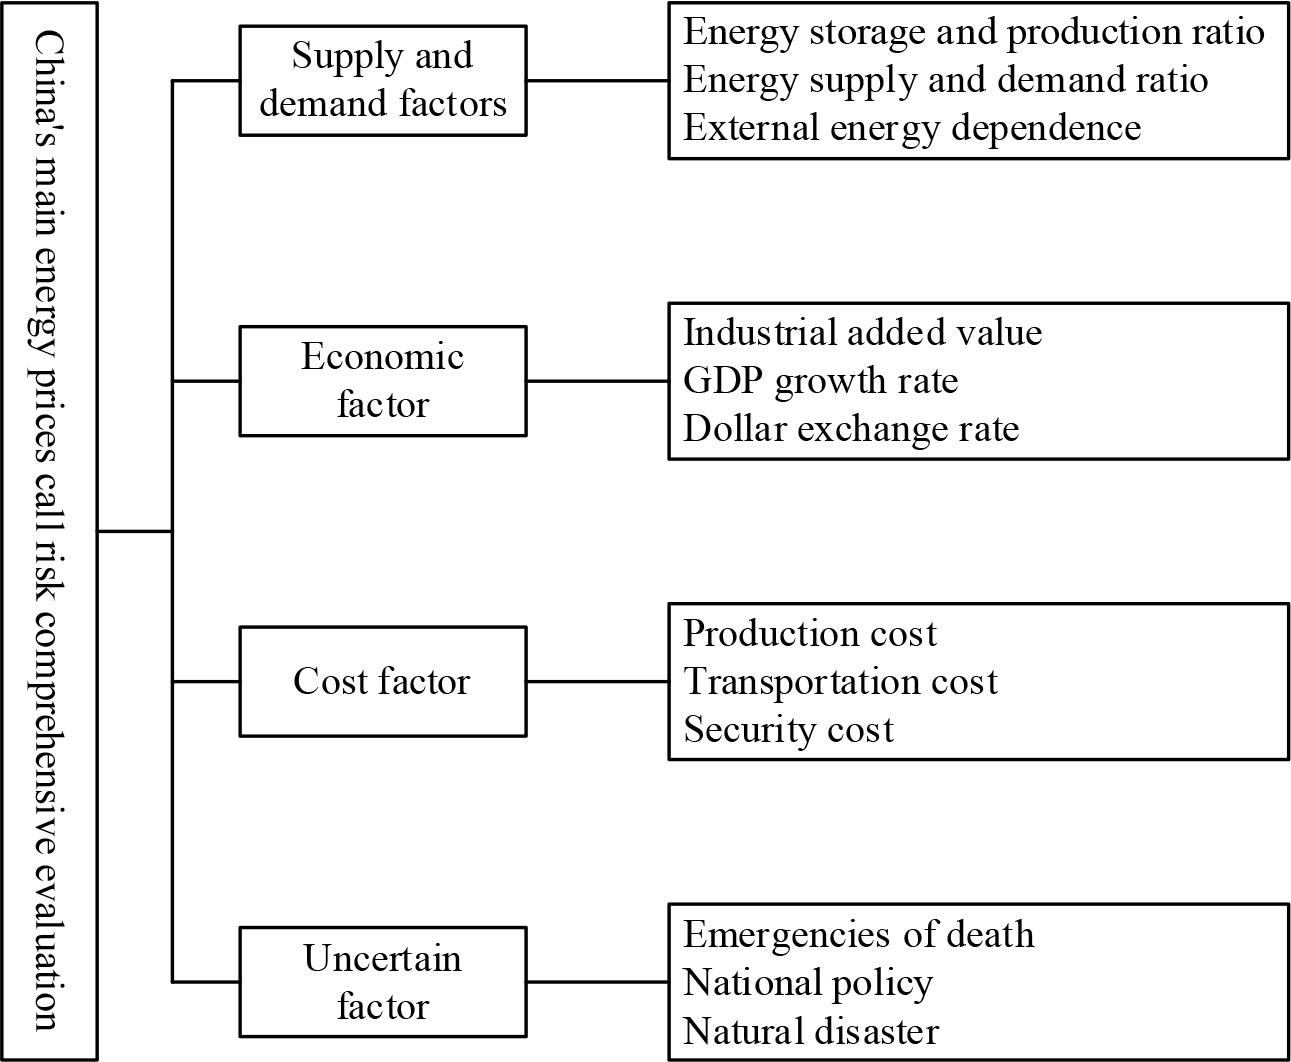
Figure 1.

The GARCH model parameter estimation result
| Shenzhen carbon market | Hubei carbon market | Coal market | Crude oil market | New energy market | |
| 0.0352 | -0.0351 | 0.0642 | 0.0724 | 0.0507 | |
| 1.8579 | 0.5628 | 0.0597 | 0.2458 | 0.0214 | |
| 0.3264 | 0.6587 | 0.0928 | 0.1468 | 0.0575 | |
| 0.6175 | 0.3051 | 0.8994 | 0.8325 | 0.9267 | |
| AIC | 7.6814 | 4.5007 | 3.6125 | 4.6119 | 3.9865 |
| BIC | 7.7789 | 4.1236 | 4.0437 | 4.7325 | 3.8714. |
Selection of copula functions
| Gaussion Copula | Student-t Copula | Frank Copula | ||
| Shenzhen → new energy | LogLike | 0.52 | 1.08 | 0.25 |
| AIC | 0.91 | 2.31 | 1.68 | |
| BIC | 7.04 | 15.27 | 8.34 | |
| Hubei → new energy | LogLike | 0.25 | -0.15 | 0.51 |
| AIC | 1.64 | 5.93 | 1.19 | |
| BIC | 7.79 | 16.34 | 7.53 |
The Ljung-Box Q test of the GARCH(1, 1) model
| Market | Ljung-Box | P VALUE |
| Shenzhen carbon market | 0.0067 | 0.9537 |
| Hubei carbon market | 1.2543 | 0.2856 |
| Coal market | 0.1895 | 0.6979 |
| Crude oil market | 0.9677 | 0.3508 |
| New energy market | 0.9568 | 0.3641 |
The prediction error of the Shanghai 50 index
| MAE | MAPE | RMSE | ||
| Shanghai Shanghai 50 index | GNN | 1.125036 | 0.000542 | 9.326473 |
| LSTM | 4.653381 | 0.001779 | 38.490865 | |
| Random forest | 1.560437 | 0.000459 | 14.527119 | |
| XGBoost | 0.983642 | 0.000406 | 8.667859 |
Comparative analysis
| Prediction model | GNN | SVM | ||||||
| Hysteresis | First-order | Second order | Third order | Fourth-order | First-order | Second order | Third order | Fourth-order |
| MAPE/% | 3.52 | 4.14 | 4.96 | 5.54 | 3.78 | 4.25 | 4.92 | 5.76 |
| MAE | 0.756 | 0.824 | 0.945 | 1.354 | 0.757 | 0.824 | 0.927 | 1.288 |
| RMSE | 0.598 | 0.635 | 0.778 | 0.897 | 0.611 | 0.676 | 0.790 | 0.954 |
| FVD | 0.891 | 0.837 | 0.775 | 0.714 | 0.837 | 0.797 | 0.785 | 0.729 |
| Prediction model | GM(1,N) | ARMAX | ||||||
| Hysteresis | First-order | Second order | Third order | Fourth-order | First-order | Second order | Third order | Fourth-order |
| MAPE/% | 4.58 | 5.96 | 5.27 | 6.35 | 6.59 | 7.57 | 8.04 | 8.59 |
| MAE | 0.896 | 0.974 | 1.345 | 1.578 | 1.781 | 1.995 | 1.653 | 1.907 |
| RMSE | 0.665 | 0.725 | 0.787 | 0.965 | 0.965 | 0.993 | 1.042 | 1.214 |
| FVD | 0.824 | 0.810 | 0.726 | 0.722 | 0.776 | 0.721 | 0.807 | 0.753 |
| Prediction model | BP | RM | ||||||
| Hysteresis | First-order | Second order | Third order | Fourth-order | First-order | Second order | Third order | Fourth-order |
| MAPE/% | 7.89 | 8.65 | 9.75 | 10.24 | 9.03 | 9.75 | 10.03 | 11.48 |
| MAE | 1.635 | 1.962 | 2.653 | 2.369 | 2.214 | 2.324 | 2.635 | 2.989 |
| RMSE | 0.797 | 0.804 | 0.979 | 1.324 | 0.706 | 0.927 | 1.333 | 1.502 |
| FVD | 0.735 | 0.747 | 0.614 | 0.685 | 0.724 | 0.643 | 0.659 | 0.657 |
Shenzhen, hubei carbon market and energy market risk spill value (q= 0_05)
| CoVaR | ΔCoVaR | %ΔCoVaR | |
| Shenzhen carbon market → new energy market | -3.654 | 0.379 | 8.76% |
| Hubei carbon market → new energy market | -3.245 | 0.197 | 6.35% |
| New energy market → shenzhen carbon market | -25.964 | 3.564 | 14.72% |
| New energy market → hubei carbon market | -4.012 | 0.758 | 16.34% |
The risk spilt on the carbon market and energy markets (q= 0_05)
| CoVaR | ΔCoVaR | %ΔCoVaR | |
| Carbon markets, new energy markets | -3.596 | 0.348 | 7.86% |
| New energy market, carbon market | -13.078 | 2.053 | 16.35% |
