Optimisation of highway vehicle occlusion recognition based on attention and multitasking approach

Publié en ligne: 17 mars 2025
Reçu: 18 oct. 2024
Accepté: 12 févr. 2025
DOI: https://doi.org/10.2478/amns-2025-0180
Mots clés
© 2025 Shifeng Feng, published by Sciendo
This work is licensed under the Creative Commons Attribution 4.0 International License.
As a major transportation route between cities, high vehicle speed and dense traffic flow on highways make it more necessary to have accurate and efficient risk identification and early warning systems to cope with potential traffic accident risks [1-2]. In the field of modern traffic safety management, real-time identification and early warning of highway vehicle risk is an important task to ensure the safety and smoothness of road traffic [3-5].
With the increase in the rate of motor vehicle ownership and the continuous extension of highway mileage, the accident rate of highways has been on a gradual upward trend, which has brought about a serious impact on people's travel safety. It can be seen that for the complex scenarios of highways, especially accident-prone roadways, accurate detection and identification of vehicle risks are crucial for preventing the occurrence of related safety accidents and formulating corresponding control programs [6-8]. However, in the actual highway regulatory perspective, vehicle targets often have realistic problems such as inter-target occlusion and environmental background occlusion [9-10]. Due to the occlusion problem, existing target detection and recognition algorithms are difficult to solve the exact position of the target and the category of the target from the video data with missing apparent and motion information, which results in the serious defects of poor reliability and low robustness of the detection and recognition algorithms [11-12]. In order to better solve this problem, the existing intelligent algorithms are optimized for vehicle target detection and recognition to enhance the detection and recognition capabilities of traffic environment awareness algorithms in dynamic occlusion scenarios, to serve intelligent transportation applications such as traffic efficiency optimization and traffic safety warning of intelligent vehicle and road systems, and to contribute to the development of transportation intelligence [13-15].
Vehicles, as one of the main participants in transportation, and the detection and tracking techniques associated with them are the main components of an intelligent transportation risk identification system. Literature [16] develops a non-intrusive system based on vision technology to identify highway vehicles, which uses deep convolutional neural networks to extract the feature description factors of the video region to locate the vehicle position and uses linear support vector machine templates to classify the vehicles, which greatly improves the performance of vehicle identification. Literature [17] proposed an integrated recognition method YOLOv4- l based on YOLOv4 to reduce the computational complexity, using this deep learning algorithm to analyze the characteristics of multi-lane traffic flow with different flow densities, which can significantly improve the speed of detecting and recognizing vehicles, but reduces a certain amount of recognition accuracy. Literature [18] proposed a video vehicle detection and classification method based on static appearance features and motion features of vehicles, relying on traffic surveillance video to describe the motion features of vehicles, combined with the designed algorithms of removing, selecting, and reorganizing detection targets in order to improve the detection and classification accuracy of vehicles. Literature [19] combines a deep learning model with a single-shot multibox detector (SSD), and experiments show that the proposed method is able to detect more vehicles compared to the pre-trained SSD model during the detection of highway vehicles. Literature [20] showed that road sensors that provide accurate trajectory data for vehicles face the problem of occlusion that leads to reduced integrity and reliability of target detection, so a recognition algorithm based on LiDAR sensor data is proposed to quickly and accurately determine the content of the occlusion by automatically recognizing the vehicle's localized occlusion and the relationship between the occlusions. Literature [21] studied how to improve the accuracy of LiDAR sensor detection and identification of vehicles in the case of weather occlusion, and proposed 3D-SDBSCAN algorithm based on density-based spatial clustering with noise (DBSCAN) algorithm, and experiments have proved that the proposed algorithm is better able to overcome the problem of weather occlusion under the conditions of rain and snow.
In summary, previous research has made significant progress in addressing the issue of vehicle occlusion on highways.However, there are some limitations to these studies.For example, in highly complex or variable environments such as lighting changes and strong occlusion, there is still significant room for improvement in detection precision. To this end, research innovatively introduces the Convolutional Attention Mechanisms for Three-Branch Structures (CAMTS) and Unbiased Coordinate System Transformation (UCST) for keypoint extraction and transformation, combined with Multi-acale Attention Feature Fusion (MAFF) to dynamically adjust feature weights at different resolutions, thereby achieving efficient detection of vehicles in complex occlusion scenes. Research can contribute to vehicle detection and technical support for auto-driving and smart transportation systems. The research targets to address the performance degradation of existing detection algorithms in heavily occluded and variable environments, and provide more robust solutions for vehicle detection and recognition in autonomous driving and intelligent transportation systems.
There are various types of occlusion phenomena, which may be caused by vehicles ahead, roadblocks, or other traffic participants. However, traditional vehicle detection methods mostly rely on global vehicle appearance information. When the vehicle is partially or completely obscured, these methods are difficult to accurately identify the vehicle, resulting in a significant decrease in detection accuracy [22-23]. Therefore, the study first attempts to extract keypoint features from vehicles, then converts keypoint coordinates, and finally performs image detection. Key points are extracted and transformed using UCST, as shown in Figure 1.
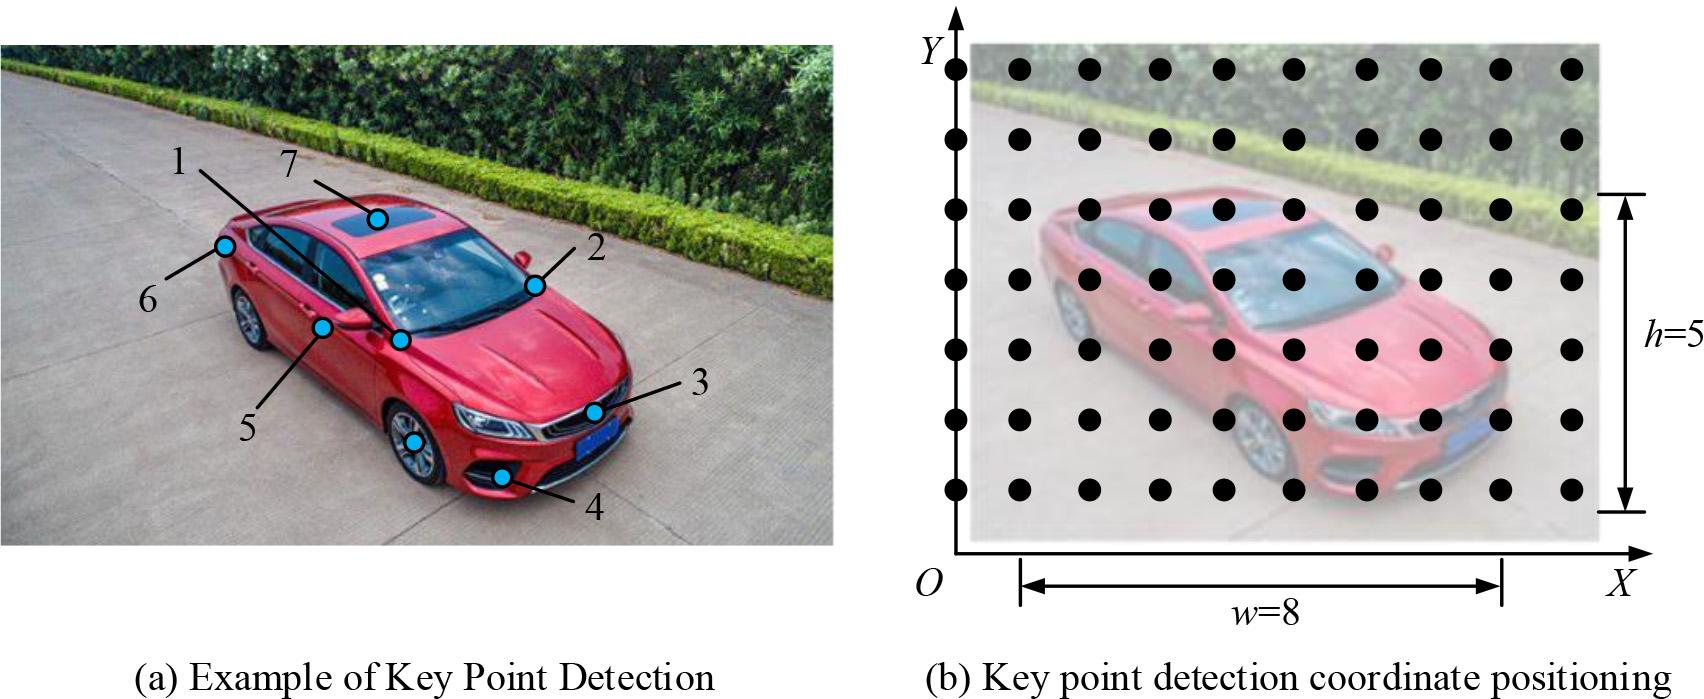
Key point extraction and coordinate positioning of vehicles
Figure 1 (a) showcases an example of key point extraction for a vehicle, and Figure 1 (b) showcases an example of key point coordinate localization for a vehicle. From Figure 1 (a), multiple feature points of the vehicle, including key parts such as wheels, roof, and headlights, are identified through keypoint detection technology. Figure 1 (b) shows the coordinate positioning of these keypoints in the image, where
In equation (1),
In equation (2),
In equation (3),
In equation (4),
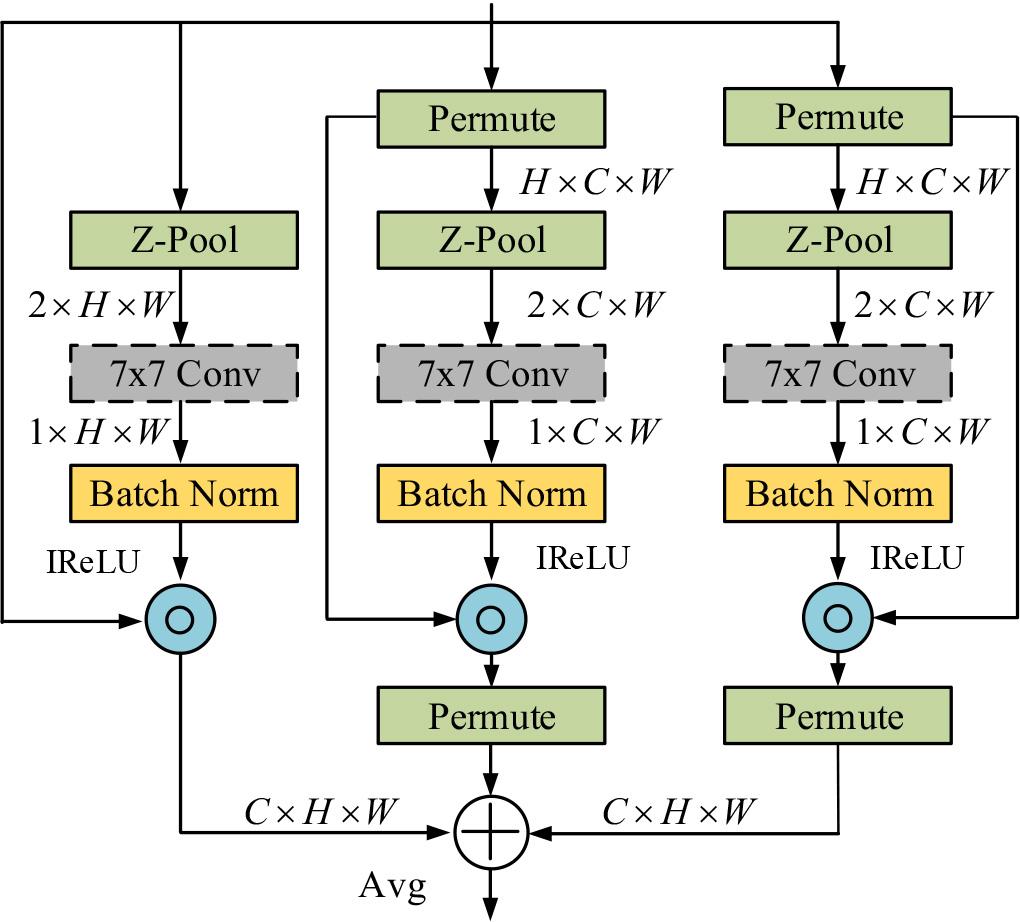
The structure of CAMTS
As shown in Figure 2, the left branch first passes the input tensor of C × H × W into the Z-pool layer, which minimize the amount of channels to 2 and lowers the computational cost. Subsequently, the 2 × H × W tensor is passed through convolutional and batch normalization layers to generate a 1 × H × W tensor, which is then subjected to an activation function to obtain the corresponding attention weights. The middle branch adjusts the input tensor to H × C × W, passes it into the Z-pool layer, minimizes the amount of channels to 2, and then obtains a tensor of 1 × W × C through convolutional and batch normalization layers. Finally, it is activated by an activation function to generate attention weights. The expression of Z-pool layer is denoted in equation (5).
In equation (5),
In equation (6),
In equation (7),
In equation (8),
After extracting key points of the vehicle and converting them into CAMTS, it was found that conventional feature point recognition methods exhibit performance degradation in dynamic and complex environments such as shooting angles, lighting changes, and vehicle turns [28]. To address this issue, research has improved traditional feature point recognition algorithms and proposed a two-line multitasking occlusion recognition detection model.The structure of the model is indicated in Figure 3.
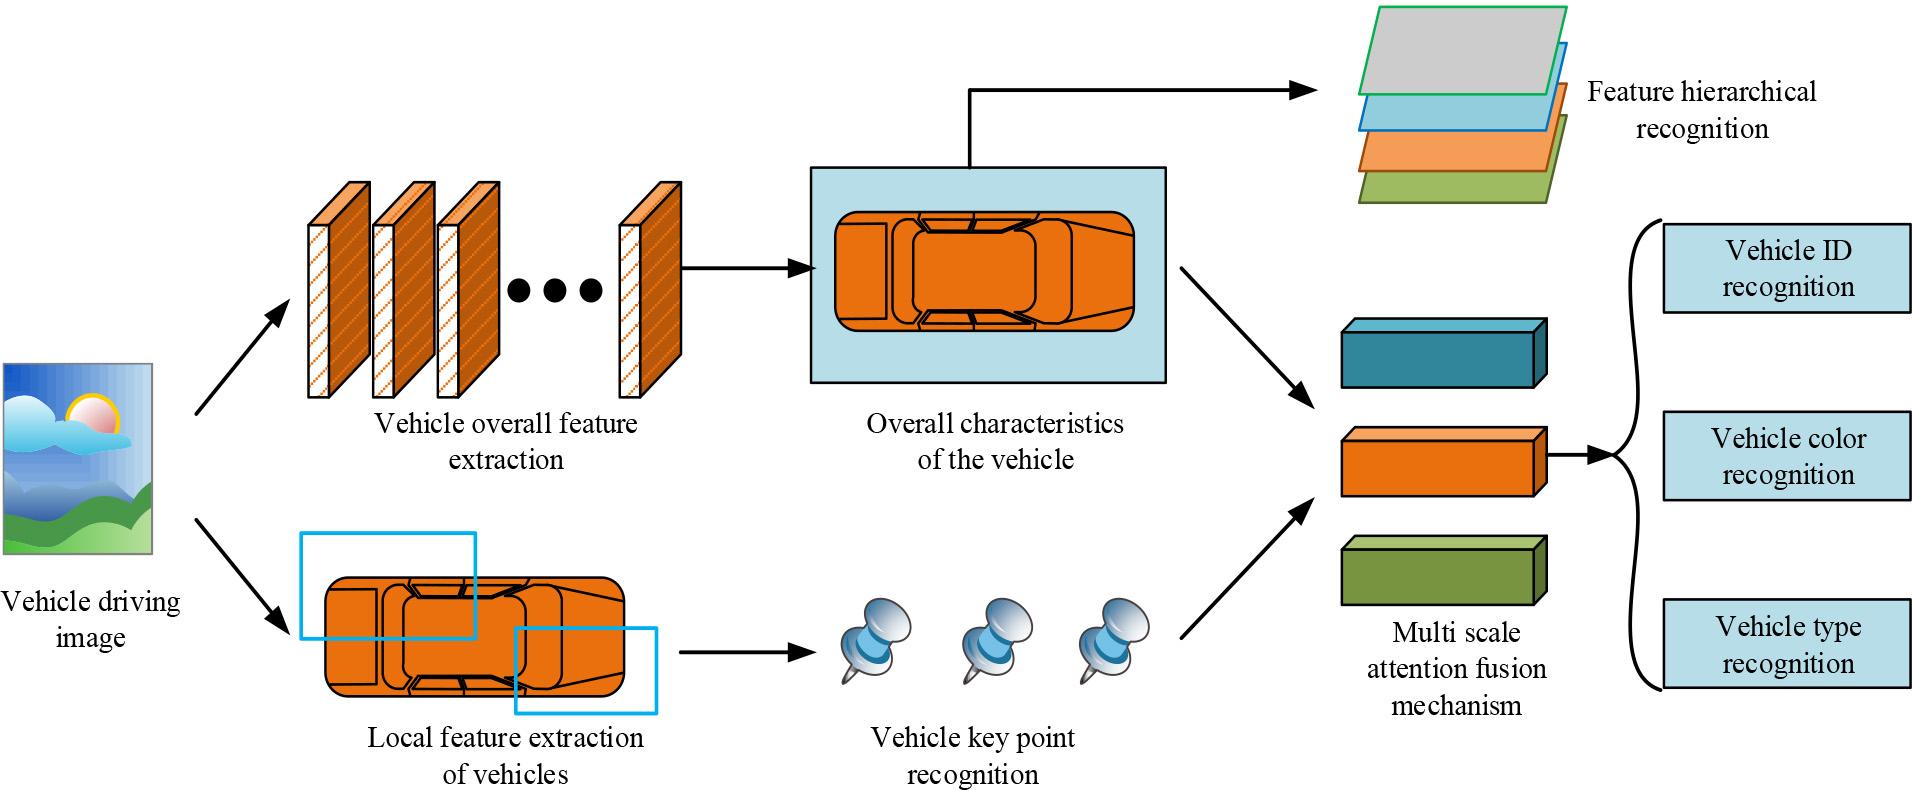
Structure of two line multi-task vehicle recognition model
In Figure 3, the first line is responsible for extracting the basic features of the vehicle, using multiple convolutional layers to process the input image layer by layer, gradually extracting the key features of the vehicle through the stacking of feature maps. The second line handles the vehicle's dynamic information, which includes changes in lighting, turning, and other complex situations. After feature extraction, the two lines are fused through a shared layer, and the extracted features are input into multiple branch networks for different tasks, such as vehicle position detection, occlusion recognition, etc. During this period, each task branch is optimized through independent loss functions. The feature fusion branch uses the MAFF method. Compared with other methods, MAFF can dynamically adjust the importance weights of different scale features through multi-scale feature extraction and attention mechanisms, thereby preserving more useful feature information at different resolutions [29-30]. The structure is depicted in Figure 4.
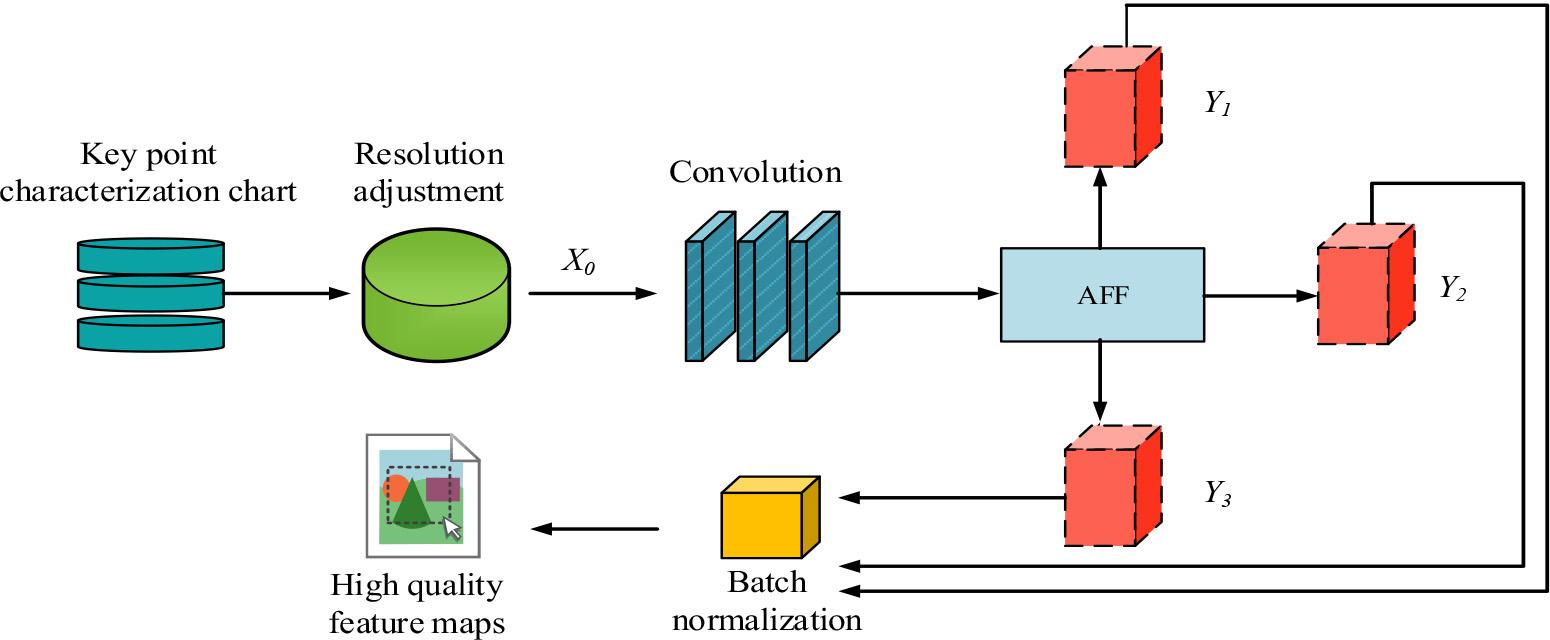
The structure of MAFF
In Figure 4, MAFF first adjusts the resolution of the keypoint feature map and selects the feature map
In equation (9),
In equation (10),
In where, the features
In equation (12),
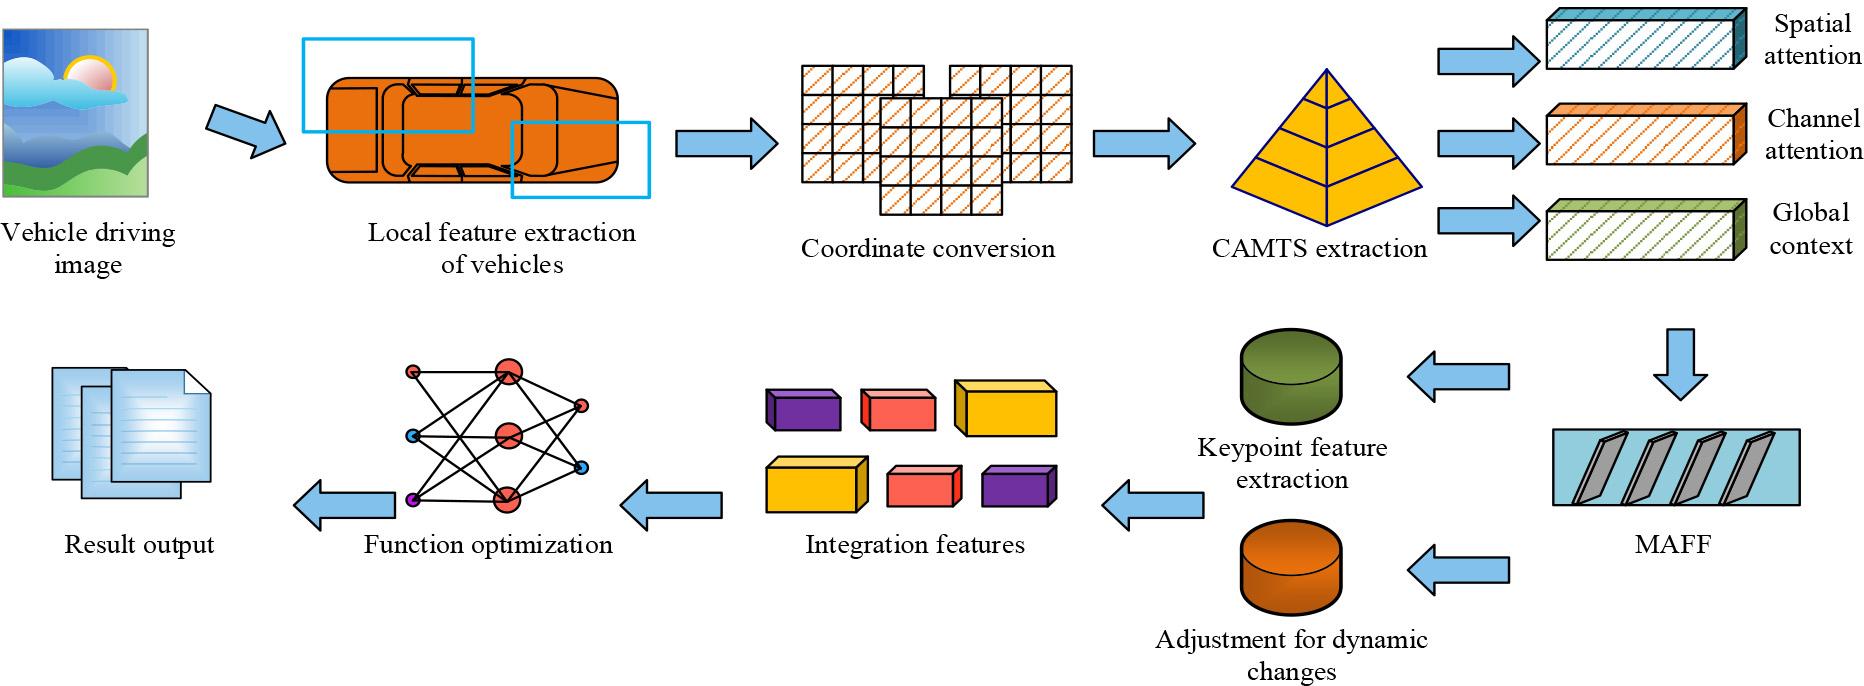
A two-line multitasking vehicle occlusion recognition modeling process
From Figure 5, the initial stage of the process is to obtain the features of the vehicle keypoints from the input image, using an unbiased coordinate system transformation for coordinate unification. Secondly, CAMTS is used to enhance the spatiotemporal processing capability of keypoint features. The model processes spatial attention, channel attention, and global contextual features through three parallel branches, and uses a Z-pool layer to reduce computational complexity. Finally, the fused attention weights are obtained, and the MAFF module is utilized to extract and weight features at different resolutions to generate a fused feature map. Subsequently, the model adopts a two-wire architecture, with one line responsible for extracting basic vehicle features and the other line processing dynamic information such as lighting changes and turning situations. After fusion of the extracted features in the shared layer, the model performs tasks such as vehicle position detection and occlusion recognition through multiple branch networks. Each task independently optimizes the loss function to ensure the accuracy of the model. Ultimately, by integrating the target detection loss function and optimizing the tasks of classification, localization, and occlusion recognition, the robustness and accuracy of vehicle recognition in complex scenes are improved.
The research set the CPU to Intel Core 2.5Hz dual core, with 16GB of memory and NVIDIA GeForce RTX166s GPU. The programming language was Python 3.7, and model construction was implemented on Pytorch with Adam as the optimizer. The publicly available COCO dataset and ApolloScape Open Dataset for Autonomous Driving (ApolloScape) were used as testing data sources.Among the datasets utilized in computer vision, COCO is a commonly employed one for multi-object detection, containing a large number of vehicle images with occlusions.ApolloScape is a large-scale outdoor dataset that is specifically made for autonomous driving tasks, and it includes street view images taken in various weather, time, and traffic conditions, with a particular focus on detecting vehicle occlusions. Firstly, the final proposed occlusion recognition model was subjected to ablation testing, and the outcomes are denoted in Figure 6.
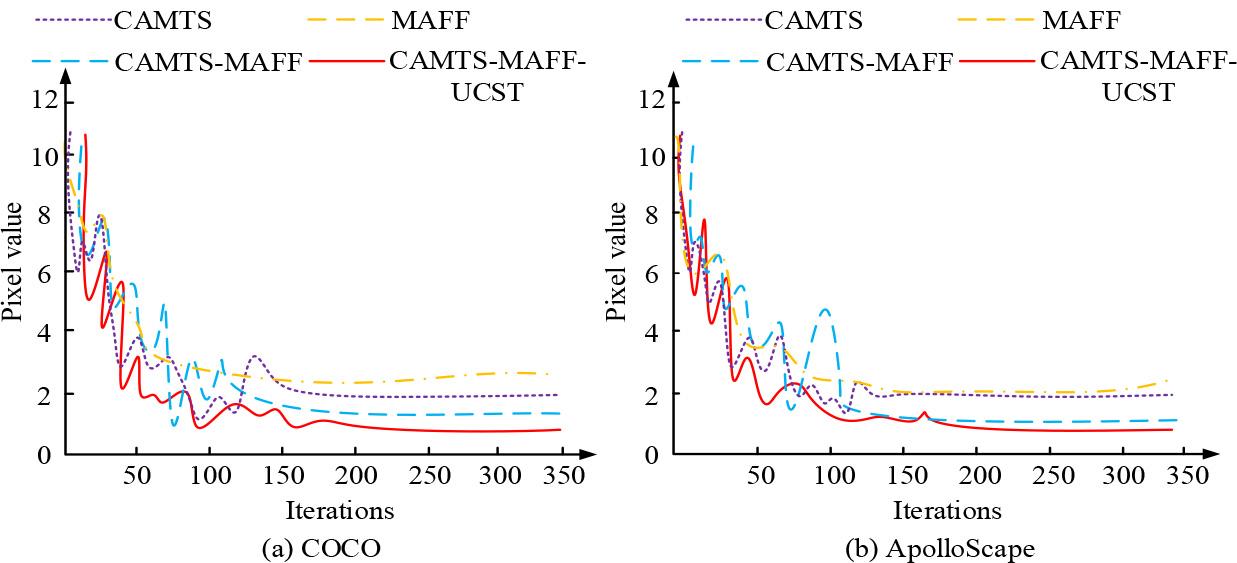
Ablation test results
Figure 6 (a) showcases the ablation test findings of the final model on the COCO dataset, and Figure 6 (b) showcases the ablation test findings of the final model on the ApolloScape dataset. In Figure 6, the pixel values represent the Euclidean distance between the extracted feature points and the annotated feature points. The smaller the distance, the closer the extracted feature points are to the real feature points, and the higher the detection accuracy. Compared to the individual CAMTS and MAFF modules, the combined detection pixel value of CAMTS-MAFF was lower, approximately 1.8px. The pixel value iteration of the final model was the fastest, with its lowest value remaining stable at around 1px. In Figure 6 (b), similar to the COCO dataset, the overall performance of the final model was greater than that of other individual combination models. The final model had around 100 iterations, and the minimum pixel value for feature point extraction was 1px. The study introduced advanced occlusion detection algorithms for comparison, such as Mask Region-Based Convolutional Neural Networks (Mask R-CNN), Faster Region-Based Convolutional Neural Networks (Faster R-CNN), and You Only Look Once version 7 (YOLOv7). The PR curve and the area under the curve S were plotted with precision recall as the coordinates, and the results are shown in Figure 7.
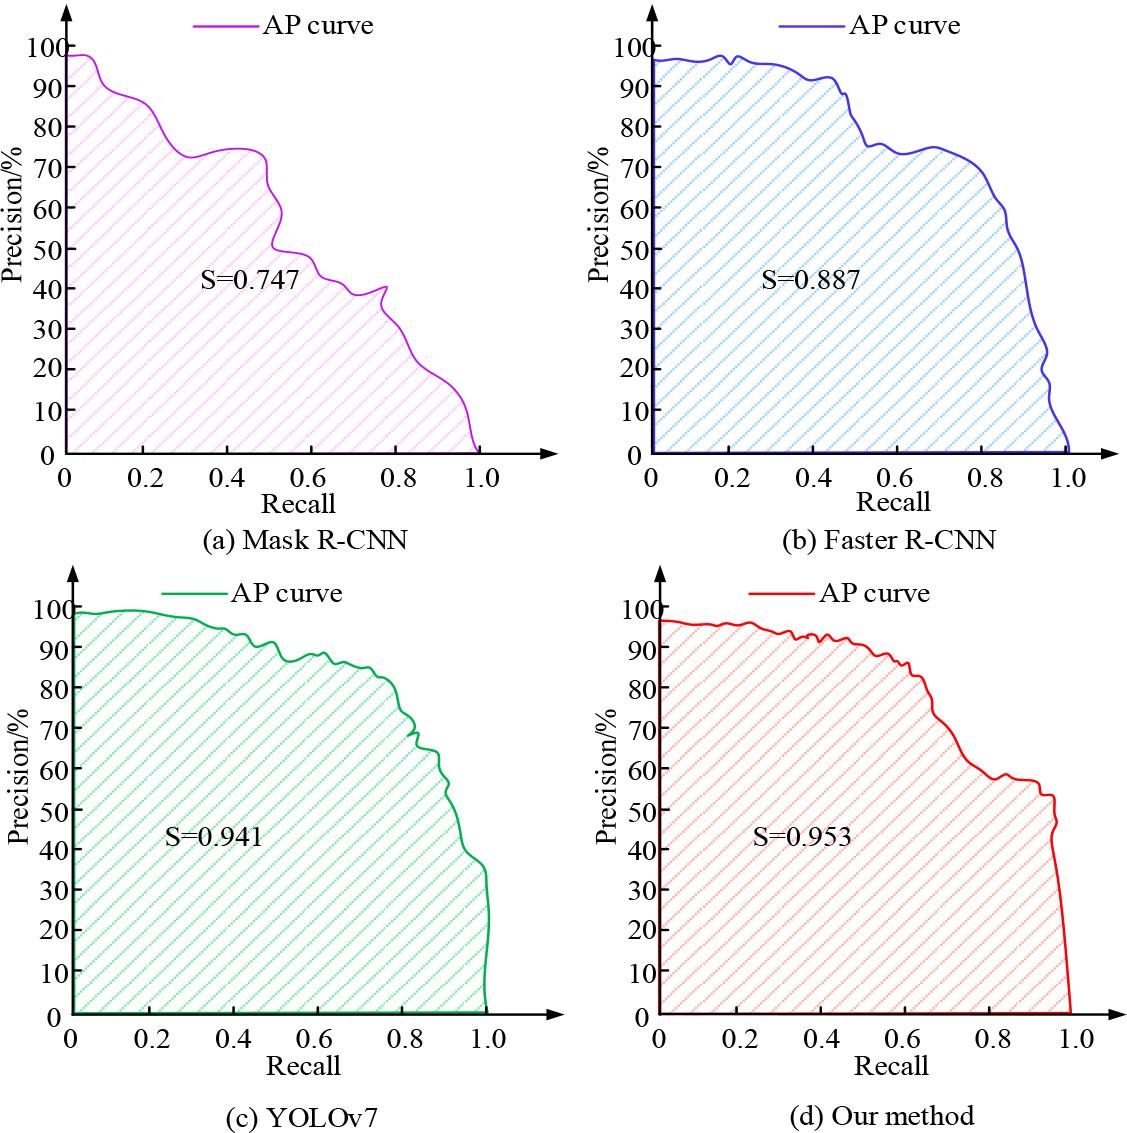
PR curves and area test results for each module
Figure 7 (a) showcases the PR test curve and area outcomes of Mask R-CNN, Figure 7 (b) showcases the PR test curve and area outcomes of Faster R-CNN, Figure 7 (c) showcases the PR test curve and area outcomes of YOLOv7, and Figure 7 (d) shows the PR test curve and area outcomes of the raised model. In Figure 7, the PR curve of the Mask R-CNN model exhibited certain fluctuations, especially at higher recall rates, where the precision decreased rapidly. The final area was 0.747, which was relatively low, indicating that Mask R-CNN's performance was not stable enough in complex scenes. Relatively speaking, the PR curve of Faster R-CNN was relatively smooth, and its precision remained good at medium to high recall rates, but there was still a downward trend. The PR curve of YOLOv7 maintained high precision, especially performing well at medium to high recall rates, with an area of 0.941, but still inferior to the raised method. The PR curve of the proposed method by the research showed the best smoothness and stability, and could maintain high precision even at high recall rates.The maximum area was 0.953, which was the largest among the four models. The study conducted tests using P-value, R-value, F1 value, Mean Squared Error (MSE), and Mean Absolute Error (MAE) as indicators, and the test findings are denoted in Table 1.
| Data set | Model | P/% | R/% | F1/% | MSE | MAE |
|---|---|---|---|---|---|---|
| COCO | Mask R-CNN | 79.33 | 82.29 | 80.81 | 0.04 | 0.06 |
| Faster R-CNN | 84.69 | 84.17 | 84.43 | 0.02 | 0.04 | |
| YOLOv7 | 89.75 | 88.74 | 89.32 | 0.02 | 0.02 | |
| Our method | 93.28 | 92.47 | 92.82 | 0.01 | 0.02 | |
| ApolloScape | Mask R-CNN | 84.25 | 86.54 | 85.41 | 0.03 | 0.06 |
| Faster R-CNN | 86.69 | 88.15 | 87.36 | 0.03 | 0.05 | |
| YOLOv7 | 89.51 | 90.33 | 89.51 | 0.03 | 0.04 | |
| Our method | 92.23 | 93.82 | 92.62 | 0.01 | 0.02 |
According to Table 1, the precision, recall rate, and overall detection efficacy of the raised model in occlusion vehicle detection tasks were higher than Mask R-CNN, Faster R-CNN, and YOLOv7. Especially in the COCO dataset, the F1 value of the proposed model reached 92.82%, which is about 3.5 percentage points higher than YOLOv7, demonstrating strong comprehensive detection ability. The advantages of the proposed model are also reflected in the performance of MSE and MAE from the perspective of error metrics. In the COCO and ApolloScape datasets, the MSE of the proposed model was 0.01, while other models had higher MSE values, especially Mask R-CNN with MSEs of 0.04 and 0.03. Similarly, the MAE value also denoted that the raised model had the smallest error, only 0.02. In conclusion, the proposed method is demonstrably more precise, effective in recall, and error-resistant than the existing mainstream methods.
To conduct practical application tests on the new model proposed by the research, the study randomly selected any two images from two types of datasets and continued to compare the occlusion detection efficacy of the four methods. The outcomes are indicated in Figure 8.

The occlusion detection results of different detection methods
Figures 8 (a) and 8 (b) denote the occlusion detection findings of the Mask R-CNN model, Figures 8 (c) and 8 (d) denote the occlusion detection outcomes of the Faster R-CNN model, Figures 8 (e) and 8 (f) showcase the occlusion detection outcomes of the YOLOv7 model, and Figures 8 (g) and 8 (h) show the occlusion detection results of the raised model. In Figure 8, for vehicles with severe occlusion, the Mask R-CNN and Faster R-CNN models failed to fully detect the occlusion area, exhibiting certain false positives and false negatives. The YOLOv7 model performed well and could accurately detect occluded vehicles, but in complex scenes, there was a decrease in detection precision in the overlapping bounding box areas of multiple vehicles. Finally, the model proposed by the research demonstrated the best detection capability, effectively detecting all occluded vehicles, and the bounding box had the highest accuracy in the detection results, with almost no false positives and false negatives, especially in complex multi lane scenes. The research tested the model's detection performance under different occlusion rates, and the findings are indicated in Table 2.
| Occlusion rate | Method | Color precision/% | Vehicle type precision/% | Detection time/s |
|---|---|---|---|---|
| 20% | Mask R-CNN | 79.08 | 87.22 | 1.04 |
| Faster R-CNN | 76.33 | 72.23 | 1.46 | |
| YOLOv7 | 82.81 | 73.52 | 1.22 | |
| Our method | 91.74 | 93.49 | 0.29 | |
| 40% | Mask R-CNN | 80.13 | 79.45 | 0.93 |
| Faster R-CNN | 75.62 | 86.51 | 0.77 | |
| YOLOv7 | 82.77 | 89.52 | 0.61 | |
| Our method | 90.06 | 89.06 | 0.44 | |
| 60% | Mask R-CNN | 80.45 | 80.94 | 0.55 |
| Faster R-CNN | 83.92 | 78.25 | 1.94 | |
| YOLOv7 | 76.76 | 83.49 | 0.74 | |
| Our method | 94.56 | 88.67 | 0.21 | |
| 80% | Mask R-CNN | 78.77 | 81.47 | 1.28 |
| Faster R-CNN | 82.36 | 84.22 | 1.18 | |
| YOLOv7 | 84.58 | 87.11 | 1.92 | |
| Our method | 92.52 | 88.16 | 0.53 |
Table 2 shows that the research's proposed model performed the best under all occlusion conditions, particularly in terms of color precision and vehicle model precision.It still maintained 92.52% color precision and 88.16% vehicle model precision at an 80% occlusion rate. However, other methods had a significant decrease in occlusion under high occlusion rates, such as Mask R-CNN and Faster R-CNN, which had lower precision. At the same time, the model proposed by the research also had significant advantages in detection time. The detection time was kept within 0.5 seconds under all testing conditions, particularly at a 60% occlusion rate, where it was only 0.21 seconds, which was much faster than other models.From this, the proposed model not only performs excellently in precision when dealing with occlusion vehicle detection tasks, but also demonstrates extremely high efficiency in detection time, especially during high occlusion rates.
Aiming at the complex vehicle occlusion problem on highways, an occlusion recognition optimization method that integrates an attention mechanism and a multi-task approach was studied and designed. By using keypoint detection and unbiased coordinate system transformation, CAMTS was used to extract the main features of vehicles. When combined with the MAFF mechanism, multiple tasks were effectively processed. The results indicate that the pixel value iteration of the new model was as fast as 100 times, and its lowest pixel value remained stable at around 1 px. Compared to other advanced methods of the same type, the PR curve of the proposed model exhibited the best smoothness and stability, with a maximum area under the PR curve of 0.953. In addition, the new model had the highest P value of 93.28%, the highest R value of 93.82%, the highest F1 value of 92.82%, the lowest MSE value of 0.01, and the lowest MAE value of 0.02, all of which were significantly better than existing mainstream methods. The simulation results showed that compared to Mask R-CNN, Faster R-CNN, and YOLOv7, the raised method had the highest vehicle color detection precision of 94.56% and the highest vehicle type detection precision of 89.06%. The detection time was within 0.5 seconds, which shows that it had both extremely high detection accuracy and excellent detection efficiency. Even though there were significant research achievements, there were still limitations in practical applications, such as the need to improve performance when dealing with extreme lighting changes or different weather conditions. Future research can explore more tests in different scenarios while considering introducing more complex environmental information, such as dynamic objects and multi-sensor data fusion, to further improve the precision and adaptability of occlusion vehicle detection.