Load Distribution Prediction and Design Models for Ship Special Mechanical Devices and Equipment under Non-linear Sea Conditions
17 mars 2025
À propos de cet article
Publié en ligne: 17 mars 2025
Reçu: 09 nov. 2024
Accepté: 09 févr. 2025
DOI: https://doi.org/10.2478/amns-2025-0170
Mots clés
© 2025 Peiyao Yang, published by Sciendo
This work is licensed under the Creative Commons Attribution 4.0 International License.
Figure 1.
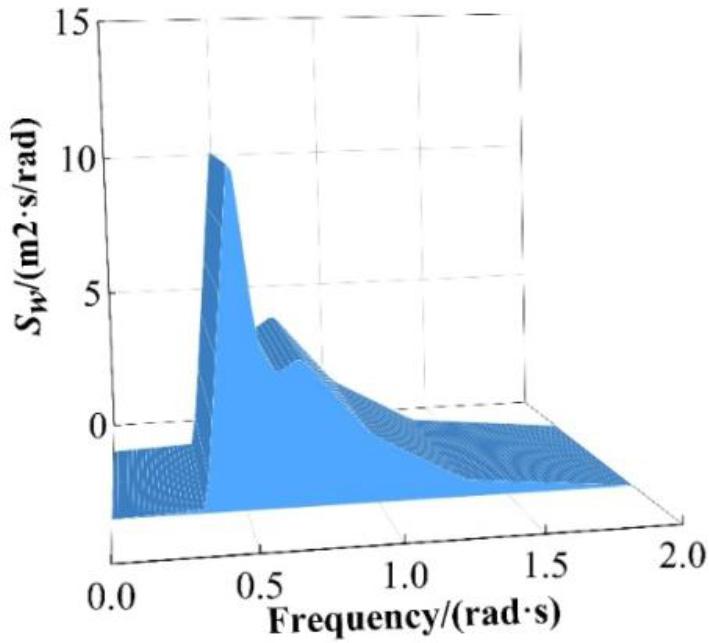
Figure 2.
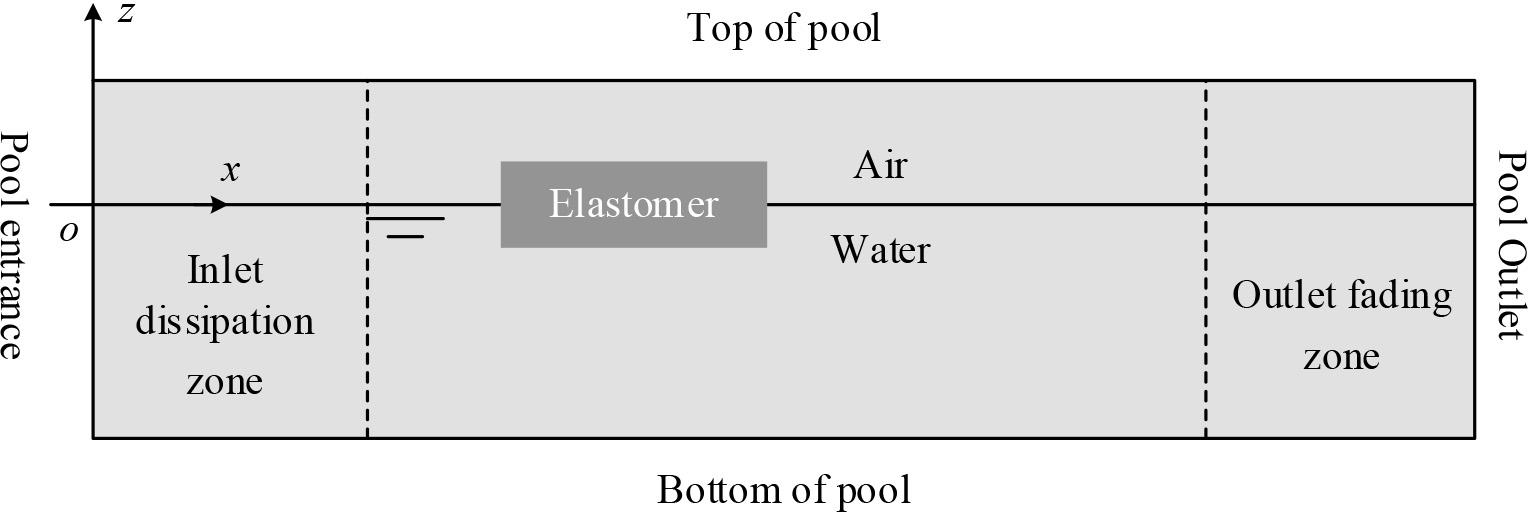
Figure 3.
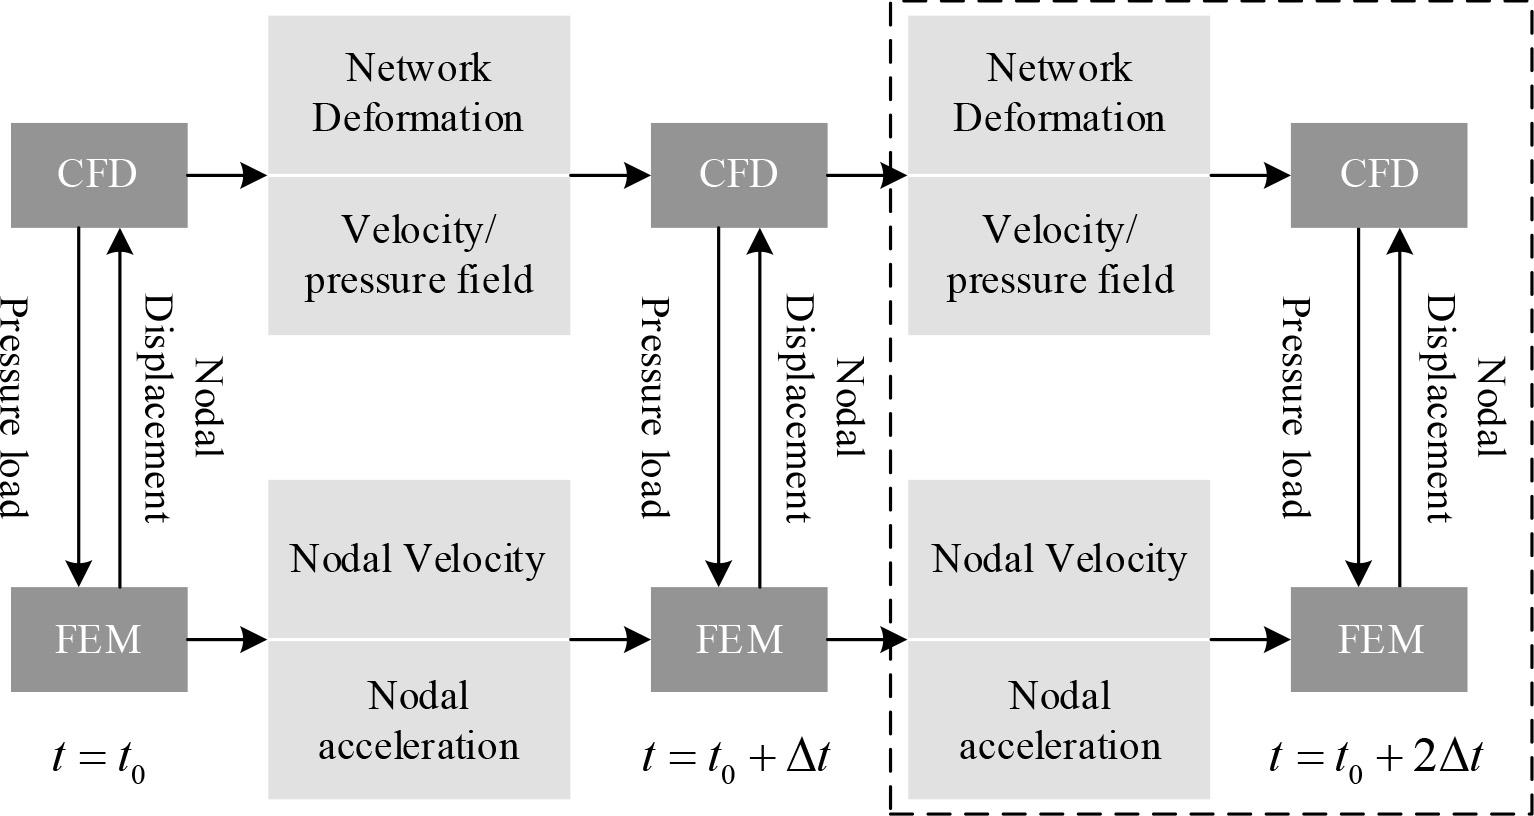
Figure 4.
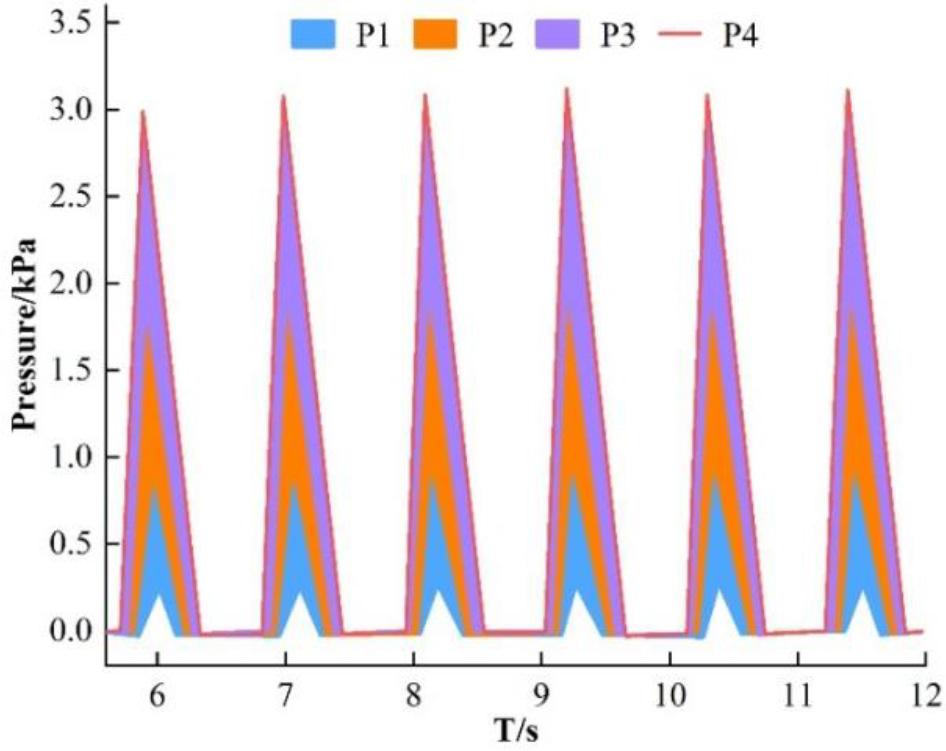
Figure 5.

Figure 6.
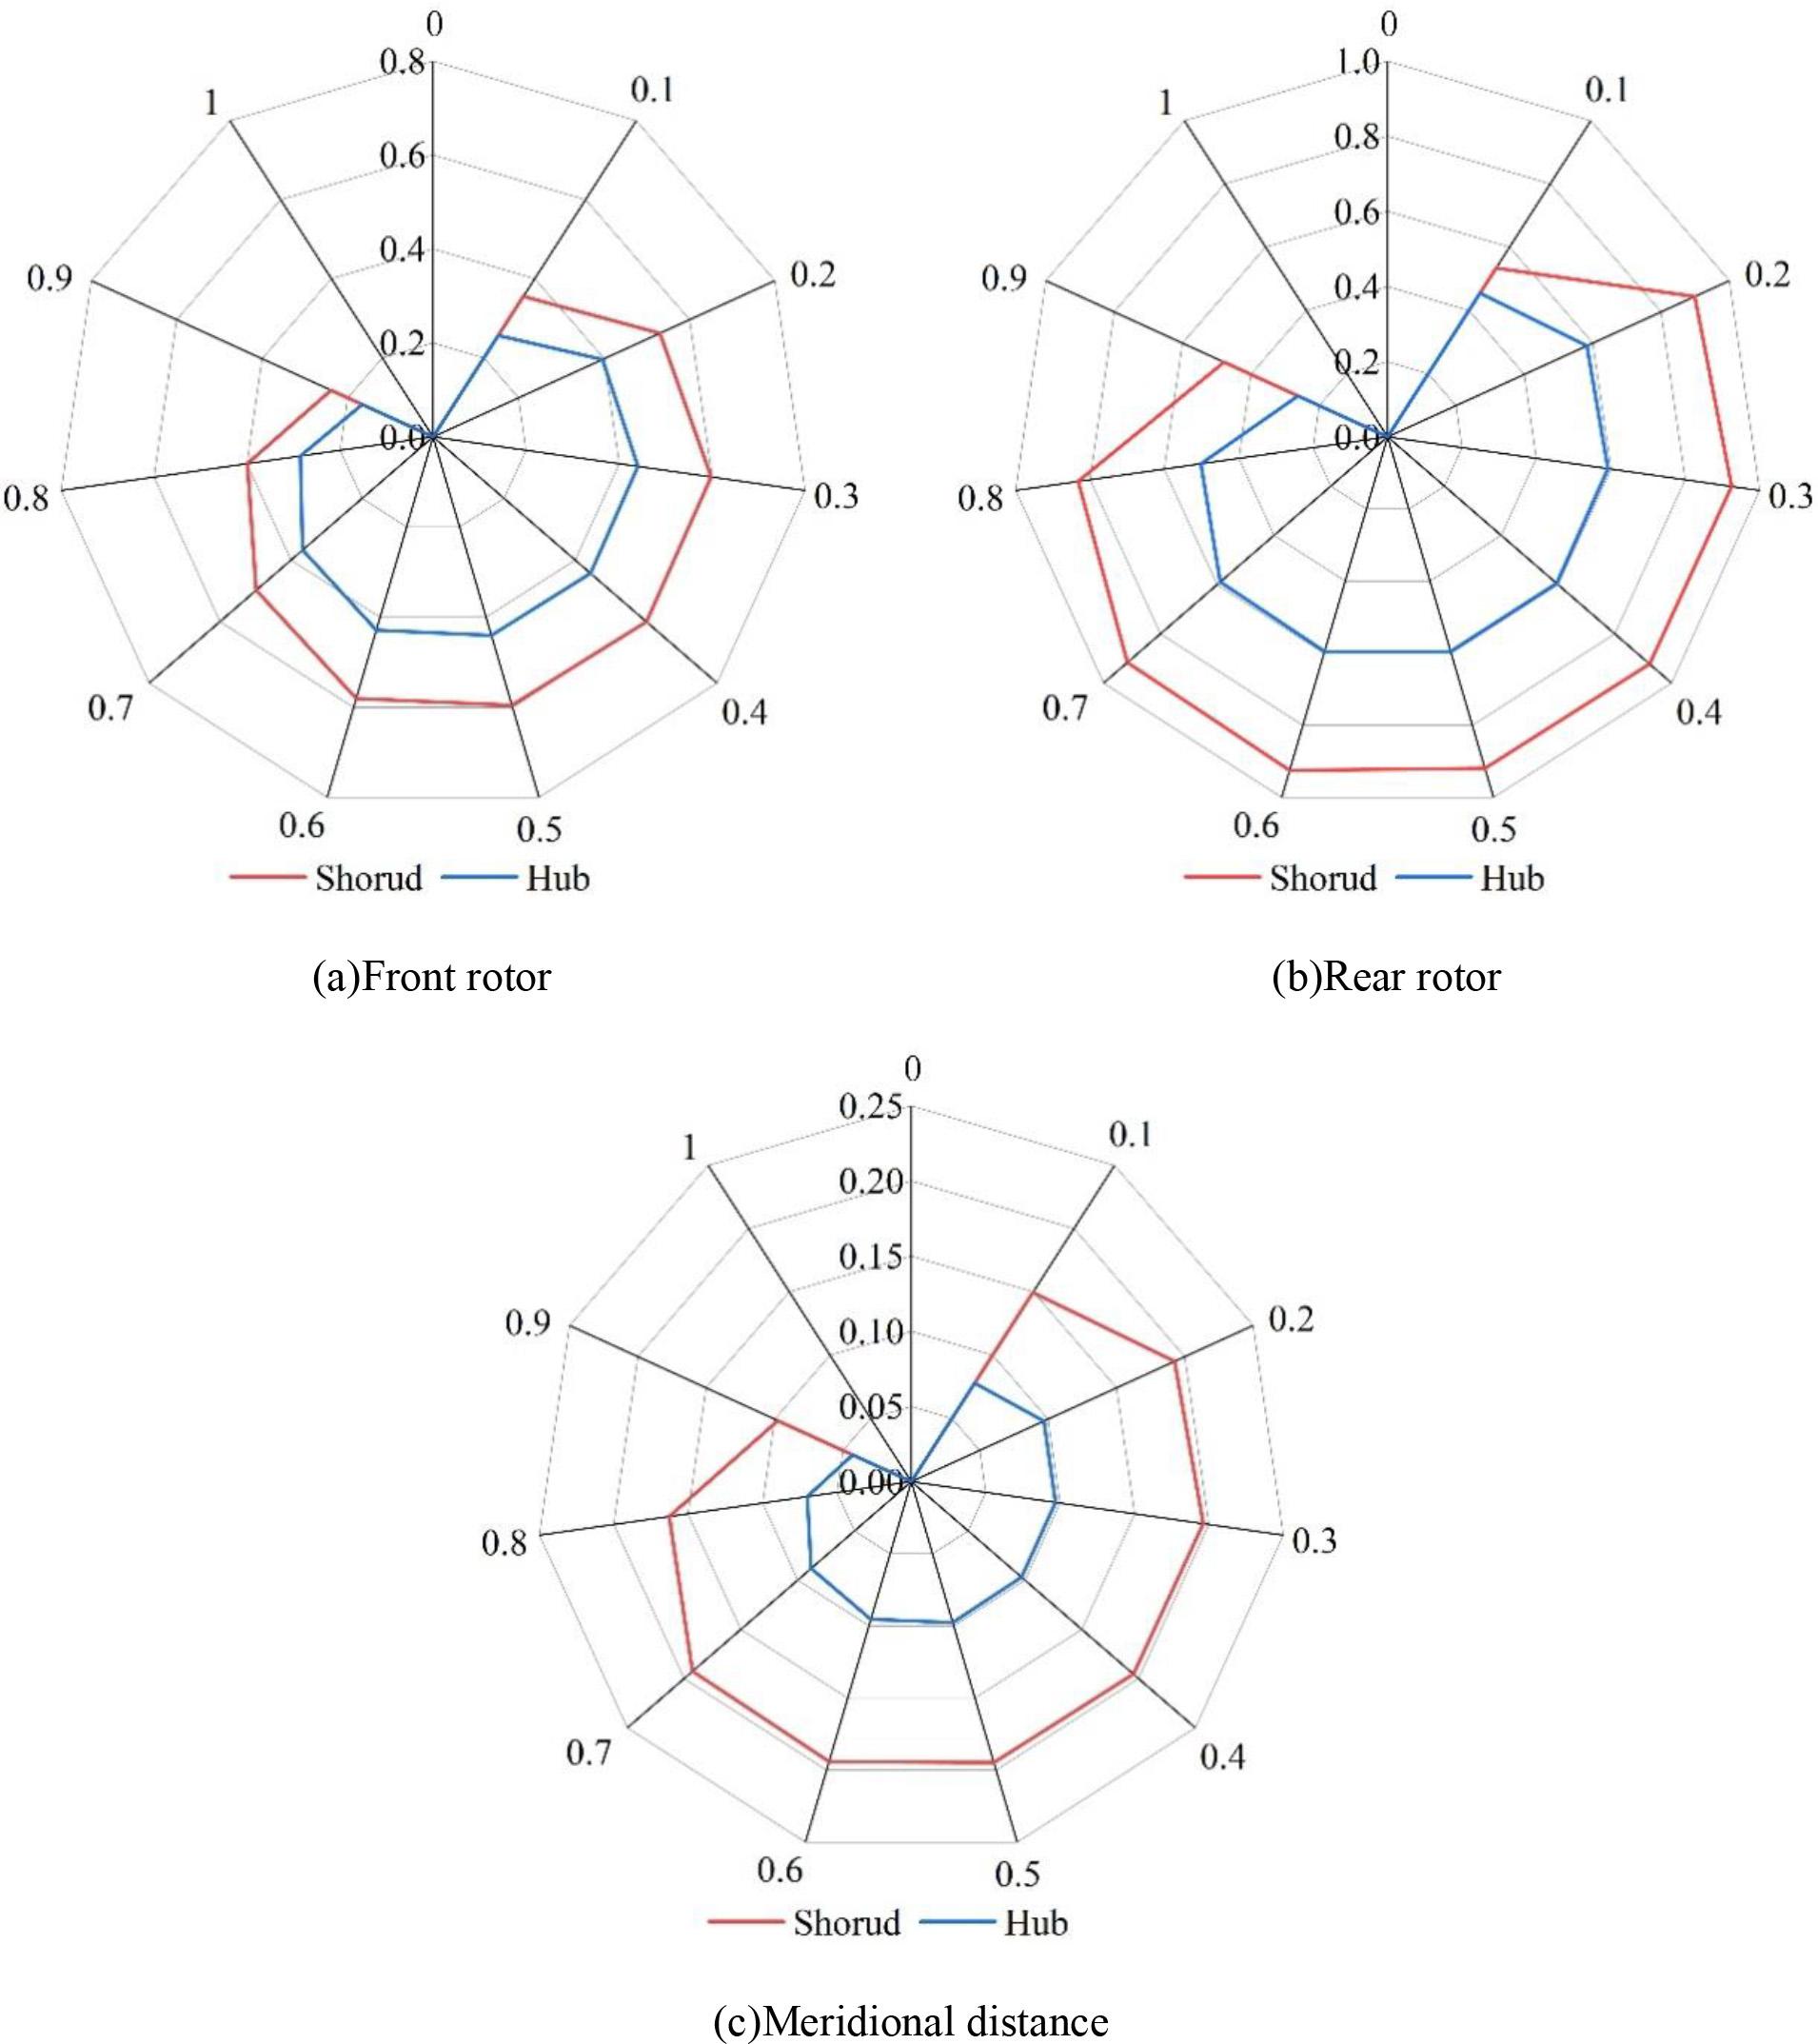
Figure 7.
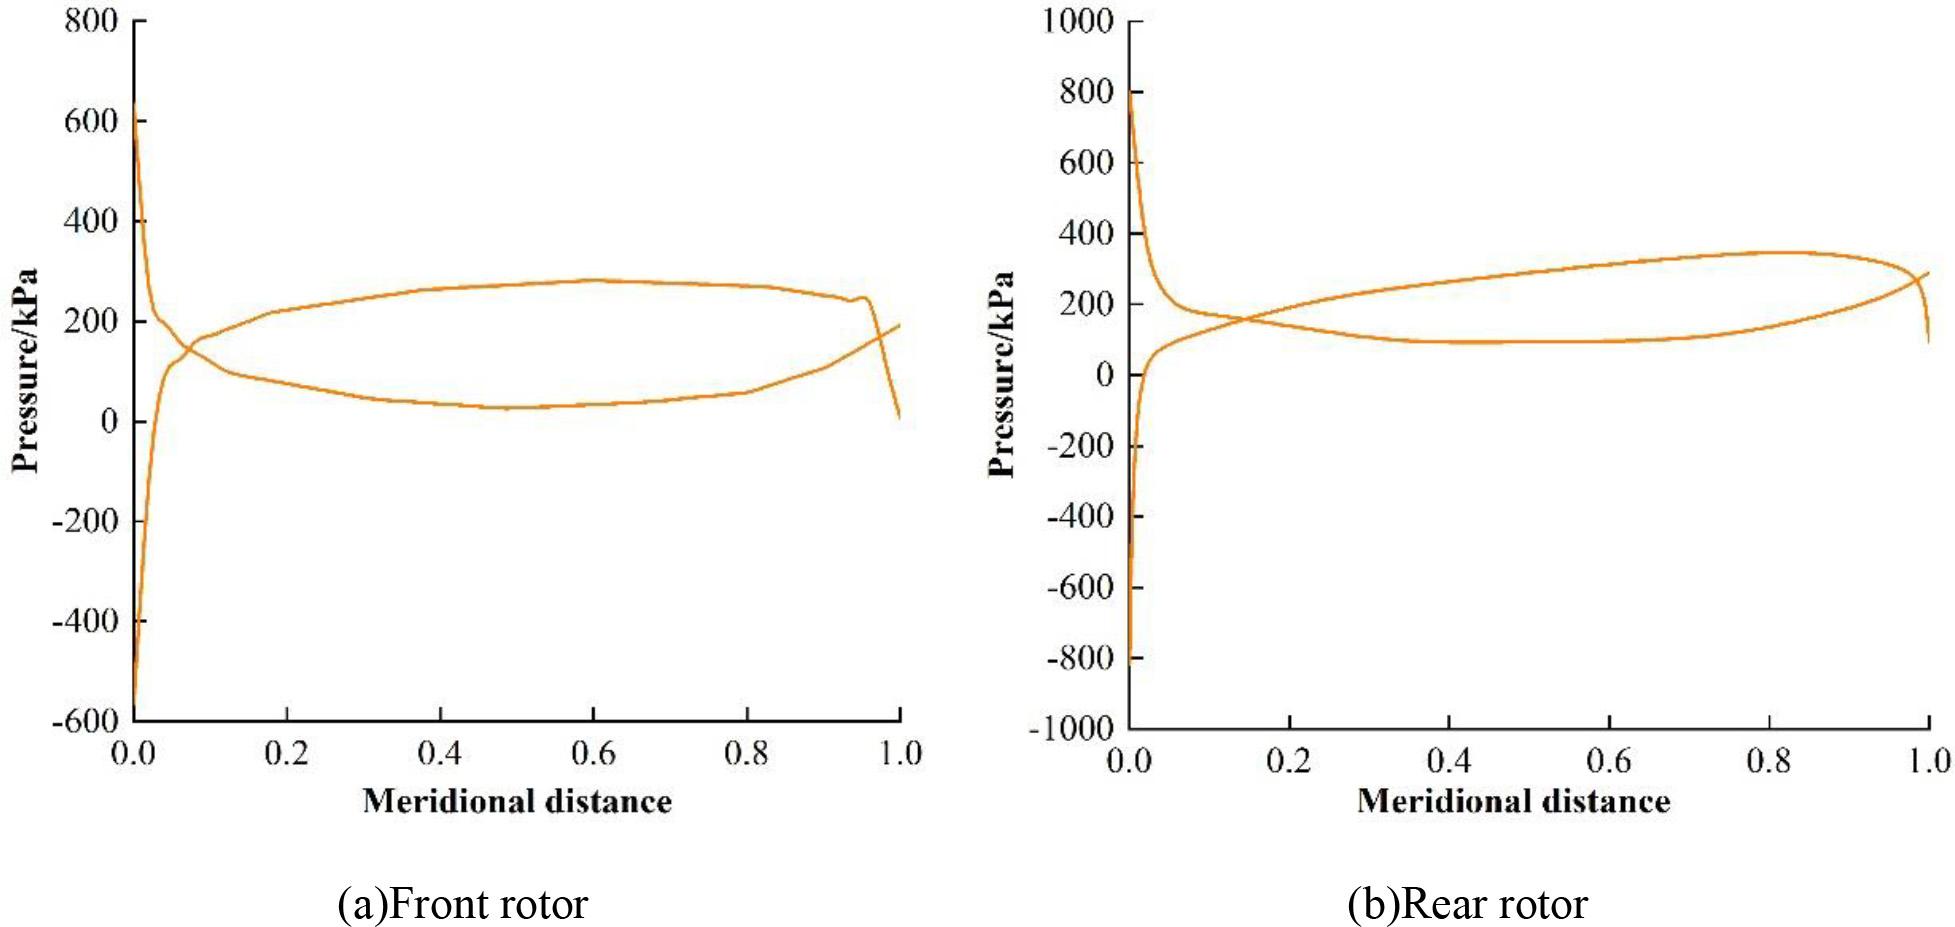
Values of six parameters
| No. | |||||||
| Most likely | 1 | 0.84Hs | 0.54Hs | 0.70e-0.046Hs | 1.15e-0.039Hs | 3.00 | 1.54e-0.062Hs |
| 95% credibility | 2 | 0.95Hs | 0.31Hs | 0.70e-0.046Hs | 1.50e-0.046Hs | 1.35 | 2.48e-0.102Hs |
| 3 | 0.65Hs | 0.76Hs | 0.61e-0.039Hs | 0.94e-0.036Hs | 4.95 | 2.48e-0.102Hs | |
| 4 | 0.84Hs | 0.54Hs | 0.93e-0.056Hs | 1.50e-0.046Hs | 3.00 | 2.77e-0.112Hs | |
| 5 | 0.84Hs | 0.54Hs | 0.41e-0.016Hs | 0.88e-0.026Hs | 2.55 | 1.82e-0.089Hs | |
| 6 | 0.90Hs | 0.44Hs | 0.81e-0.052Hs | 1.60e-0.033Hs | 1.80 | 2.95e-0.105Hs | |
| 7 | 0.77Hs | 0.64Hs | 0.54e-0.039Hs | 0.61 | 4.50 | 1.95e-0082Hs | |
| 8 | 0.73Hs | 0.68Hs | 0.70e-0.046Hs | 0.99e-0.039Hs | 6.40 | 1.78e-0.069Hs | |
| 9 | 0.92Hs | 0.39Hs | 0.70e-0.046Hs | 1.37e-0.039Hs | 0.70 | 1.78e-0.069Hs | |
| 10 | 0.84Hs | 0.54Hs | 0.74e-0.052Hs | 1.30e-0.039Hs | 2.65 | 2.65e-0.085Hs | |
| 11 | 0.84Hs | 0.54Hs | 0.62e-0.039Hs | 1.03e-0.030Hs | 2.60 | 0.53e-0.069Hs |
