Design and Empirical Analysis of Artificial Intelligence-Based Decision Aid Models for College Management

Publié en ligne: 17 mars 2025
Reçu: 28 oct. 2024
Accepté: 15 févr. 2025
DOI: https://doi.org/10.2478/amns-2025-0167
Mots clés
© 2025 Ying Wang, published by Sciendo
This work is licensed under the Creative Commons Attribution 4.0 International License.
With the rapid development of science and technology, artificial intelligence technology has been widely used in various fields. As an important role in cultivating talents and promoting social progress, colleges and universities have also gradually realized the potential of AI technology in the management and decision-making of colleges and universities [1-4]. The application of AI technology provides more scientific and intelligent management and decision-making support for colleges and universities, which helps colleges and universities improve the quality of teaching and achieve sustainable development. Colleges and universities should actively use AI technology to explore more innovative and effective management modes and make greater contributions to cultivate more excellent talents [5-8]. Although there are still some challenges, with the continuous progress of technology, the application of artificial intelligence technology in the management and decision-making of colleges and universities is promising [9-10].
Artificial intelligence-assisted decision-making model refers to the use of artificial intelligence technology to analyze, mine and process the enterprise’s data to help enterprise managers make decisions [11-12]. It can intelligently collect, organize, and analyze the internal or external data of the enterprise, find the law from it, reach effective decision-making [13-14], and provide guiding opinions for the future operation of the enterprise. The application of AI-assisted decision-making models can ensure the efficiency of work while taking into account the quality of work [15-17]. Therefore, AI-assisted decision-making is widely used in various fields, such as finance, healthcare, retail, etc., and can be used in a more comprehensive and systematic perspective. The application of AI-assisted decision-making in the management decision-making of colleges and universities has also gradually been emphasized to provide more analyses and references for the work of colleges and universities [18-20].
In this paper, data mining techniques are used to dig deeper into the teaching management data in the database of the Academic Affairs system to collect data related to student performance as well as student activity management. In order to efficiently analyse the relevant data topics, it is necessary to establish a data warehouse. And the format and structure of data from different sources are unified and standardised. The data stored in the data warehouse is summarized using online analysis techniques, and the results of the performance analysis are visualized.The Apriori algorithm was chosen to conduct an association analysis of courses and gather strong association rules between them.Finally, the executive power of the university management decision-making system is evaluated and analyzed to provide reference opinions for the adjustment of education management.
With the rapid development of the Internet, the era of big data has arrived. The management bodies of colleges and universities are facing the challenge of big data, and the use of big data technology to mine the hidden information or value behind these data can discover the problems and development trends of the school, thus providing a certain scientific basis and decision-making support for college and university leaders to make decisions. To further improve the level of management decision-making in universities, the first step is to introduce modern decision-making management knowledge into contemporary management, to find the decision-making theory and method suitable for the university itself so as to design and carry out targeted decision-making planning, implementation of decision-making programmes, in order to ultimately improve the efficiency of decision-making and achieve decision-making optimization. Decision-making is in order to achieve a specific goal, according to the objective possibility, in possession of certain information and experience based on the use of certain tools, skills and methods, the factors affecting the achievement of the goal of the analysis, calculation and judgement of the selection of the best, to decide on the future action. The study of decision analysis is crucial for
According to the characteristics of the current college MIS, as well as the characteristics of the demand for university teaching management decision support system, first of all, the current data of each MIS system, such as student registration management, performance management, enrollment and employment management and other systems of the current data and historical database data and some other data by the data extraction, purification, conversion, loading into the data warehouse, and then carry out data mining on the basis of the data warehouse, the general framework of the system is shown in Figure 1. The three-layer structured architecture is adapted to the characteristics of the teaching decision-making needs of colleges and universities. The three layers are connected through the teaching data warehouse, effectively realising data-driven, and the modification, addition or deletion of functional modules in any layer has little impact on the overall system.
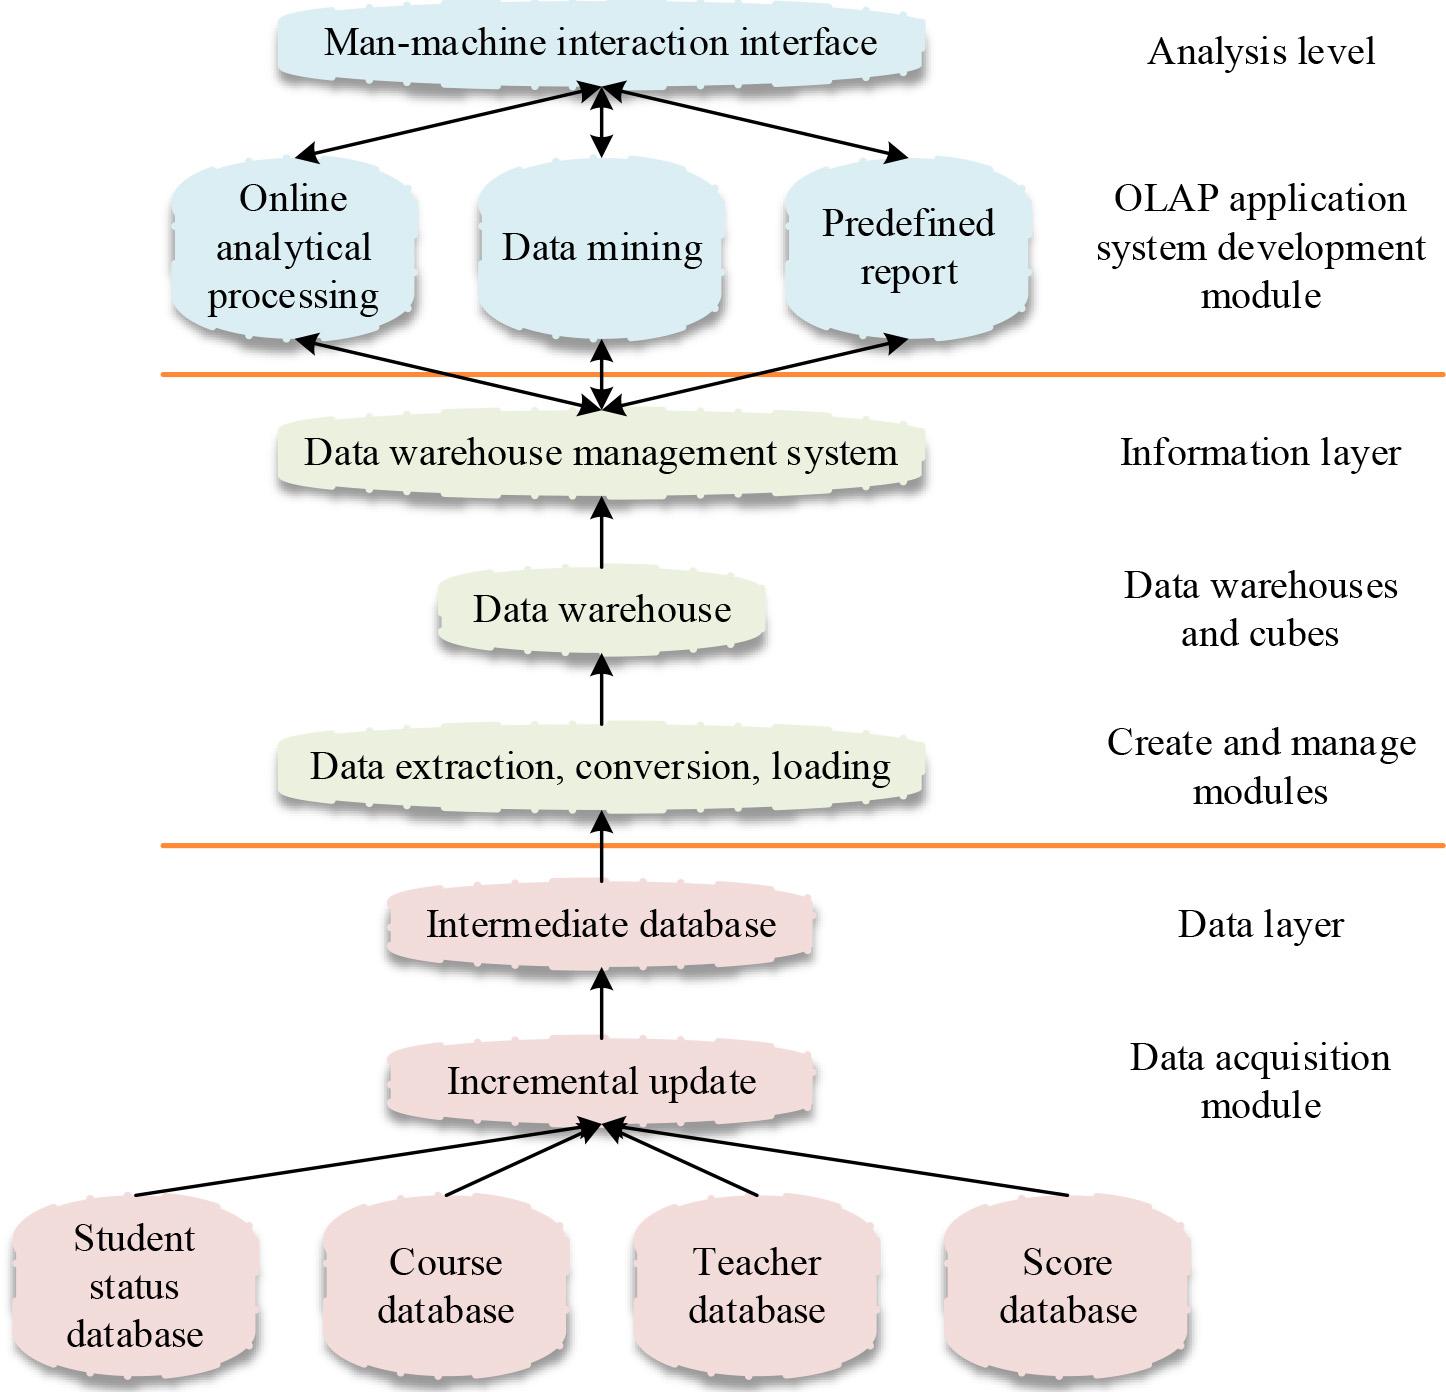
System framework
A data warehouse is a subject-oriented, integrated, and relatively stable collection of data reflecting historical changes used to support management decisions. In data warehousing, data warehouse architectures usually use several approaches to data modelling, i.e., conceptual, logical, and physical models. Nowadays, the basic conceptual modelling approach based on information modelling, model and snowflake star modelling approach based on logical modelling approach 3NF and star model physical modelling, is the more popular physical modelling approaches.
Data warehouses integrate data, but do not directly support more complete analyses and multidimensional views, and lack flexibility in decision-making conditions. It only analyzes the basis of the decision. There must also be a powerful tool for analysis and decision support, so online analytical processing (OLAP) technology came into being.
Online analytical processing is designed for specific data storage and analysis techniques that provide decision analysis from a multidimensional viewpoint for the benefit of decision makers and senior managers. The data warehouse model design phase is equivalent to the initial phase, while the data warehouse-based online analytical processing techniques support a more comprehensive grasp of the data and understanding of the results through the aggregation of multidimensional data, pre-storage of aggregated results, support for multiple perspectives of the data, multidimensional data and observation support.OLAP technology is mainly used in data warehouses for data for the aggregation of statistical surfaces, attempting to unify application OLAP technology is mainly used in data warehouses to aggregate statistical surfaces of data in an attempt to respond to complex survey requirements of non-data processing professionals in a short period with a unified application logic and data model.
Another very powerful tool in AI is data mining techniques, which can be used to help organizations support decision-making.Data mining is a deeper search of source data. Source data includes not only the data in the data warehouse but also other categories of data. Data mining, also known as “knowledge discovery in large databases”, is a modern and powerful IT tool that can be used to extract useful information. In order to make better decisions, the study of databases and information technology provides an efficient way to store and process this valuable data. Data mining is the process of extracting useful information and patterns from vast amounts of data.It is also known as the process of knowledge discovery from data, knowledge extraction and data/pattern analysis knowledge mining.
Data mining involves many subject areas and methods, which can be categorised according to several aspects, such as database types, mining objects, mining tasks, mining methods, and techniques.
Classification is the mapping of existing data records to a given category based on predefined classification labels (classifiers) by some method. Classifiers vary according to the application context and data characteristics, and no classifier can be adapted to any application context and data characteristics, but it can be integrated using a combination of methods or selection methods.
Clustering is the process of aggregating data without categories into groups according to their similarities and describing the meaning of each group. The aim of clustering is to minimize the gap between data in the same group and maximize the difference between different groups as much as possible.
Correlation analysis refers to the search for the existence of certain specific regularities between two or more data sets, such as frequent patterns, temporal patterns, causal structures, etc. Or it is the discovery of hidden networks of correlations between large amounts of data. Correlation analysis is to find the hidden correlation network between the data. There are many rules of correlation between a large amount of data, but there are some correlations that are not certain or useless, so we need to use “credibility” or “support” to eliminate our unwanted correlations. Correlation.
Regression analysis is the process of building mathematical models by finding causal relationships between dependent and independent variables and testing the data against the models so that one can observe and predict how the dependent variable will change when the independent variable changes.
Predictive analytics is through the analysis of a large number of continuous historical data, from which the existence of this data cycle change law, that is, the predictive model, and the use of the model for the future of a certain time value of the data may appear in the state of the characteristics of the prediction.
Inevitably, there will be some abnormal data in the database. These abnormal data are not useless. On the contrary, they are also very likely to be particularly important. Deviation analysis, sometimes referred to as comparative analysis, compares the differences between observed results and the original reference values and reveals the underlying causes.
At present, the most used method in association rule research is the “support and confidence” mathematical model, which involves the following concepts.
Transaction set: Let
Item set: Let
Degree of support: the number of transactions in the
If
Confidence: Let
Association rule: It refers to the trust relationship that satisfies certain conditions mined from a large amount of transaction data. An association rule can be expressed by implication
The association rule mining process is divided into two steps:
Find out all the frequent itemsets. Find the strong association rules from the frequent itemsets.
The task of the first subproblem is to quickly and efficiently find out all the frequent itemsets in the transaction set, which is the core problem of association rule mining and the standard of association rule mining algorithms, and the solution of the second subproblem is relatively easy and direct, and most of the current association rule mining algorithms are proposed for the first problem.
When it comes to association rule algorithms, the Apriori algorithm is one of the most typical algorithms, which mines rules that are Boolean in classification and contain only one-dimensional association rules involving only a single layer of concepts. The Apriori algorithm involves two main steps: extracting all the frequent itemsets L that satisfy the
Cow into frequent 1-item sets: first all the data items in the whole transaction D to generate candidate 1-item sets recorded as
Join: If two
Here
Pruning: In the
Generate
Repeat the link~generation steps until
The number of students enrolled in the college entrance examination each year since 2012 is shown in Table 1. Starting in 2013, China began to significantly expand the scale of higher education enrolment, and the enrolment for that year was determined to be 1.602 million, compared with 1.085 million in 2012, an increase of 517,000. And before 2012, the average annual increase in higher education development was about 9 percent.After the expansion, China’s enrollment in higher education and the number of students has continued to increase every year. According to the Ministry of Education’s education development statistics bulletin for the previous year released on 06 May 2022, the total scale of all types of higher education in the country exceeded 27 million people in 2021, and the gross enrollment rate of higher education reached 23%, which has crossed the stage of massification of higher education that has been internationally recognised. Now, the scale of China’s higher education has successively surpassed that of Russia, India and the United States, becoming the world’s first. After only a few years of hard work, and with a per capita GDP of more than US$1,000, China’s higher education development has moved from elite education to mass education, completing a path that took other countries 30 to 50 years or even longer. The dispersal and serious shortage of management resources, the difficulty of management and the increase in management costs have forced school leaders and management departments to disperse their energies, and managers have been “overworked”. There is also the problem of management friction. This problem mainly exists in multi-school mergers (especially “pull together” type mergers) for various reasons: the formation of “small groups”, low mutual trust, communication difficulties, decision-making difficult to form, resulting in poor order, and management (c) Reduced effectiveness. Therefore, the original teaching management system must be well planned and rebuilt through certain management strategies and management techniques so that it can better meet the needs of the new era of multi-campus operation and teaching management of colleges and universities so that each campus can provide the community with a consistent quality of education, talent training quality.
College entrance examination admissions number
| Year | The number of students (units: 10,000) | Year | The number of students (units: 10,000) |
| 2012 | 108.5 | 2018 | 452.7 |
| 2013 | 160.2 | 2019 | 510.6 |
| 2014 | 218.4 | 2020 | 552.2 |
| 2015 | 270.3 | 2021 | 574.8 |
| 2016 | 319.6 | 2022 | 600 |
| 2017 | 379.5 | 2023 | 630 |
Data mining techniques are used to capture the distribution of students’ grades, i.e., their daily performance, and a detailed demonstration of the methodology is presented below as an example of a marketing programme at a higher education institution at level 2023. Based on experience, we believe that the gender of students has an impact on the learning effect of courses of different natures, so we want to verify whether this assumption is valid, and if so, what is the specific form of this impact. We classify the courses into three categories according to the nature of “science”, “arts” and “other”, combined with the classification of students’ gender, choose a five-level scale, and draw a bubble diagram as shown in Figure 2. The bubble chart is shown in Figure 2. In the graph, the horizontal coordinates represent the nature of the course, and the vertical coordinates represent the different grade ranges. The size of the dots represents the percentage of the number of people. This is due to the different number of courses included in each category. The number of students in each course is different, and the number of male and female students in the class is also different. Based on the number of people, adjusting the size of the dots in the bubble chart is obviously not appropriate, so we choose to use the percentage of the number of male students and female students in the range of grades of the different nature of the course to adjust the size of the dots. We can see the distribution of the number of boys and girls in the range of grades for courses of different natures: in the liberal arts courses, the number of girls with grades in the 80-90 range is the highest, accounting for about 32 per cent of the total, while there is little difference in the number of boys with grades in the 70-90 range, and the number of girls with grades higher than 80 is greater than the number of boys. In science courses, the number of girls with grades in the 60-80 range is comparable and accounts for the largest share, totalling about 80 per cent, while the number of boys with grades in the 70-90 range is the largest, and the share of boys with grades higher than 80 is significantly higher than that of girls. In other categories, the distribution of male and female course grades was essentially the same.

Different classes of boys and girls
Association rules are utilized to identify connections between attributes in a transaction to predict future transactions or guide decision-making. A student’s daily performance while taking a course largely determines the course grade, but the specific relationship between each measure of daily performance and a particular course grade is not clear, and it is not possible to assign a threshold value to each indicator, which needs to be further analysed. Daily performance mainly includes three aspects: attendance, homework submission, and midterm exams. Taking into account the accessibility and practicality, attendance was selected as a measure of students’ daily performance. This analysis for a course using scatterplots to determine whether there is a correlation between grades and daily performance indicators, as well as the general trend of changes in grades with the indicators, where the rate of homework submission, the rate of excellence in homework and the rate of failure in homework are all descriptive of the coursework situation, put in the same graph for analysis to be able to more intuitively show the difference in the impact of the various indicators.
The correlation between attendance and grades in Applied Higher Mathematics is shown in Figure 3, which shows that there is a positive correlation between attendance and course grades, with grades close to the 60-100 mark range when the attendance rate is 120 per cent. Since there is an objective order of precedence between attendance and course grades, this result implies that the higher the attendance rate, the higher the probability of obtaining a high grade, all other things being equal, but it does not mean that a high attendance rate will necessarily result in a high grade. There are four points on the horizontal axis, i.e., different attendance rates correspond to course grades close to 0. This is due to the university’s rule disqualifying students with less than 60% attendance from taking the exam for this course, and the score was recorded as 0.
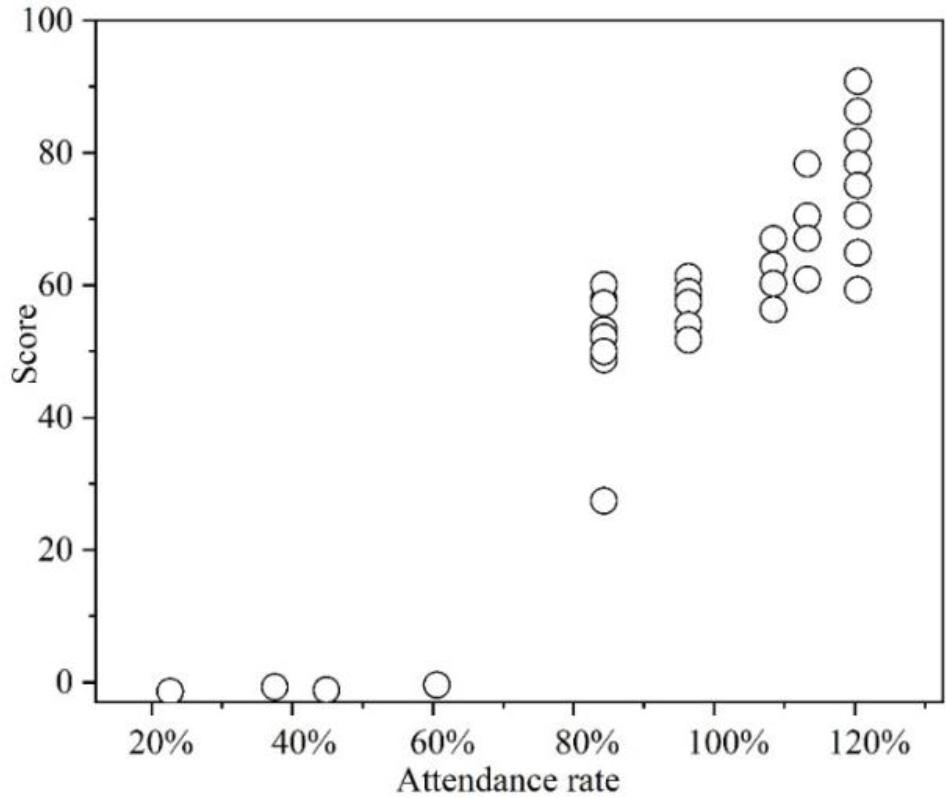
Study the relationship between attendance and filling
Statistical analysis allows preliminary observation of the information present in the data, and in this section, we will find a reasonable way to use the Apriori algorithm for analysis from the perspective of course grades in order to dig out the pre-courses of the assigned courses. The data of 14-course grades of three classes of marketing major of grade 2023 with a total of 145 students, A~O: occupational, psychological training, physical education, ideology and politics, career planning, marketing psychology, foundation of economics, foundation of marketing, foundation of statistics, foundation of management, commodity identification, situation and policy, channel management, modern Chinese history, and business operation simulation training are selected as an example, and the data are analysed by using the Weka The Apriori algorithm provided by the platform is used to illustrate the course association analysis method. Data preprocessing has been initially carried out when constructing the data warehouse to ensure the correctness and consistency of the data, while additional data processing is required for specific algorithms. First of all, the Apriori algorithm requires that the input data format is discrete, so we choose the five-level grade data for course correlation analysis. The Weka platform requires that the input data be in English format, so we use the course code to represent the course. The student number is recorded as “D”, and the grade levels are “Excellent”, “Good”, “Medium”, “Pass”, “Fail”, “Probationary”, “No”, “Absence”, and the processed partial data are shown in Table 2. The performance in the Situation and Policy course is related to several courses, including Occupational Psychology Training, Commodity Identification, Fundamentals of Marketing, Psychology of Marketing, Channel Management, Business Management Simulation Training and Fundamentals of Economics. If a student scores good grades in 2 or 3 of these courses, they have a 75 per cent chance of scoring a good grade in Situation and Policy.
Grade and letter conversion
| ID | 1 | 2 | 3 | 4 | 5 | 6 | 7 | 8 |
| A | Good | Good | Good | Good | Good | Medium | Good | Good |
| B | Good | Medium | Good | Medium | Good | Medium | Medium | Medium |
| C | Good | Good | Good | Medium | Good | Medium | Good | Good |
| D | Good | Good | Good | Excellence | Excellence | Good | Excellence | Pass |
| E | Good | Good | Good | Good | Excellence | Excellence | Good | Good |
| F | Pass | Good | Medium | Medium | Good | Pass | Good | Medium |
| G | Pass | Good | Medium | Medium | Medium | Pass | Good | Medium |
| H | Medium | Good | Good | Medium | Medium | Good | Good | Medium |
| I | Medium | Medium | Good | Good | Pass | Pass | Medium | Pass |
| J | Excellence | Medium | Medium | Medium | Pass | Medium | Medium | Pass |
| K | Good | Good | Good | Good | Excellence | Excellence | Good | Good |
| L | Pass | Good | Pass | Pass | Pass | Pass | Good | Pass |
| M | Excellence | Good | Excellence | Good | Excellence | Good | Good | Medium |
| N | Good | Excellence | Good | Good | Good | Excellence | Excellence | Excellence |
| O | Medium | Medium | Medium | Pass | Medium | Good | Good | Medium |
The grass-roots organisations of colleges and universities are the backbone of teaching management and the foundation on which schools carry out teaching management. Therefore, the role of grass-roots organisations in teaching management should be highlighted, the course of action of teachers and teaching managers should be formulated, and their leading role in teaching management evaluation should be given full play so as to enhance teaching management executive power. In carrying out the evaluation process of teaching management execution, two basic principles should be followed. The first step is to eliminate psychological barriers to evaluation, reduce antipathy towards the evaluated, and guide teachers to improve their sense of responsibility. The second is to formulate a reward and punishment system that is compatible with incentives and constraints so as to promote the continuous improvement of teaching and teaching management.
The calculation results are shown in Table 3. Among the five evaluation grades of excellent, good, medium, passing and poor, the percentage of those evaluated as excellent, good and medium are 35.8%, 28.3% and 18.9%, respectively, and the total percentage of experts evaluating the execution of the school as medium and above grades is 83%, and the experts evaluate the execution of the school’s instructional management relatively well. The percentage of those evaluated as passing and poor is 9.4 per cent and 7.5 per cent, respectively, which is not low and deserves the attention of school teaching managers.
Evaluation result
| Index | Evaluation grade | ||||
| Excellence | Good | Medium | Pass | Bad | |
| Strategy recognition of the school | 0.4 | 0.2 | 0.2 | 0 | 0.1 |
| Understanding of the school’s strategic goals | 0.3 | 0.3 | 0.3 | 0.1 | 0.2 |
| The consistency of the implementation plan and the target | 0.5 | 0.4 | 0.1 | 0.1 | 0 |
| Operational degree of implementation plan | 0.4 | 0.3 | 0.2 | 0.1 | 0 |
| The degree of democratization of implementation | 0.3 | 0.3 | 0.2 | 0.2 | 0.1 |
A sound teaching management mechanism and system are the guarantee for the smooth implementation of teaching management in schools. Schools must innovate the management mechanism, improve the system to be compatible with incentives and constraints, and stimulate teachers’ enthusiasm for teaching. Firstly, establish and improve the assessment mechanism. Decompose the teaching objectives for each unit of instruction, and all teachers work together to fulfill their teaching tasks. Establish a sound assessment mechanism to evaluate different teaching tasks separately. Secondly, establish an effective incentive mechanism to mobilise the enthusiasm of teachers and teaching managers. Thirdly, create a harmonious teaching environment.
In this paper, we first constructed an intelligent decision-making system for college management using a data warehouse, online analysis, data mining, and other techniques. Secondly, the university management decision-making system is used to visualise and analyse students’ grades, daily life data and inter-course correlations. Finally, the execution of the intelligent college management decision-making system was evaluated. The results show that the use of an intelligent college management decision-making system is necessary for the substantial increase in the size of higher education enrolment since the expansion of enrollment. Taking the marketing students of a higher education institution as the object of study, the female students’ grades in the liberal arts courses were mainly concentrated in the range of 80-90. Students’ attendance was positively correlated with course grades. Forms and policies, occupational psychology training, commodity identification, and marketing fundamentals were correlated between the courses.The total percentage of smart college management decision-making systems with an execution rating of medium or above was 83%.