A long-term study of the effect of smart device use on student fitness in a university physical education programme
17 mar 2025

Acerca de este artículo
Publicado en línea: 17 mar 2025
Recibido: 22 oct 2024
Aceptado: 09 feb 2025
DOI: https://doi.org/10.2478/amns-2025-0161
Palabras clave
© 2025 Maosen Ma, published by Sciendo
This work is licensed under the Creative Commons Attribution 4.0 International License.
Figure 1.
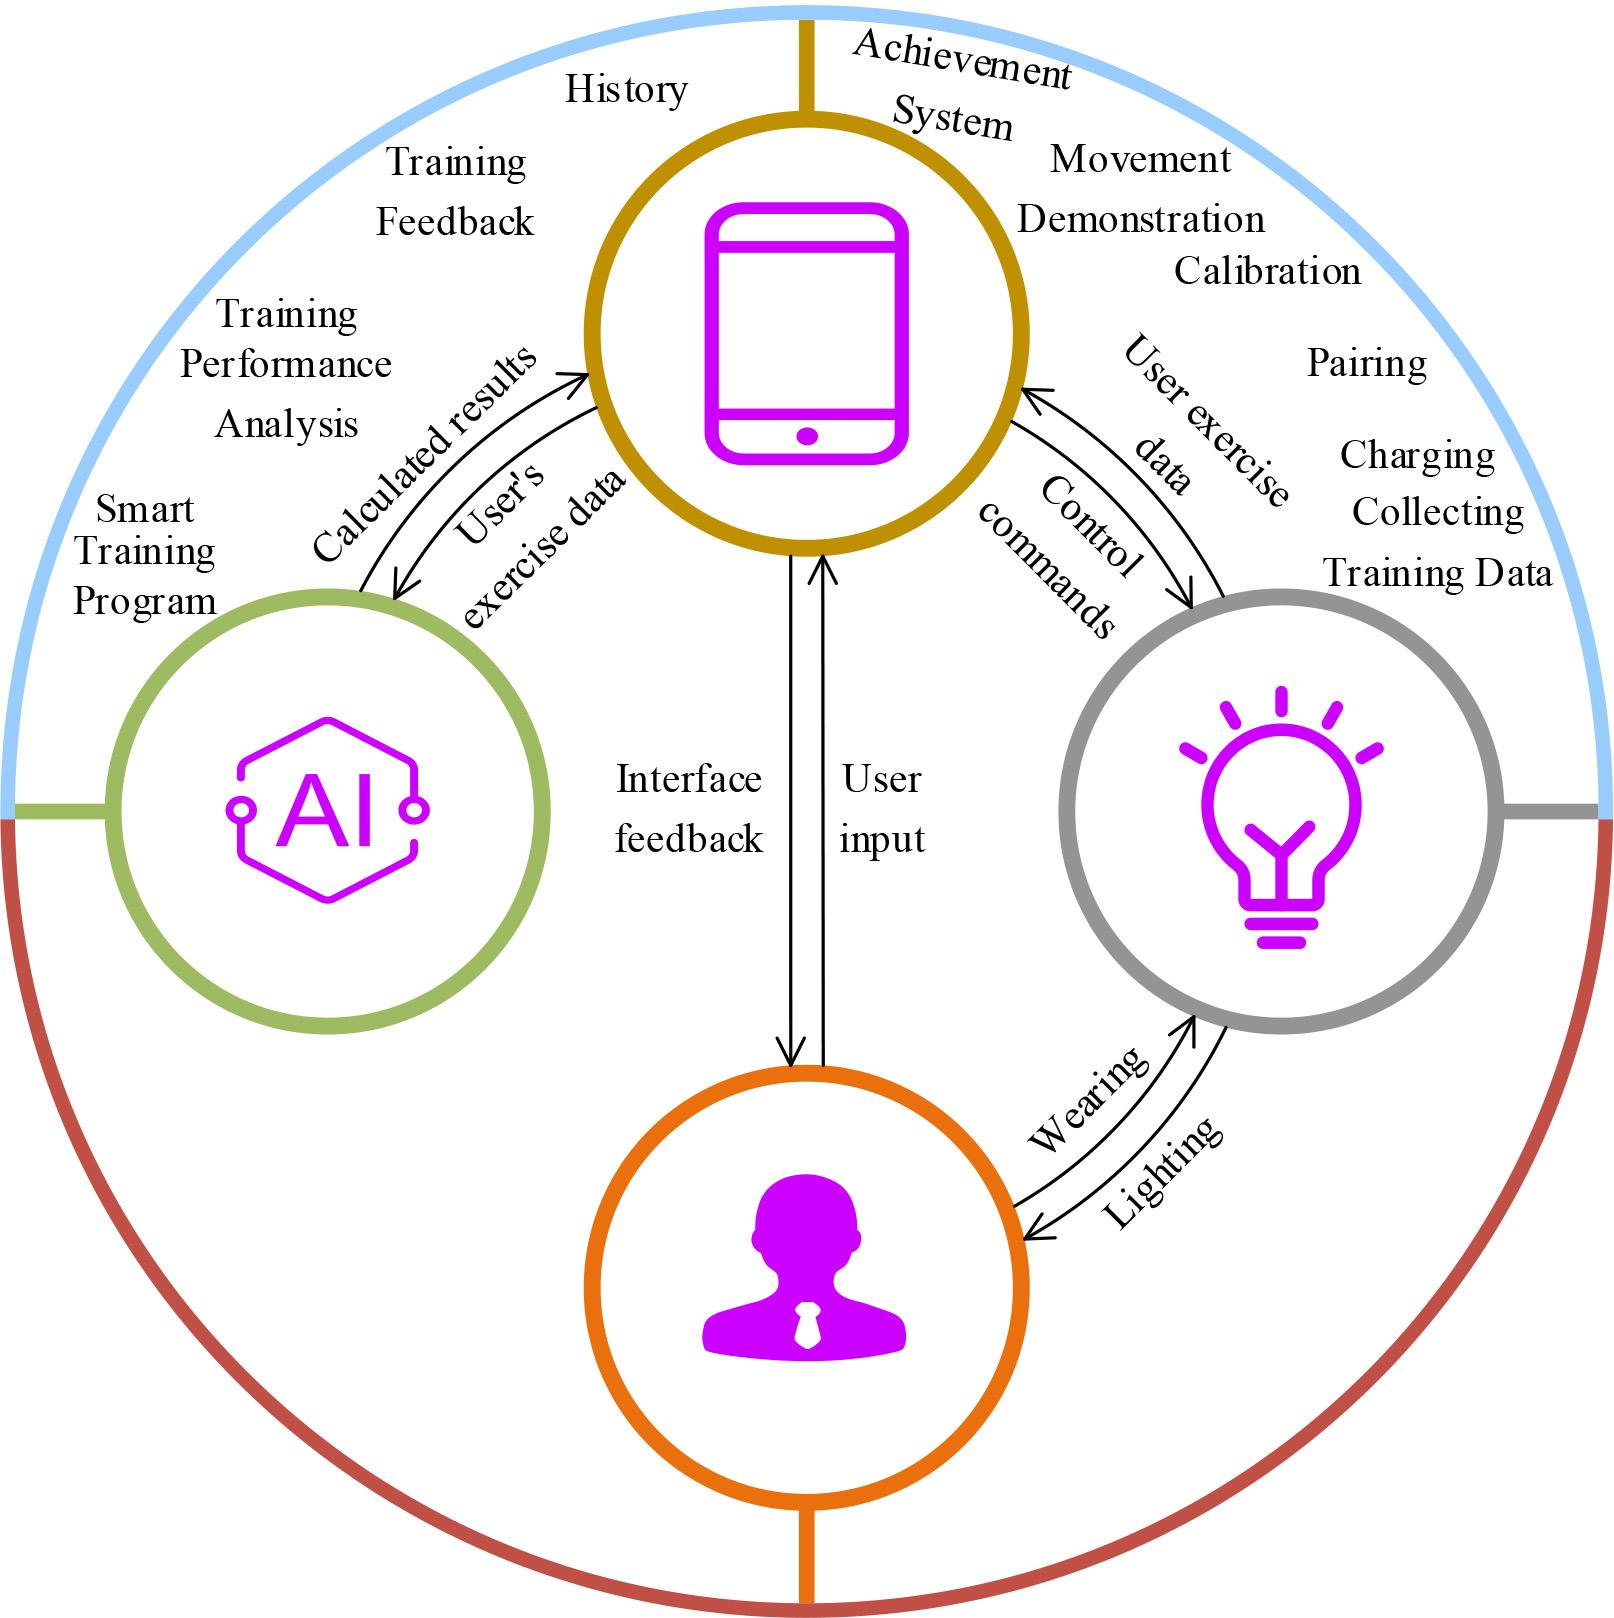
Figure 2.
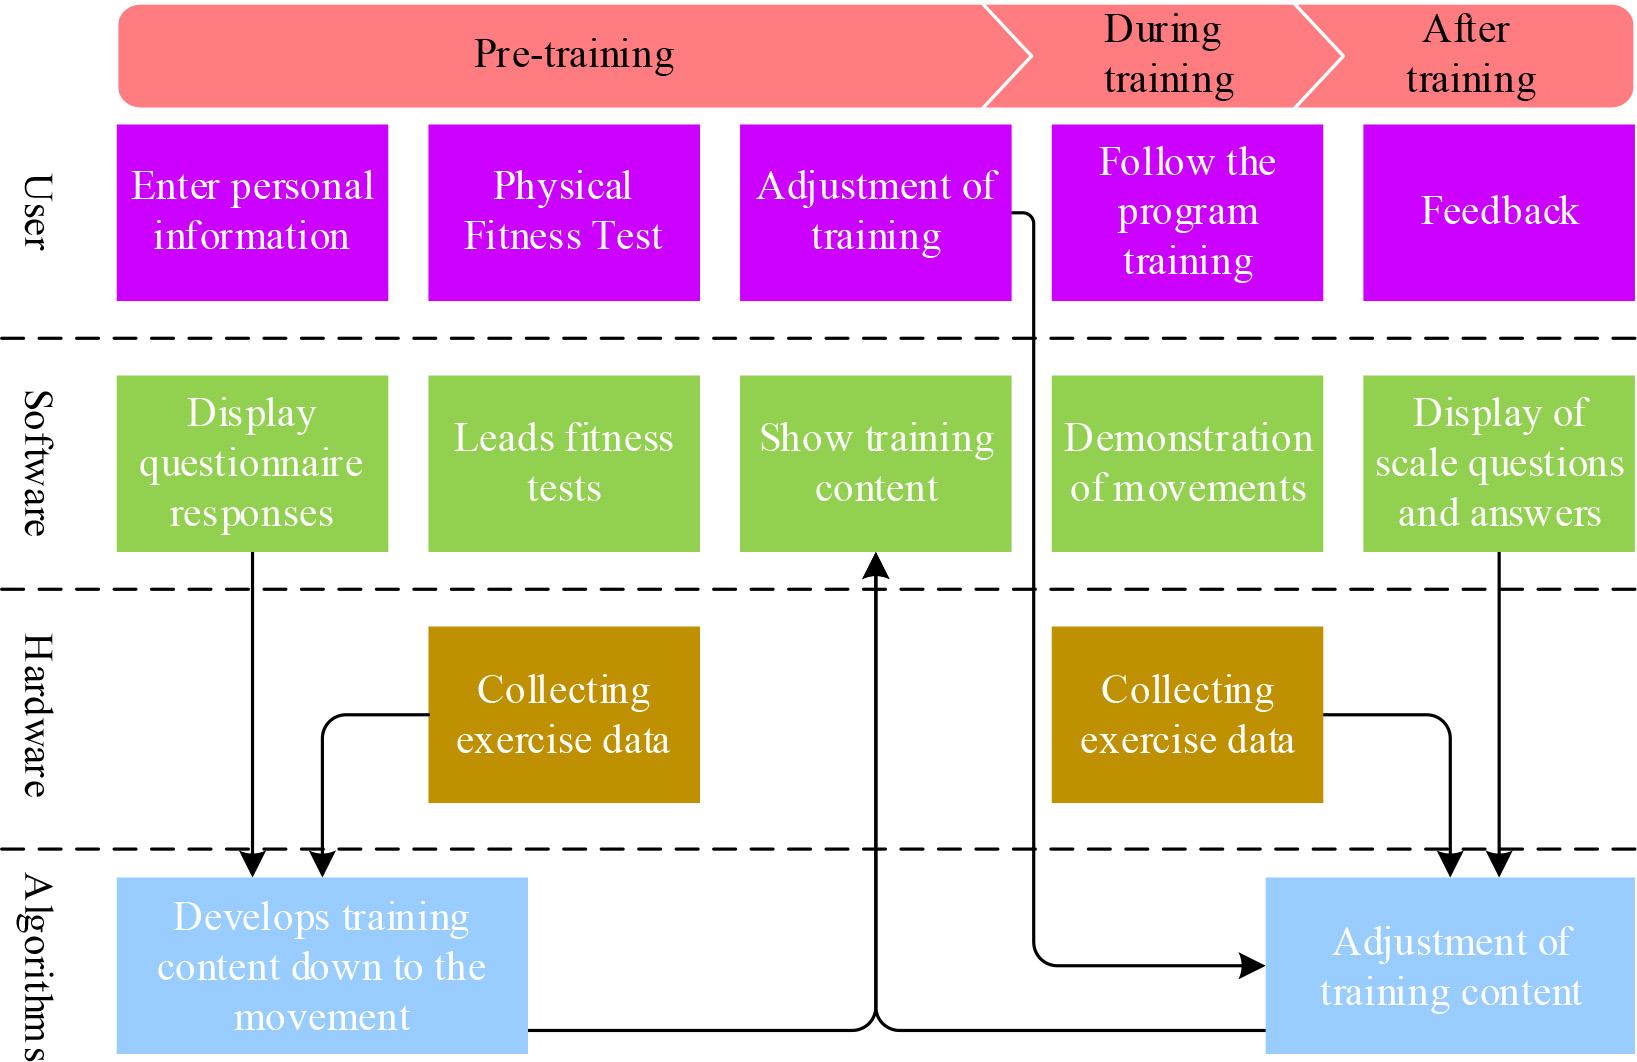
Figure 3.
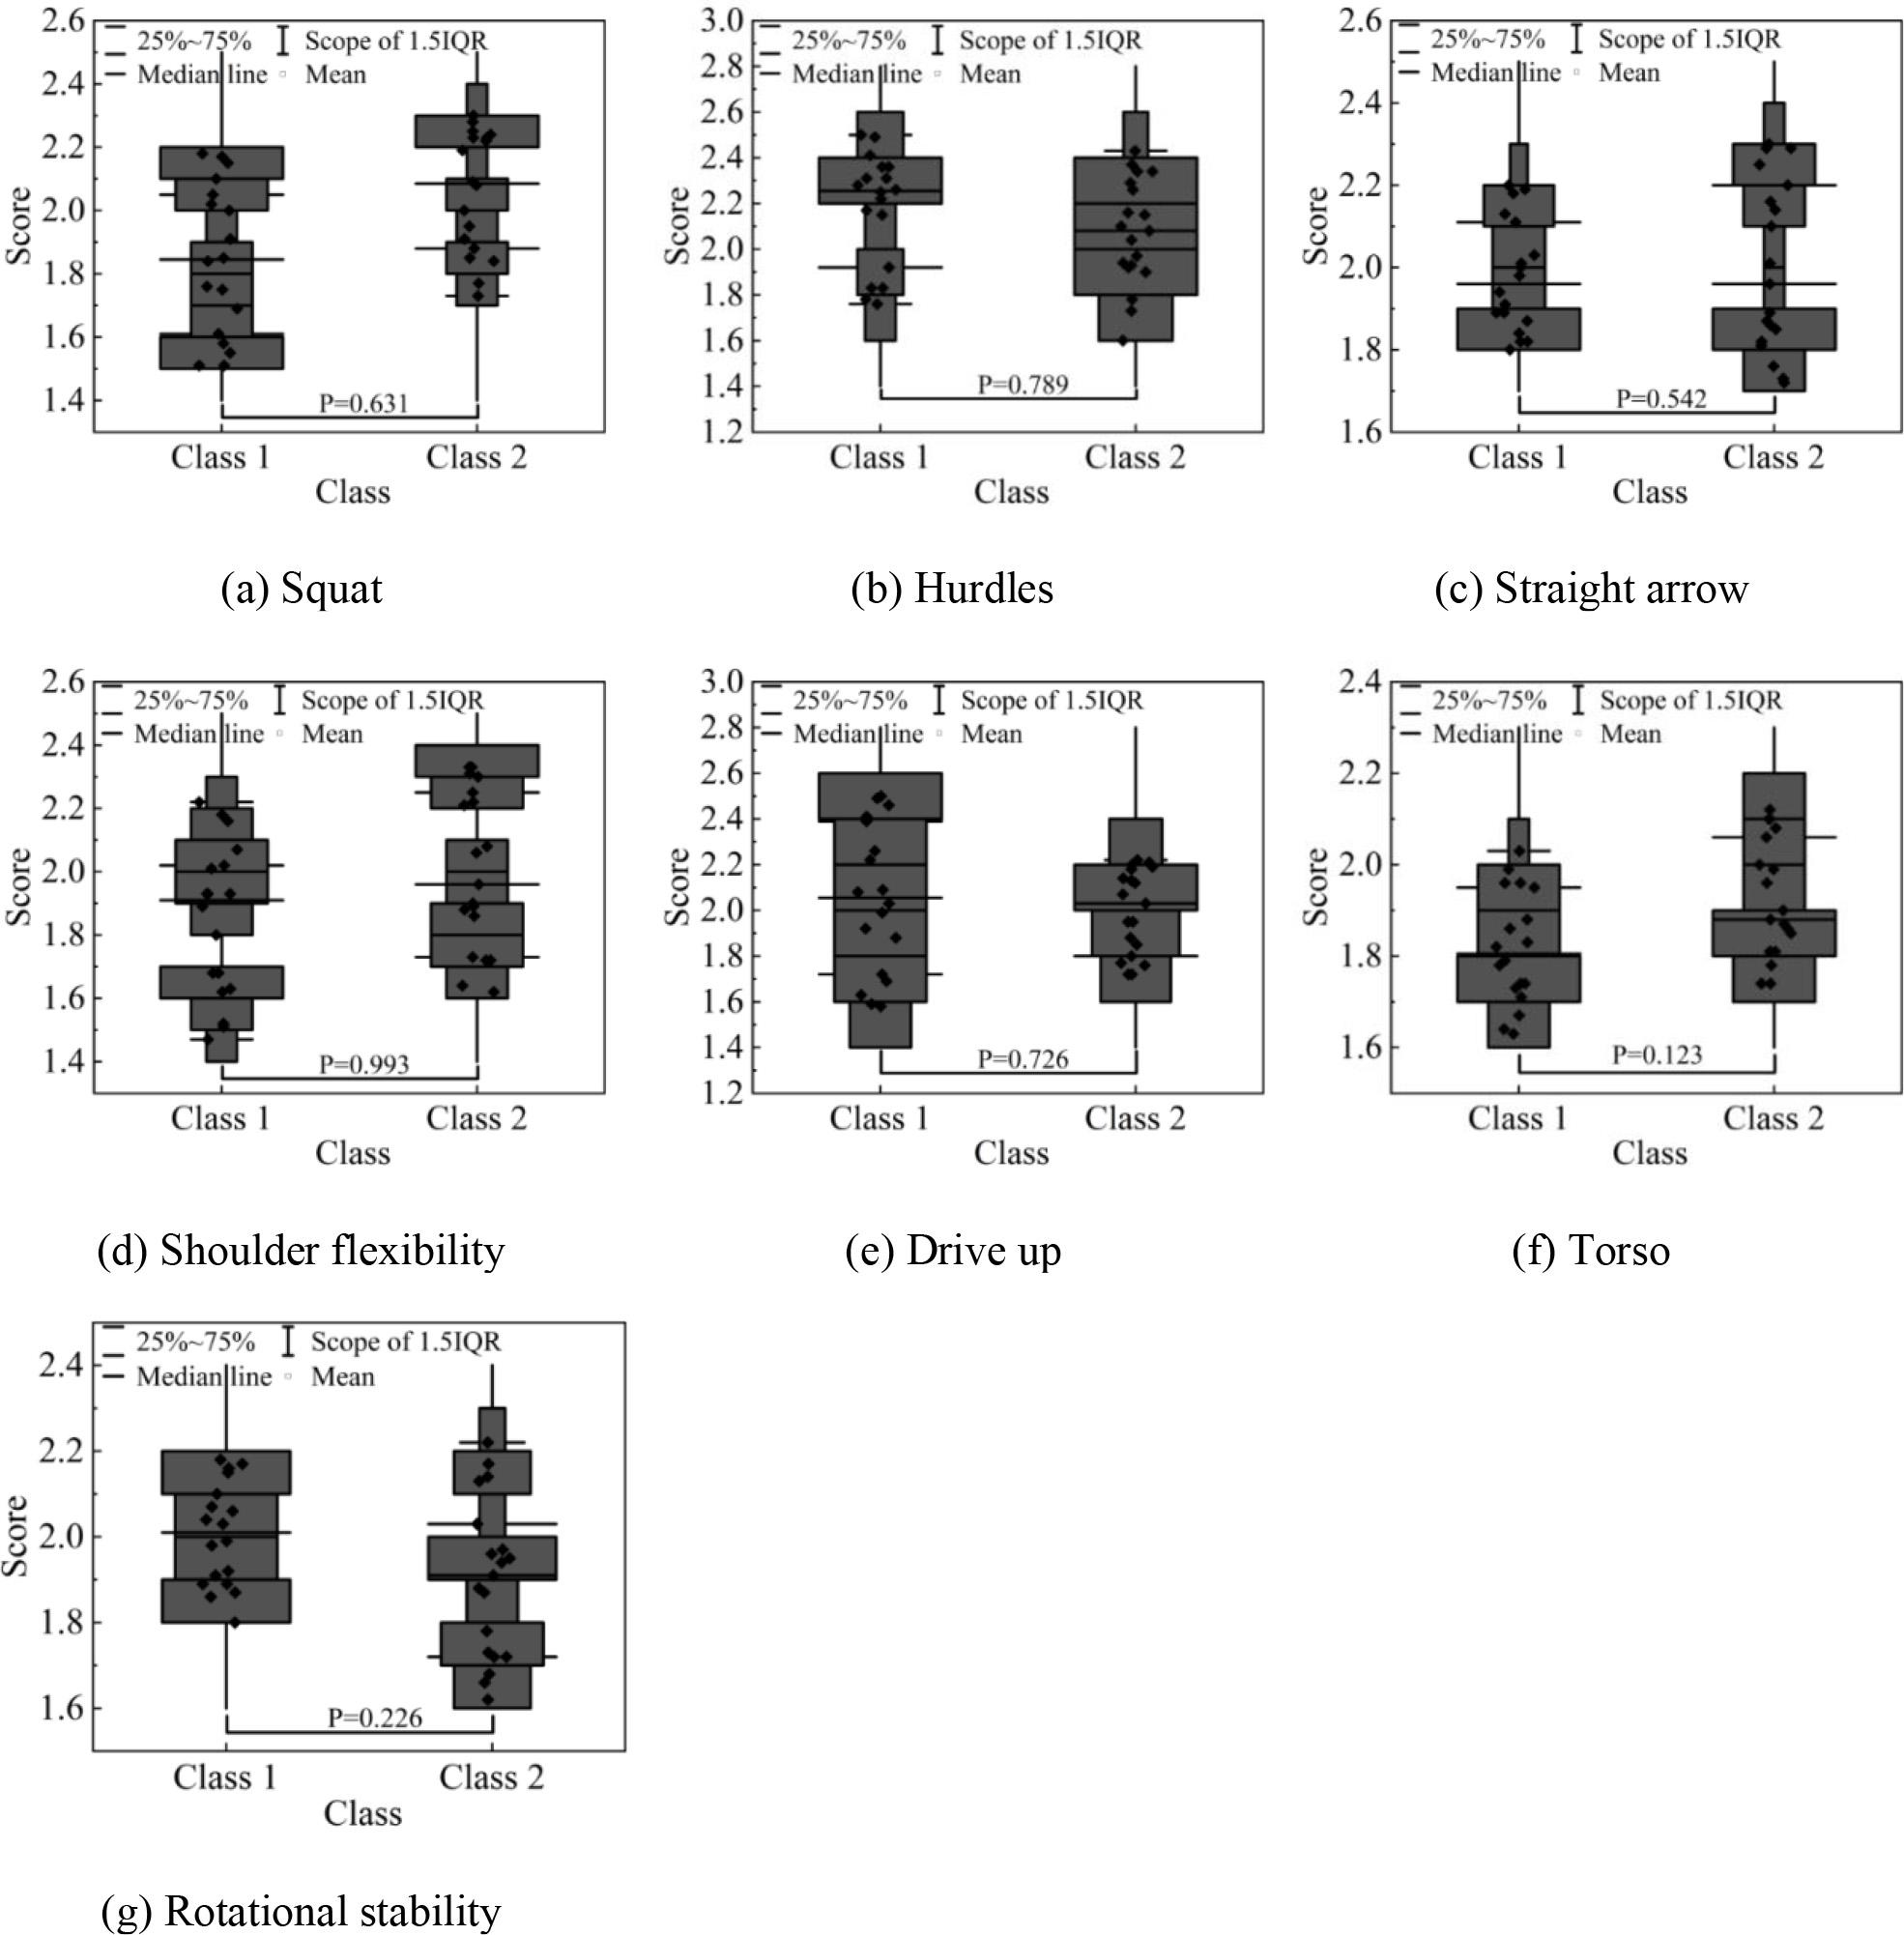
Figure 4.
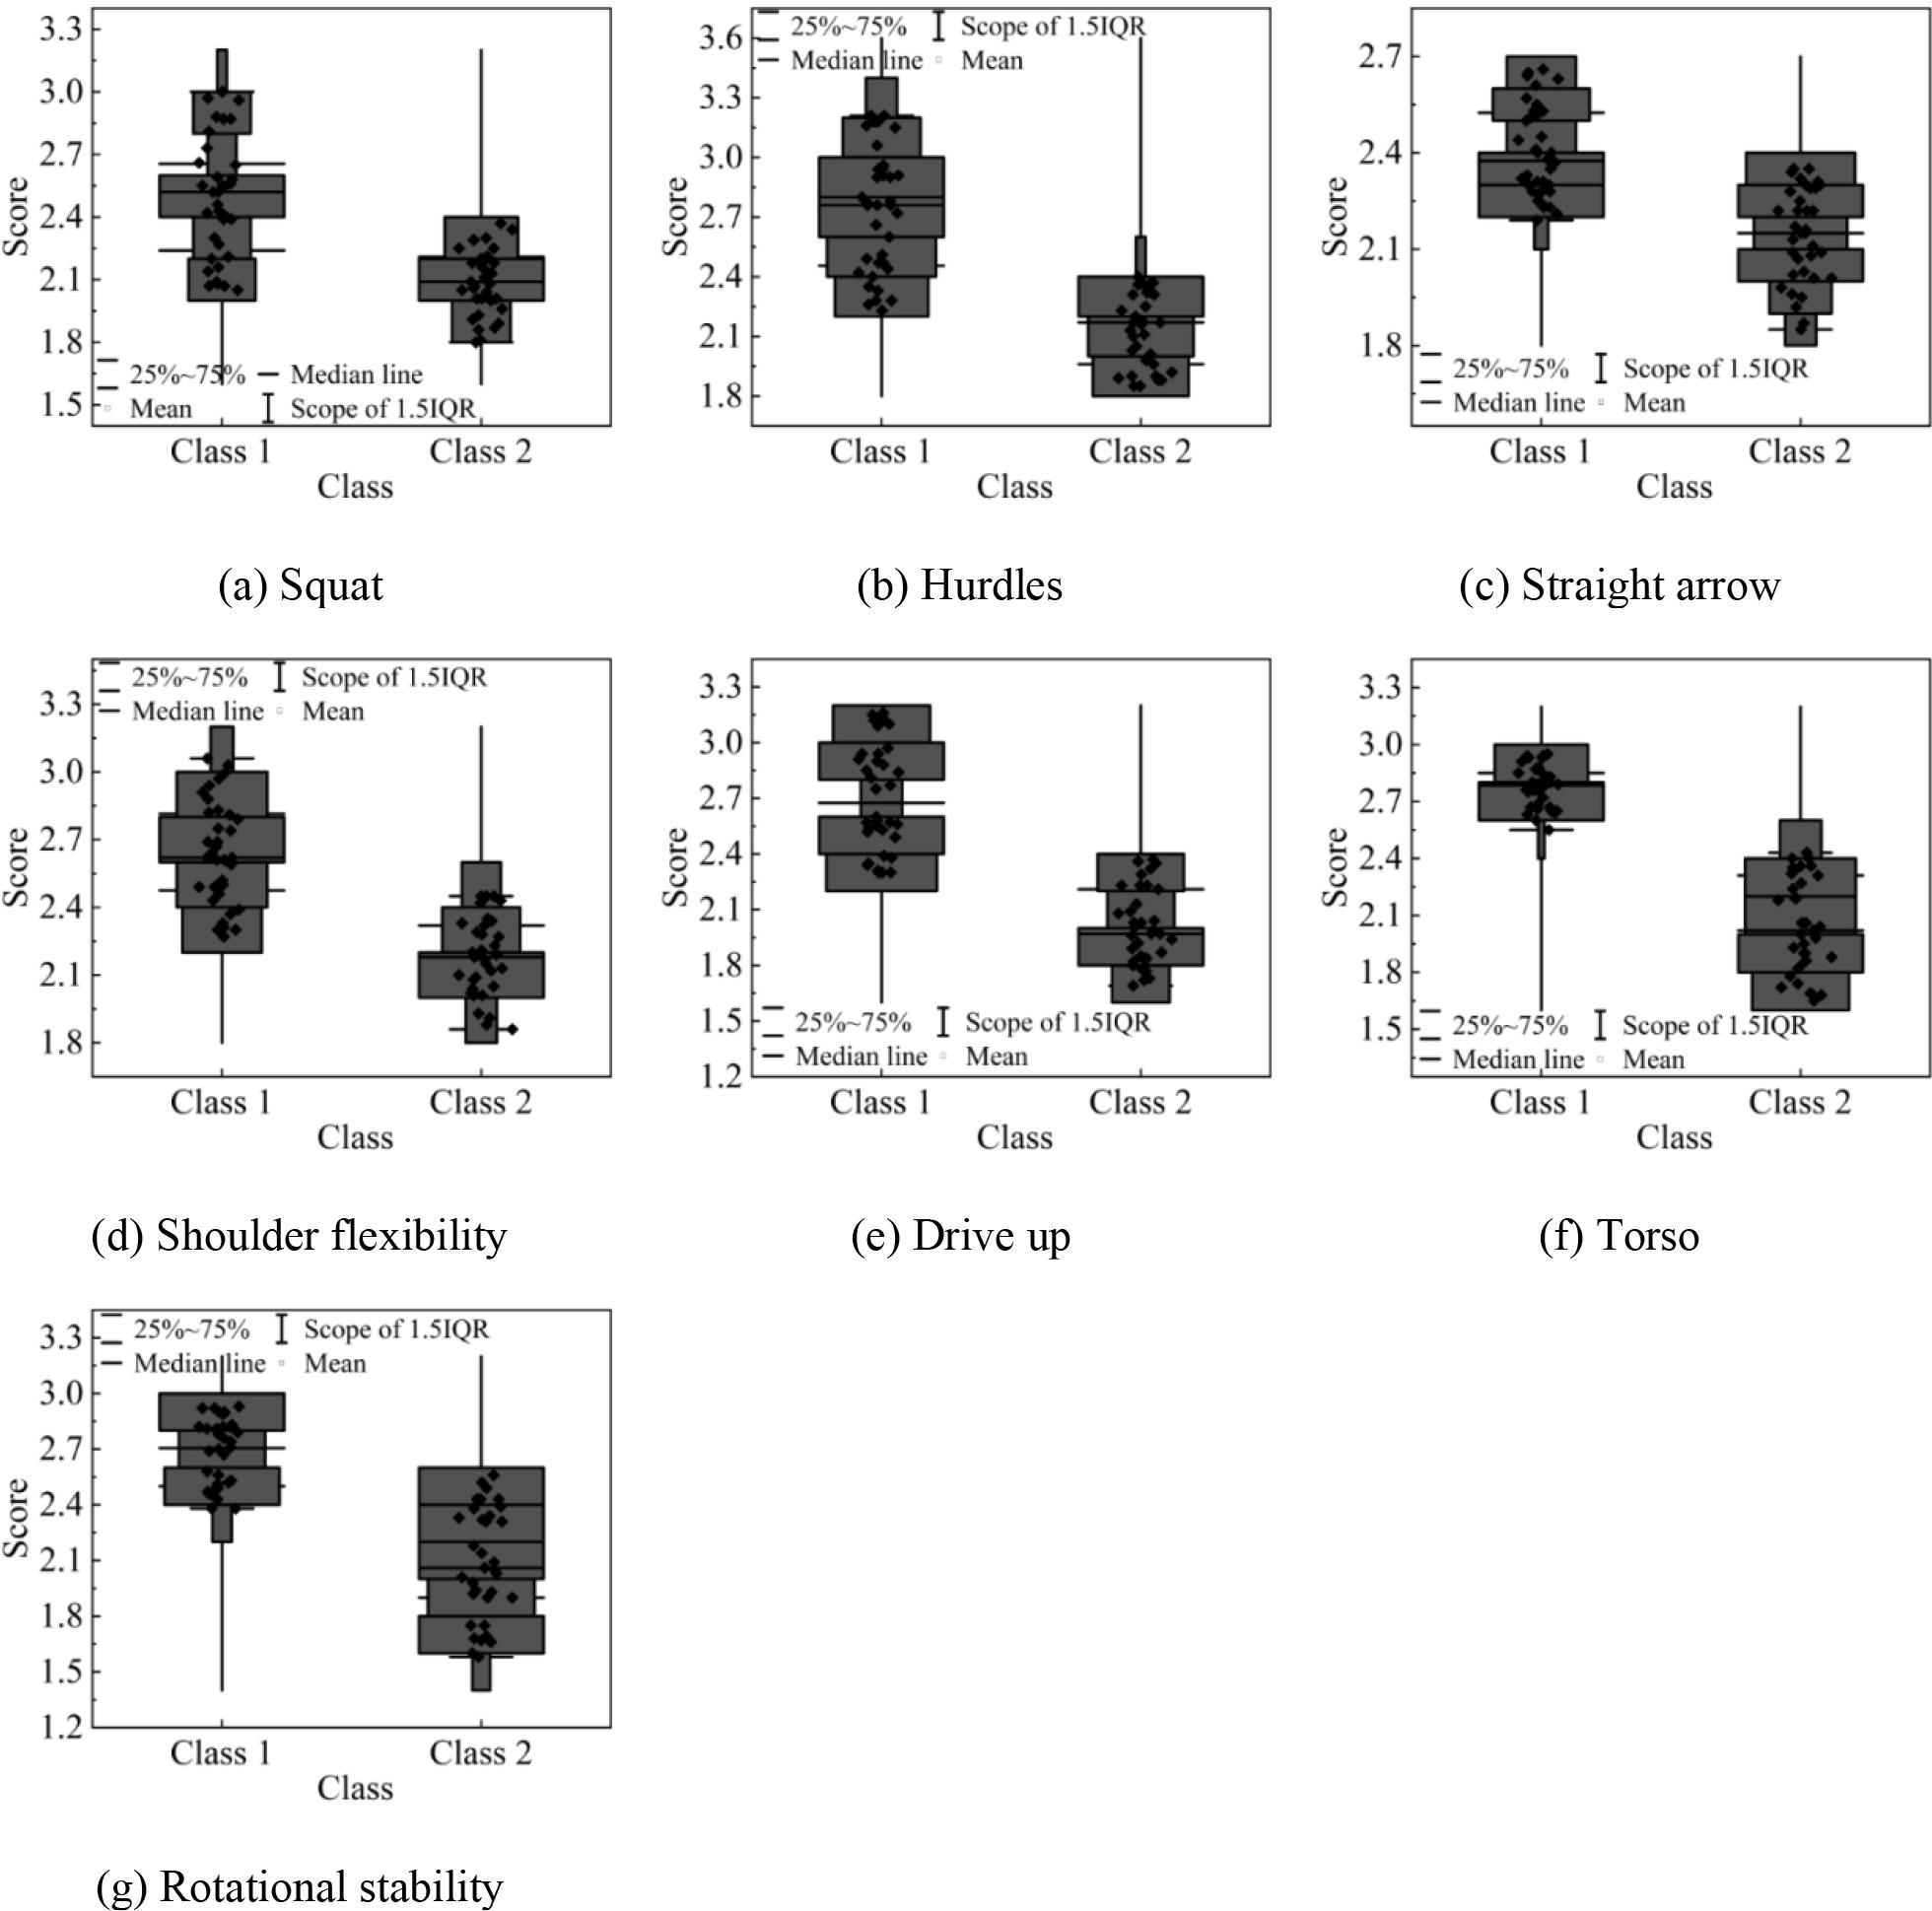
FMS comparison analysis results
| Index | Average score | Z | P | |
| Class 1 | Class 2 | |||
| Squat | 2.49 | 2.09 | -1.708 | 0.013 |
| Hurdles | 2.73 | 2.14 | -4.604 | 0.037 |
| Straight arrow | 2.40 | 2.14 | -1.532 | 0.006 |
| Shoulder flexibility | 2.64 | 2.18 | -3.768 | 0.022 |
| Drive up | 2.71 | 2.00 | -1.039 | 0.012 |
| Torso | 2.77 | 2.04 | -1.951 | 0.026 |
| Rotational stability | 2.68 | 2.09 | -4.678 | 0.034 |
Changes in the quality of the body
| Physical quality project | Gender | Class 1 | Class 2 | T | P | Increase | Rate of increase |
| Lung capacity (mL) | Male | 2348±336 | 2215±459 | -5.109 | 0.031 | 133 | 6.00% |
| Female | 2016±495 | 1987±523 | -5.797 | 0.04 | 29 | 1.46% | |
| 50m run (s) | Male | 7.26±1.23 | 8.42±2.22 | -2.624 | 0.044 | -1.16 | 13.78% |
| Female | 8.53±1.36 | 9.26±2.41 | -4.633 | 0.042 | -0.73 | 7.88% | |
| Predisposition (cm) | Male | 4.97±0.36 | 3.85±1.94 | -2.667 | 0.067 | 1.12 | 29.09% |
| Female | 10.23±1.42 | 9.86±1.63 | -1.29 | 0.053 | 0.37 | 3.75% | |
| Jumping rope in 1 minute | Male | 152.62±21.63 | 133.48±19.61 | -5.652 | 0.032 | 19.14 | 14.34% |
| Female | 126.63±19.63 | 120.34±21.12 | -5.443 | 0.001 | 6.29 | 5.23% | |
| Sit-ups | Male | 41.26±2.36 | 35.62±3.54 | -4.728 | 0.025 | 5.64 | 15.83% |
| Female | 30.26±5.24 | 27.48±2.63 | -3.745 | 0.034 | 2.78 | 10.12% | |
| 50×8 return run (min) | Male | 1.32±0.12 | 1.52±0.49 | -3.279 | 0.039 | -0.2 | 13.16% |
| Female | 1.69±0.42 | 1.72±0.36 | -5.505 | 0.016 | -0.03 | 1.74% |
Comparison analysis of the quality of the experimental predecessor
| Physical quality project | Gender | Class 1 | Class 2 | T | P |
| Lung capacity (mL) | Male | 2213±426 | 2193±542 | -0.584 | 0.920 |
| Female | 1842±632 | 1895±558 | -0.061 | 0.786 | |
| 50m run (s) | Male | 8.96±1.26 | 9.03±1.11 | 0.113 | 0.090 |
| Female | 10.06±2.42 | 9.98±1.87 | -0.703 | 0.749 | |
| Predisposition (cm) | Male | 3.26±4.82 | 3.59±5.26 | -1.021 | 0.805 |
| Female | 8.97±5.24 | 9.32±4.26 | -0.186 | 0.304 | |
| Jumping rope in 1 minute | Male | 129.26±32.61 | 128.42±35.62 | -0.681 | 0.171 |
| Female | 114.52±26.35 | 118.26±28.94 | -0.244 | 0.873 | |
| Sit-ups | Male | 31.24±8.96 | 32.42±7.95 | -0.12 | 0.727 |
| Female | 25.48±9.62 | 24.72±10.26 | -0.752 | 0.854 | |
| 50×8 return run (min) | Male | 1.66±0.52 | 1.69±0.84 | -0.2 | 0.647 |
| Female | 1.82±0.62 | 1.78±0.72 | -0.375 | 0.437 |
Student height and weight analysis
| Index | Class 1 | Class 2 | T | P | |
| Male | Height (cm) | 175.26±5.92 | 175.94±8.98 | -2.635 | 0.342 |
| Weight (Kg) | 70.42±2.65 | 71.44±3.26 | -0.785 | 0.662 | |
| Female | Height (cm) | 164.26±5.94 | 165.32±4.48 | -0.118 | 0.894 |
| Weight (Kg) | 60.25±4.48 | 62.38±5.29 | -1.694 | 0.228 | |