Design and Application of English Language and Literature Smart Classroom Based on Artificial Intelligence Technology
03 feb 2025

Acerca de este artículo
Publicado en línea: 03 feb 2025
Recibido: 21 sept 2024
Aceptado: 07 ene 2025
DOI: https://doi.org/10.2478/amns-2025-0007
Palabras clave
© 2025 Zhi Zhang, published by Sciendo
This work is licensed under the Creative Commons Attribution 4.0 International License.
Figure 1.
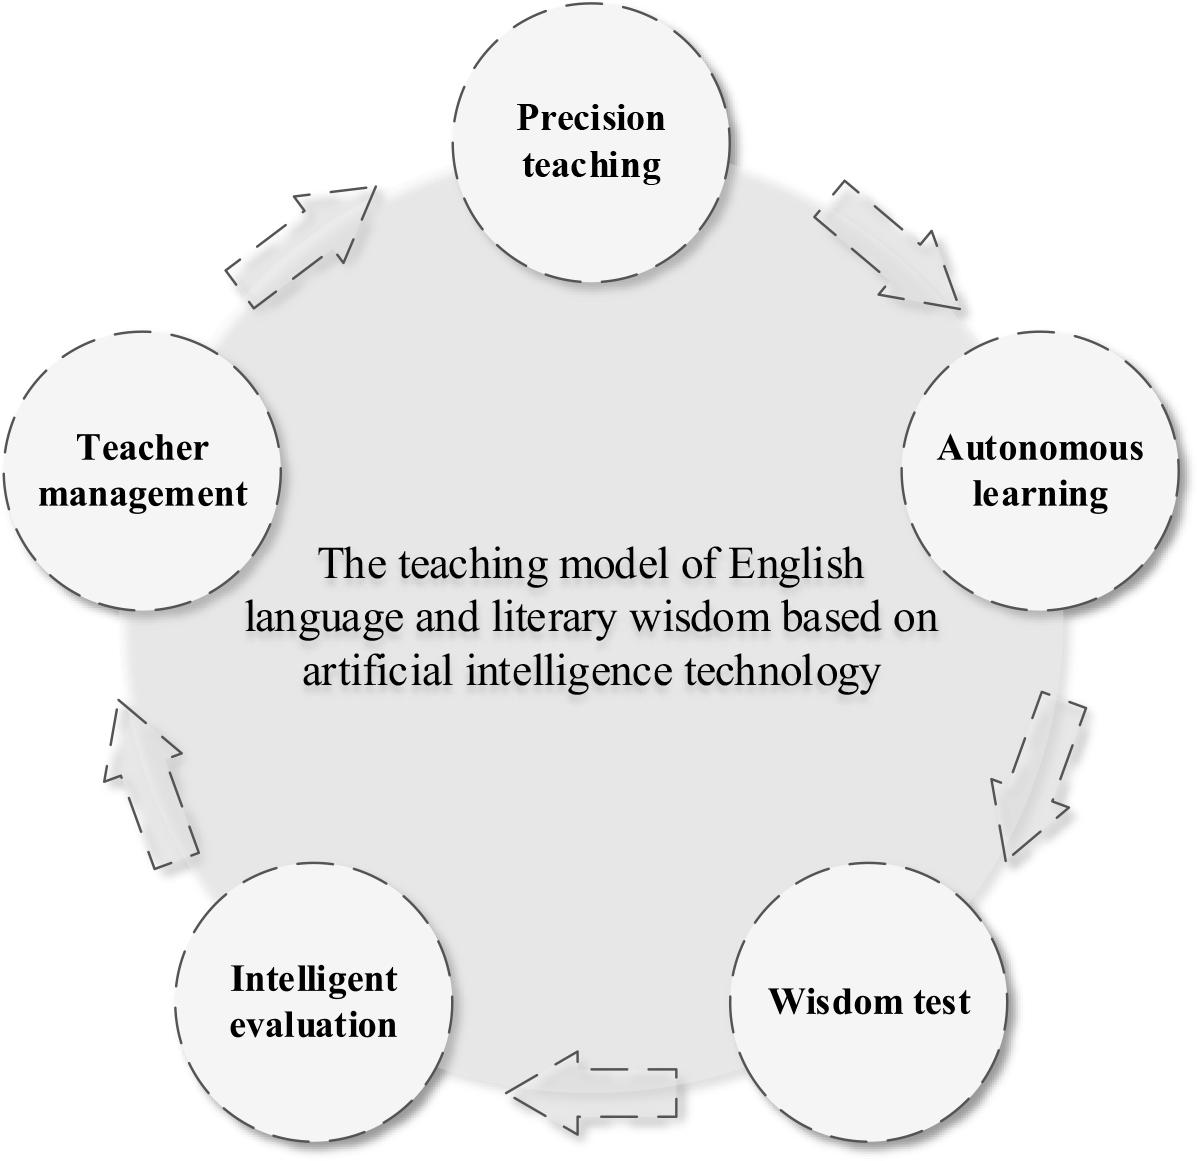
Figure 2.
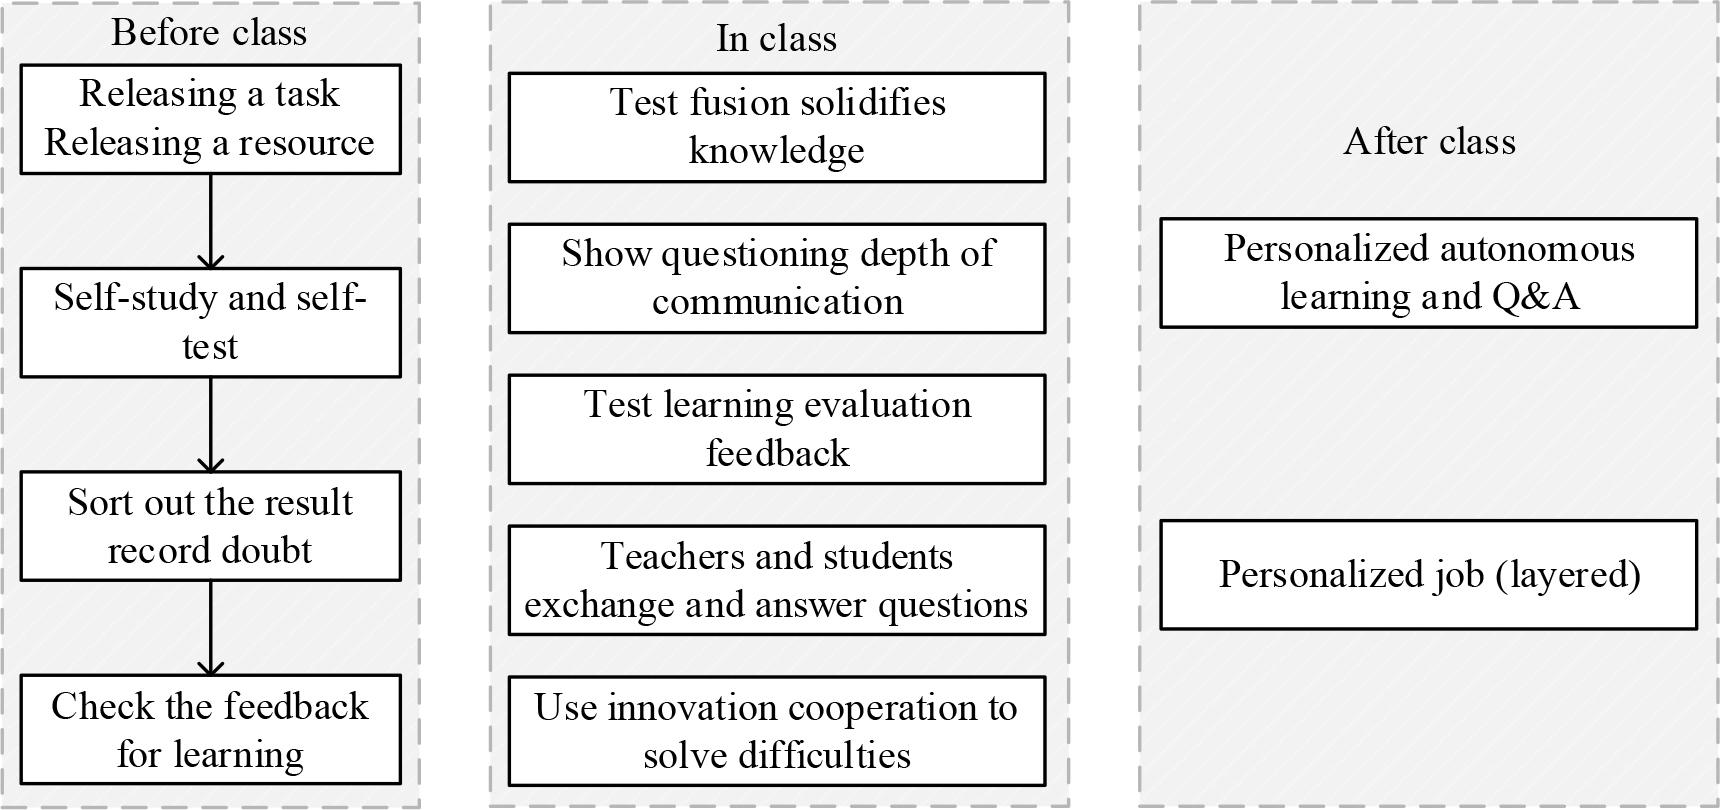
Figure 3.
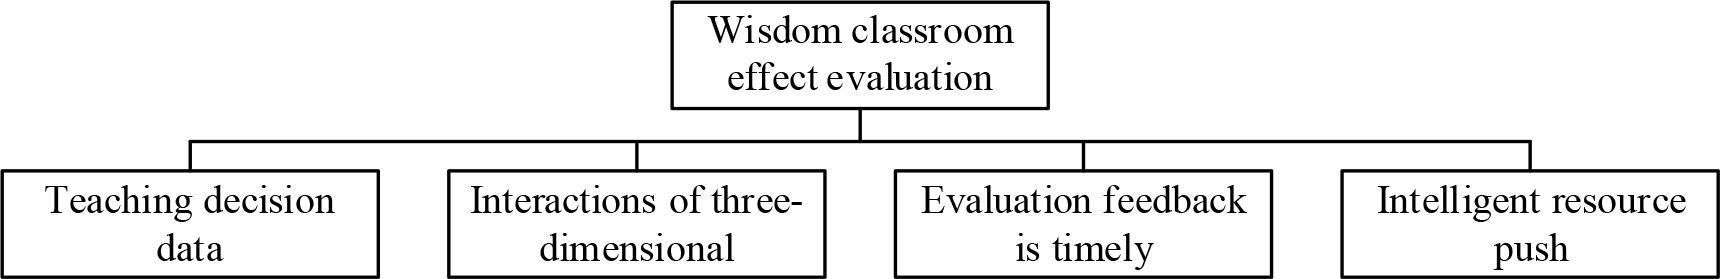
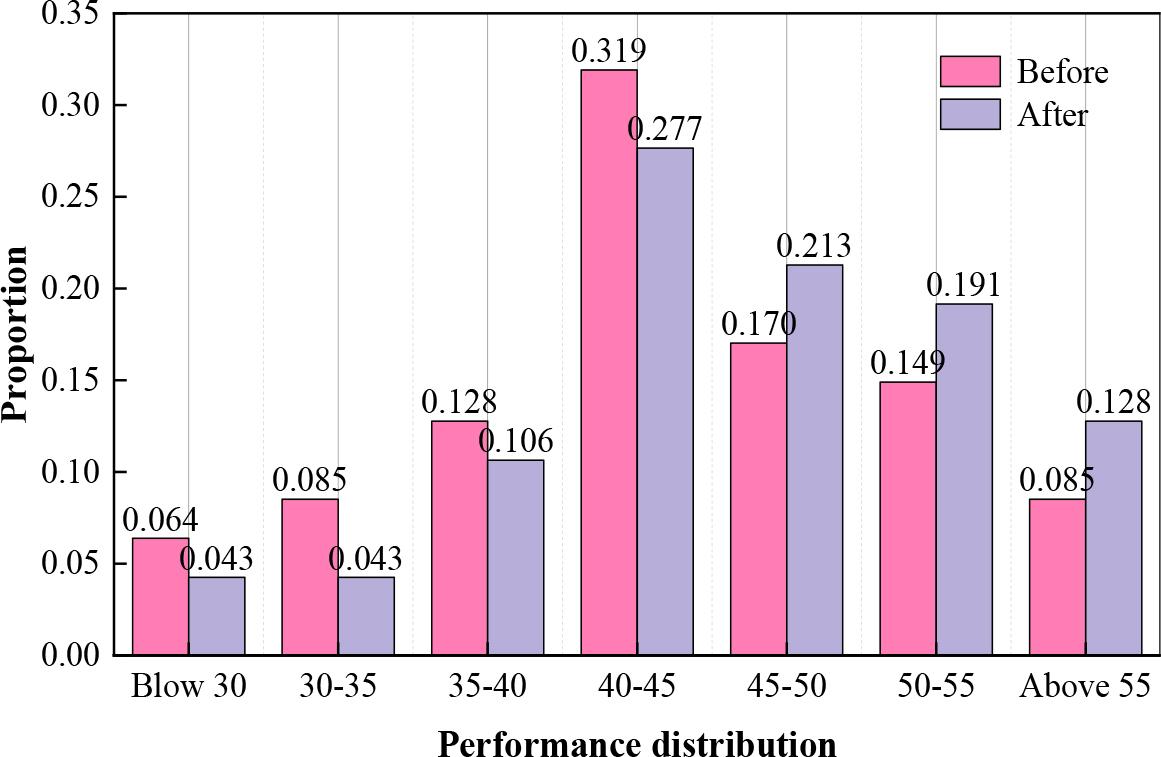
Figure 4.
Test results of the English language literature before experiment
| Class | N | Mean | S.D. | S.E. | |
|---|---|---|---|---|---|
| Grade | Class 1 | 47 | 42.56 | 5.712 | 1.052 |
| Class 2 | 48 | 43.07 | 5.324 | 1.127 | |
| Independent sample t test differences | |||||
| The variance of the Levene test | T test of the mean equation | ||||
| F | Sig. | T | df | Sig. (Double tail) | |
| Equal variance | 1.037 | 0.286 | -0.068 | 94 | 0.853 |
| Unequal variance | -0.068 | 93.286 | 0.853 | ||
The comparison results of the model on QWK in different text characteristics
| Prompts | LSTMsem | LSTMisem+simple | LSTMsem+synt | LSTMsem+topic | LSTMAll |
|---|---|---|---|---|---|
| 1 | 0.838 | 0.884 | 0.871 | 0.849 | 0.859 |
| 2 | 0.794 | 0.865 | 0.843 | 0.802 | 0.807 |
| 3 | 0.728 | 0.815 | 0.742 | 0.758 | 0.762 |
| 4 | 0.743 | 0.835 | 0.752 | 0.787 | 0.827 |
| 5 | 0.755 | 0.823 | 0.762 | 0.784 | 0.808 |
| 6 | 0.771 | 0.833 | 0.786 | 0.795 | 0.824 |
| 7 | 0.788 | 0.835 | 0.795 | 0.801 | 0.815 |
| 8 | 0.673 | 0.793 | 0.696 | 0.775 | 0.781 |
| Average | 0.761 | 0.835 | 0.781 | 0.794 | 0.810 |
Test results of the English language literature after experiment
| Class | N | Mean | S.D. | S.E. | |||
|---|---|---|---|---|---|---|---|
| Grade | Class 1 | 47 | 45.82 | 3.862 | 0.725 | ||
| Class 2 | 48 | 43.54 | 5.238 | 1.153 | |||
| Correlation analysis of class 1 | |||||||
| Mean | N | S.D. | S.E. | Correlation | Sig. | ||
| Class 1 | Before | 42.56 | 47 | 5.712 | 1.052 | 0.528 | 0.001 |
| After | 45.82 | 48 | 3.862 | 0.725 | |||
| Independent sample t test of class 1 | |||||||
| F | Mean | S.D. | S.E. | T | df | Sig. (Double tail) | |
| Class 1 | Before-after | -3.260 | 5.315 | 1.032 | -2.175 | 46 | 0.022 |
Different models of the QWK evaluation index
| Prompts | LSTM-MoT | CNN-CNN-MoT | CNN-LSTM-ATT | Improved LSTM |
|---|---|---|---|---|
| 1 | 0.816 | 0.804 | 0.823 | 0.859 |
| 2 | 0.747 | 0.738 | 0.799 | 0.807 |
| 3 | 0.672 | 0.683 | 0.693 | 0.762 |
| 4 | 0.744 | 0.773 | 0.805 | 0.827 |
| 5 | 0.729 | 0.712 | 0.793 | 0.808 |
| 6 | 0.815 | 0.811 | 0.815 | 0.824 |
| 7 | 0.734 | 0.787 | 0.802 | 0.815 |
| 8 | 0.647 | 0.739 | 0.747 | 0.781 |
| Average | 0.738 | 0.756 | 0.785 | 0.810 |
Statistical analysis of various results
| Type | N | Mean | S.D. | S.E. | Sig. (Double tail) | |
|---|---|---|---|---|---|---|
| Inductive keynote | After | 47 | 9.742 | 3.084 | 0.534 | 0.002 |
| Before | 47 | 7.869 | 1.094 | 0.233 | ||
| Guessing meaning | After | 47 | 7.512 | 3.237 | 0.487 | 0.006 |
| Before | 47 | 6.506 | 2.562 | 0.319 | ||
| Look for details | After | 47 | 18.791 | 2.863 | 0.381 | 0.073 |
| Before | 47 | 18.587 | 1.273 | 0.206 | ||
| Reasoning | After | 47 | 9.776 | 2.385 | 0.283 | 0.081 |
| Before | 47 | 9.601 | 1.459 | 0.141 | ||