Research on the Application of Machine Learning for Marxist Education Integrating Chinese Excellent Traditional Culture
03 feb 2025

Acerca de este artículo
Publicado en línea: 03 feb 2025
Recibido: 13 sept 2024
Aceptado: 28 dic 2024
DOI: https://doi.org/10.2478/amns-2025-0006
Palabras clave
© 2025 Handong Wang, published by Sciendo
This work is licensed under the Creative Commons Attribution 4.0 International License.
Figure 1.
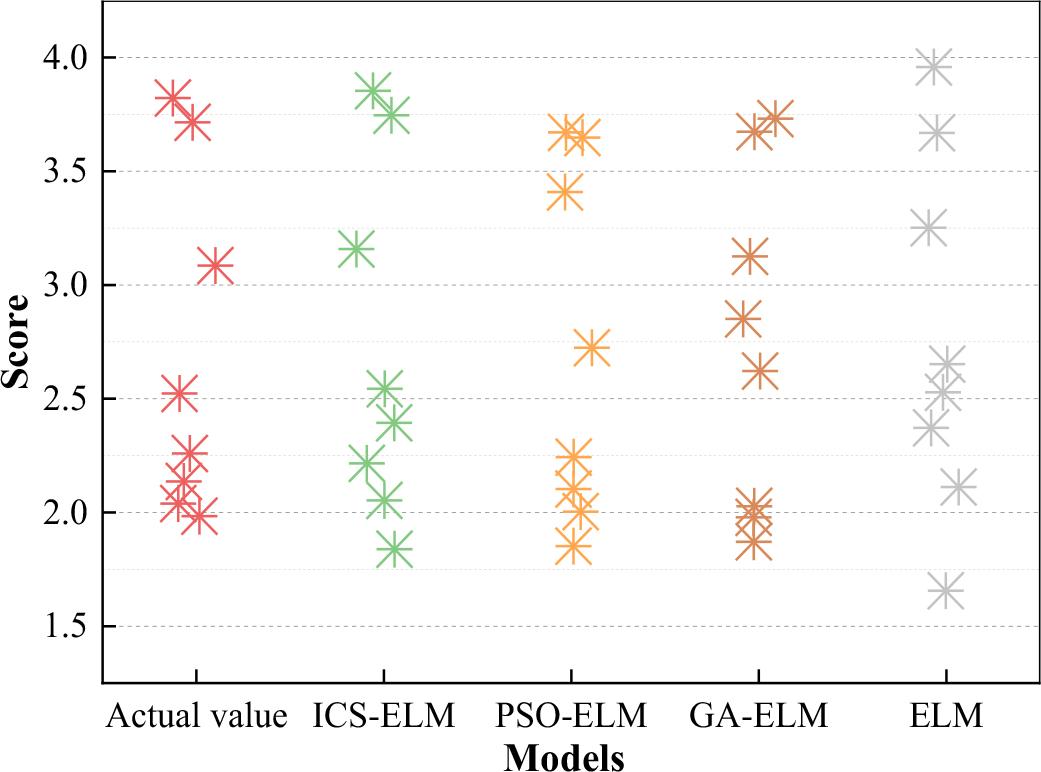
Figure 2.
Each evaluation index score and final score
| Index | 2016 | 2017 | 2018 | 2019 | 2020 | 2021 | 2022 | 2023 |
|---|---|---|---|---|---|---|---|---|
| A | 2.265 | 4.796 | 3.964 | 1.182 | 4.728 | 1.167 | 2.588 | 1.206 |
| B | 4.282 | 2.276 | 2.659 | 1.86 | 4.196 | 2.065 | 4.131 | 2.453 |
| C | 1.819 | 2.685 | 2.373 | 3.825 | 3.656 | 1.574 | 2.348 | 2.047 |
| D | 3.215 | 1.679 | 1.028 | 4.162 | 2.537 | 0.868 | 4.260 | 1.488 |
| E | 1.432 | 0.949 | 1.495 | 4.532 | 2.615 | 3.632 | 4.198 | 3.105 |
| Total | 2.544 | 2.394 | 2.216 | 3.158 | 3.746 | 1.839 | 3.854 | 2.053 |
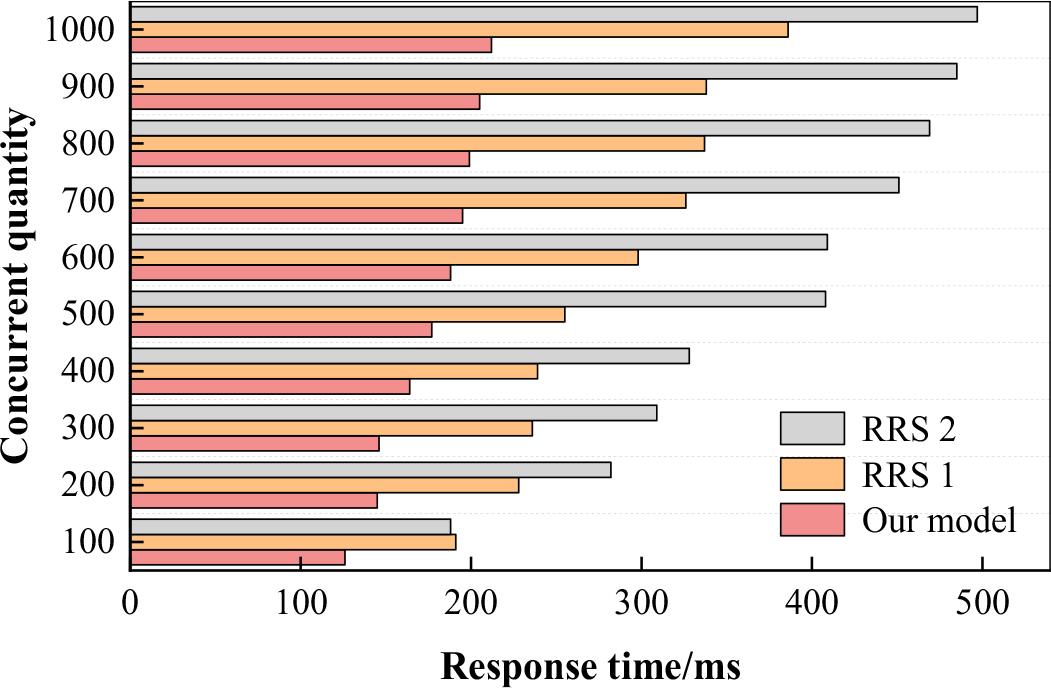
The MAE and RMSE results of resource recommendation results
| Group | Our model | RRS 1 | RRS 2 | |||
|---|---|---|---|---|---|---|
| MAE | RMSE | MAE | RMSE | MAE | RMSE | |
| 1 | 0.558 | 0.803 | 0.789 | 0.870 | 0.929 | 0.956 |
| 2 | 0.561 | 0.779 | 0.848 | 0.906 | 0.845 | 1.008 |
| 3 | 0.627 | 0.819 | 0.799 | 0.837 | 0.867 | 1.015 |
| 4 | 0.616 | 0.808 | 0.761 | 0.879 | 0.901 | 1.021 |
| 5 | 0.665 | 0.823 | 0.788 | 0.909 | 0.868 | 1.018 |
| 6 | 0.586 | 0.791 | 0.757 | 0.894 | 0.824 | 0.911 |
| 7 | 0.677 | 0.751 | 0.795 | 0.975 | 0.918 | 1.043 |
| 8 | 0.634 | 0.787 | 0.785 | 0.864 | 0.823 | 0.977 |
| 9 | 0.652 | 0.758 | 0.818 | 0.916 | 0.906 | 1.001 |
| 10 | 0.624 | 0.769 | 0.792 | 0.942 | 0.882 | 0.992 |
The comparison of the results of the evaluation results of Marxist teaching effect
| Methods | Training set | Test set | ||
|---|---|---|---|---|
| ICS-ELM | 0.007 | 0.964 | 0.036 | 0.984 |
| PSO-ELM | 0.018 | 0.955 | 0.040 | 0.965 |
| GA-ELM | 0.015 | 0.947 | 0.045 | 0.937 |
| ELM | 0.019 | 0.932 | 0.055 | 0.926 |
Comparison of the effect of teaching resource recommendation model
| Item | Before applying | After applying | t value | P value |
|---|---|---|---|---|
| Degree of understanding | 2.22±0.35 | 2.69±0.36 | -9.554 | 0.003 |
| Cognition of teaching resources | 2.56±0.52 | 2.62±0.53 | -3.615 | 0.001 |
| Model characteristics | 3.14±0.38 | 3.57±0.36 | 3.566 | 0.008 |
| Attention concentration | 3.24±0.52 | 3.65±0.53 | 1.628 | 0.058 |
| Study interest | 2.56±0.61 | 2.77±0.63 | 2.591 | 0.004 |