Research on the path and optimisation of sustainable regional economic development based on big data analysis

Online veröffentlicht: 17. März 2025
Eingereicht: 30. Okt. 2024
Akzeptiert: 17. Feb. 2025
DOI: https://doi.org/10.2478/amns-2025-0160
Schlüsselwörter
© 2025 Jieni Ma, published by Sciendo
This work is licensed under the Creative Commons Attribution 4.0 International License.
In recent years, with the rapid development of information technology and the increasingly wide application of big data, the analysis of regional economic development trends based on big data has become a popular field. The use of big data to analyze regional economic development trends can not only provide strong support for government decision-making but also help enterprises seize opportunities and optimize resource allocation [1-4].
A good regional economic development path should be closely related to various ecological protection strategies, production methods and social enjoyment. It is necessary to rationally combine regional economy and sustainable development by integrating social and environmental resources to promote the sustainable development of the city and to guarantee the safe, stable and sustainable development of the regional environment and people [5-8]. The path optimization of sustainable regional economic development includes the path optimization of the sustainable economic development of each region in the region and the path optimization of the sustainable development of the entire regional economy. The optimization of the path of sustainable development of the regional economy is scientific planning for the economic development process of the region, and its goal is to pursue the maximum speed of economic development in the region under the premise of sustainable development [9-12], that is, under the premise of ensuring “intergenerational equity”. The optimization of the sustainable development path of the regional economy refers to scientific planning of the economic development model of each region in a specific region (composed of many regions), which pursues the goal of maximizing regional economic benefits but must ensure that the difference in the economic development level or development speed of each region in the region does not exceed the limit of “intra-generational equity” [13-16].
Literature [17] takes 17 prefectural-level cities in Shandong Province as the research object, selects indicators through correlation analysis and discriminant analysis, and creates an indicator system and evaluation model including four subsystems of economy, society, resources and environment. For the scores of the subsystems, a back propagation neural network was used to carry out the evaluation, and the comprehensive scores of the regional sustainable development of the 17 prefectural-level cities were evaluated in the hierarchical analysis method based on entropy modification, and the results showed that the level of sustainable development in Shandong Province was uneven as a whole, and the new indicator selection and comprehensive evaluation method provided a new vision for the evaluation of regional sustainable development. Literature [18] aims to discuss the role of big data in supporting regional sustainable development by analyzing relevant information to emphasize the role of big data and provide information integrity of authoritative institutions and comparative analysis of regions to understand their strengths and weaknesses, the results of the study provide valuable information for regional sustainable development, which is of great significance. Literature [19] introduces an intelligent decision support system for enterprise sustainability based on big data, which can be used in planning, collaboration and management of enterprises and governments, and introduces an extension of Kuhn-Tucker’s method in order to use it as an algorithm for adapting the system. Literature [20] conducted a study with the help of content research and data systematization methods with the aim of examining the factors and reserves of regional sustainable development by defining groups of conditions affecting the dynamics of the region, introducing information and analytical support mechanisms for the evaluation of sustainable development of the region, and developing a matrix of indicators and composite indicators to reflect the characteristics of sustainable development of the region. The results of the research emphasize the boundaries of strategic goals and directions of sustainable development of the region. Taking Sichuan as an example, [21] divided Sichuan Province into DPZ, EBZ, ECZ and CDZ based on the median values of the ecological quality index and economic growth index of each unit, and studied the coupling and coordination degree of each unit, and came to the conclusion that the distribution of Sichuan’s regional economic development level and ecological quality is not balanced, which is of certain reference value for the formulation of regional sustainable development strategies.
This paper first elaborates on the theory of regional economy and sustainable development and then completes the construction of the evaluation index system of regional economic sustainable development level based on the four principles in the construction of the evaluation index system, which consists of 11 indicators. The 11 evaluation indexes are converted into a spatial weight matrix, and the economic spatial distribution characteristics of the study area are explored qualitatively with the help of the Moran index and the differences in the spatial characteristics of the regional economy are shown in the form of the Moran scatterplot. In order to realize quantitative research on regional economic development, a panel data model is constructed, combining the research data and the panel data model to jointly explore the sustainable development level of the regional economy. Ultimately, targeted optimization recommendations are proposed based on the results of the analysis, with the aim of promoting the sustainable development of the regional economy.
The regional economy is usually defined as the sum of economic factors in all areas of a county, measured in terms of provinces, and falls under the category of regional economy. It is an economic system in which economic activities are carried out mainly within the provincial boundaries, marked by one level of finance, with the links and relationships between economic factors at all levels in towns and villages as the basic structure, and which functions as a whole through the role of various types of “streams” within the county. The regional economy plays a pivotal role in the national economic system, is an important foundation for the country’s economic development and social stability, and is also an important vehicle for meeting the people’s aspirations for a better life, playing an enormous role.
Regionality
The regional economy is a regional category corresponding to its administrative boundaries, with a specific and clear geographic space, with obvious natural, geographic, historical, and social regional characteristics. In the provincial area, all kinds of transportation routes form a network running through the center of provincial capitals, linking cities, counties, townships and villages, realizing the connectivity of economic elements in the provincial area, thus forming a regional economy centered on provincial capitals, with cities, counties, townships and villages as the links, and with rural areas as the hinterland, and it is the entry point for solving the “Three Rural Issues” and the “spearhead” for the establishment of a moderately well-off society in all aspects. “front-runner”, has a typical regional.
Comprehensive
Provincial areas are “small sparrows, all the organs are complete.” in this condition, the provincial economy is also a fully functional economic unit, a relatively complete economic operation system that, in a way, can also be regarded as a microcosm of the national economy, is the country’s economic operation of the barometer and thus since ancient times, the county rule, the world peace. Provincial economies have regional links between towns and villages, which facilitates good interaction between urban and rural areas. In terms of management organizations, there are various economic management departments, such as development, finance, taxation, finance, price and business administration, etc., to ensure the good operation of the economy in all aspects of production, circulation, trading and consumption. Under the coordination and management of various departments, it is continuously developing.
Openness
The regional economy is an open system that is constantly engaged in various types of linkages with other neighboring regions, such as material, energy and information flows, which make the economies of other regions more or less influenced by each other. Therefore, to a certain extent, the development of regional economy does not only rely on its initial conditions but also breaks through the constraints of natural conditions, geographic transportation, ethnic relations, etc., and shows significant spatial correlation with the neighboring economies, so as to realize the optimal allocation of resources in a wider space and form a network of various types of “flows”, and obtain the full development of the regional economy. Full economic development.
Hierarchy
Provincial economy is a general term for all economies within a provincial area, which not only reflects the sum of all types of industries but also the structure of the industries and the relationship between the various economic systems. Geographically, it is a combination of urban and rural economies. In addition, in terms of economic subjects, there is both the economy of the people, their employment and income, as well as government revenues and expenditures, and the economy of enterprises, i.e., revenues and expenditures in various segments. From these perspectives, the provincial economy has a clear hierarchy.
Independence
A provincial area is an administrative region with relative independence, and serves as the basic unit of the national economy. The provincial economy also has a relatively independent right to financial evidence but also has a certain degree of autonomy in decision-making, which can be based on the general environment and the general context of the development strategy and development direction, combined with their characteristics, independent and autonomous development of the region’s development plans and planning to promote the development of the county economy. Therefore, the county economy has a certain degree of independence and, at the same time a certain degree of dynamism, and is the vanguard of the country’s strategy of accelerating the development of urbanization and the revitalization of the countryside.
Since the regional economy is influenced and constrained by a variety of complex factors, such as natural conditions, markets, and location, there are many types of county economies and different development patterns.According to different division standards and principles, the types they are divided into are also varied. Figure 1 shows an example of the types of regional economy, and the basis for the division of regional economic types, according to the purpose of the study, is mainly explored from the basis of the division of the two aspects of the dominant industry and location. Based on the type of dominant industry, it can be mainly divided into an agriculture-dominated economy, industry-dominated economy, service industry-dominated economy, and comprehensive development economy.According to the advantages and disadvantages of location, regional economic types can be divided into two types: location superiority type and location disadvantage type.
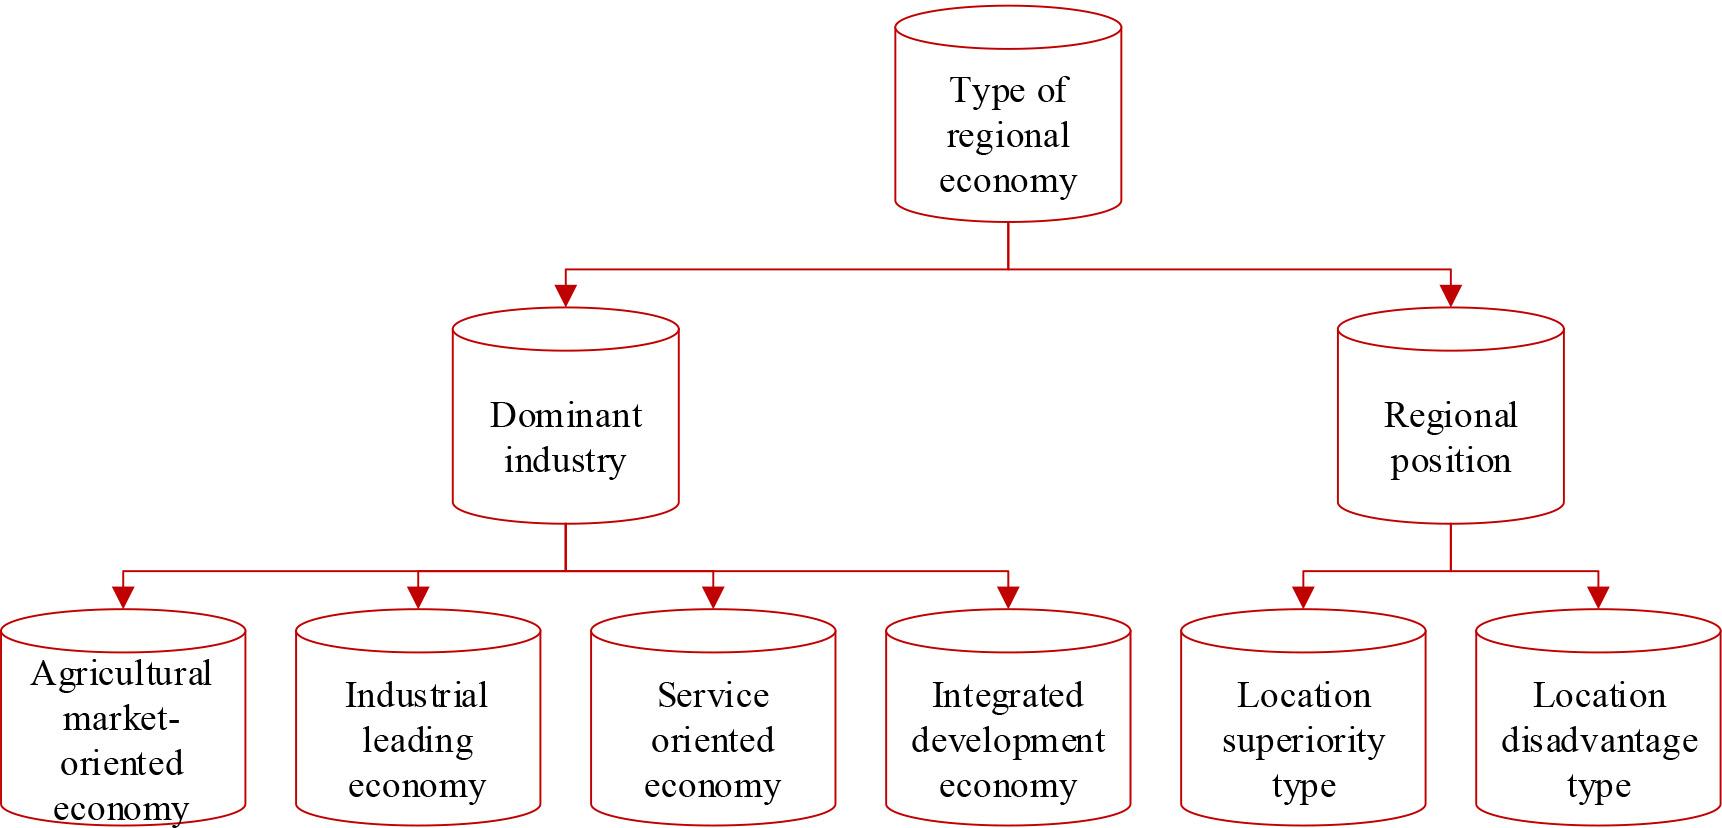
Examples of the type of regional economy
Sustainable development is “development that meets the needs of the present without jeopardizing the ability of future generations to meet their own needs”. This definition expresses two ideas: first, that human beings need to develop, especially people with low incomes. The second thing is that development should be limited and not jeopardize the development of future generations.Sustainable development is rich in connotations, mainly emphasizing common, coordinated, equitable, efficient, and multifaceted global development. At the same time, sustainable development should also be based on the characteristics of the respective regions, countries and societies, and in the context of their special social, cultural, historical and economic backgrounds, create their own national and regional development models, start from their standpoints, formulate a sustainable development plan that meets their characteristics, and take a path of sustainable development that meets their conditions.
Improvement of population, resources and environment. Population pressure is the root cause of sustainable development problems. As a special form of resource, population and sustainable development form a relationship of promotion and constraint. Excessive population growth inevitably leads to excessive demand for resources and serious damage to the ecological environment, resulting in non-sustainable economic and social development. Through population control, the balanced production of the population in line with the economy, society, and ecological environment is a decisive factor in achieving sustainable development.
Developing a circular economy. It is to maximize the efficiency of resource utilization and minimize waste emissions in accordance with the laws of material circulation and energy conversion in natural ecosystems and to harmoniously integrate the economic system into the material and energy circulation process of natural ecosystems so as to achieve coordinated development of the economy.
Developing science, technology and culture and strengthening institutions. Along with economic and social development, technological progress can replace or reduce the depletion of resources and protect the environment, as well as promote economic growth and alleviate the pressure of population growth, but the discovery and application of new technology may also create new unsustainable development problems. Therefore, we need to study technological progress in conjunction with sustainable development so that it can promote the sustainable development of society as a whole.
Give full play to the linkage among the market, the government and non-governmental organizations. The implementation of sustainable development requires not only the guidance of the government as well as the guidance and supervision of policies and laws but also the participation and support of a large number of non-governmental organizations and the public. Relying only on the market and the government cannot fundamentally solve the problem, and non-governmental organizations are playing an increasingly important role in the field of sustainable development.
The construction of a comprehensive evaluation index system for regional economic development is intended to quantitatively demonstrate the quality of regional economic development. In order to comprehensively, objectively and accurately reflect the actual level of the quality of regional economic development and the future development trend and to make the evaluation results have a certain degree of credibility, the construction of the evaluation index system for the quality of regional economic development should follow the following principles.
Scientific principle
The design of the evaluation index system must be based on science, minimize the interference of human factors, and select as many as possible indicators that can objectively and realistically reflect the quality of regional economic development so that the evaluation results have authority and credibility. This is mainly reflected in the following: first, the selected indicators must have a scientific theoretical basis. Second, the selected indicators should be as concise as possible to avoid redundancy of data. Thirdly, the selected indicators should be based on objective data and information as much as possible, with clear measurement standards.
Principle of operability
The design of the evaluation index system should be based on a more correct reflection of the situation of the quality of regional economic development and strive for the operability of the data, which mainly includes: firstly, the availability and reliability of the data and information, the data and information as far as possible through the consultation of the statistical yearbook and a variety of professional yearbooks (such as the statistical yearbook, the city statistical yearbook, the scientific and technological statistical yearbook, etc.), or on the basis of existing information through the simple processing and organizing of the data and information. Thirdly, the quantifiable operation of indicators.Thirdly, the quantitative operation of the indicators is mainly quantitative so as to avoid the application of too many subjective or empirical indicators and reduce the credibility of the evaluation results.
Principle of Simplicity
The selection of indicators is not the more the better, but should be based on the target level based on the guideline level to capture the key indicators.Firstly, the relevance between the selected indicators should be considered to avoid the repeated use of indicators with high relevance, which results in data redundancy.The second task is to identify the importance of the indicators and eliminate those with weak importance. Through the operation of these two steps, the evaluation index system finally obtained is concise and easy to operate.
Principle of dynamism
The quality of regional economic development is a dynamic accumulation process. The selected evaluation indicators should not only be able to reflect the current quality of regional economic development but also must be able to reflect the dynamic process of its development, reflecting the development of the quality of regional economic development trends and sustainability, so the evaluation indicators should take into account the combination of static and dynamic indicators.
There are single and composite indicators for measuring differences in regional economic development. The use of single statistical indicators for definition and evaluation is more convenient, intuitive, and simple, and their conclusions are highly comparable. For this reason, it has been frequently used in many studies to date. The regional economic development differences refer to the comprehensive effects shown by different regions in terms of economic level, speed, structure and efficiency, which are not fully reflected by GDP per capita. Based on this, this paper intends to reveal the spatial and temporal evolution characteristics of regional economic differences through the comprehensive measurement of regional economic development level value added (Q2), industrial value added (Q3), value added of the tertiary industry (Q4), the number of employees at the end of the year (Q5), the total retail sales of consumer goods (Q6), the amount of foreign investment actually utilized in the current year (Q7), the balance of urban and rural residents’ savings at the end of the year (Q8), the amount of investment in the fixed assets of society as a whole (Q9), the income of the local financial budget (Q10), the expenditure of the local financial budget (Q11) and so on. Expenditure (Q11), etc.
Regional economic sustainable development level evaluation index system
| Title | Evaluation index | Symbol |
| Regional economic sustainability | GDP | Q1 |
| The added value of the first production | Q2 | |
| Industrial added value | Q3 | |
| The added value of the third industry | Q4 | |
| The number of employees at the end of the year | Q5 | |
| Total retail sales of consumer goods | Q6 | |
| The actual use of foreign capital | Q7 | |
| The balance of the year-end balance of urban and rural residents | Q8 | |
| The whole club will invest in fixed assets | Q9 | |
| Local budget internal income | Q10 | |
| Expenditure within the general budget of local finances | Q11 |
Spatial autocorrelation is a prerequisite for spatial statistics, and conducting panel spatial econometric analysis starts with exploratory spatial data analysis to explore whether the basic prerequisite of spatial autocorrelation is satisfied. It mainly analyzes the spatial correlation of a phenomenon and makes judgments about the spatial dependence between regions and spatial heterogeneity.When exploratory spatial data analysis is carried out in the study, it is first necessary to establish a spatial weight matrix and then measure and test spatial autocorrelation.
The research content of spatial autocorrelation can be mainly divided into global autocorrelation analysis and local autocorrelation analysis. When we carry out global spatial autocorrelation analysis, we need to analyze the spatial correlation of the region from the whole and usually use the global Moran index to test the spatial correlation of the whole region. In contrast, when performing local spatial autocorrelation analysis, it is necessary to analyze the spatial correlation of the region from a local point of view, usually using the local Moran’s index to test whether there is a spatial correlation between neighboring regions.
The spatial measurement model is a special model which is mainly used to explore the spatial relationship between geo-economic units, which requires the spatial relationship of the real region to be converted into the data relationship in the form of data [22-23]. To carry out spatial correlation analysis, a spatial weight matrix should be constructed first. This subsection mainly uses the distance spatial weight matrix to define the evaluation index weight coefficients.This method utilizes the distance between regions to define the weight coefficients. The center distance of a region can measure the distance between regions. For example, in the distance between two neighboring cities, the defined weight coefficients are more objective because they represent the distance between the actual geographic locations.
Define the weighting coefficients:
Commonly used empirical functions are
Global autocorrelation analysis is mainly used to explore the spatial distribution characteristics of the study phenomenon in the whole study area and then analyze the degree of spatial correlation and the degree of spatial difference in the region as a whole [24]. The commonly used measure is the global Moran index, which can be expressed as:
When the Moran index takes the value of [–1, 1],
When testing for spatial autocorrelation, the original hypothesis of the test is given, which is that the spatial location shows a random distribution in the study area. In this paper, the
The local Moran index can measure the degree of local spatial correlation and the degree of spatial difference between each region and its neighboring regions, and it can also be used to visualize the spatial pattern of local differences in conjunction with Moran scatter plots or significance maps, etc., and to study its spatial distribution pattern.
Local Moran index
Although the global spatial autocorrelation analysis introduced above can study the overall spatial distribution, it cannot reflect the specific situation of the local spatial distribution, and at this time, it is necessary to introduce the local spatial autocorrelation analysis to make up for the defects of the global spatial autocorrelation analysis. The index used to measure the local spatial autocorrelation is the local Moran index, which the formula can express:
The positivity and negativity of the local Moran index
After calculating the localized Moran’s index, the resulting localized Moran’s index needs to be subjected to a Z-test, and the test statistic is given by:
Moran scatterplot
The Moran Scatterplot is a representation of the relationship between the variables
Quadrant (
Quadrant II (
Quadrant III (
Quadrant 4 (
The panel data model can also be called the cross-sectional time series model, which is a more specific type of systematic econometric model. On the one hand, it considers the relationship between cross sections. On the other hand, it also pays attention to the characteristics of the cross-section data over time, combining the characteristics of the ordinary regression model and time series model, which is the expansion and extension of the methodology of econometric modeling.
The panel data model is mainly used to study the internal structure and overall characteristics of similar individuals, and to cluster them together to explore their commonalities and individuality.In current research, panel data are more and more widely used, both for macroeconomic research and microeconomic research.
The standard form of a linear regression model is:
The general spatial linear model based on the analysis of the cross-sectional data is expressed as:
In the above equation
In addition,
Spatial autocorrelation analysis: conditions for establishing spatial econometric models
When conducting global autocorrelation analysis, if the global Moran index can pass the significance test, it can indicate that there is an obvious spatial correlation in the model, and at this time, it is feasible to choose the spatial econometric model as a research tool.
Unit root test
Considering the spatial and temporal characteristics of the panel data, before establishing the model, we should first determine the smoothness of the sequence, and we need to carry out the unit root test on the variables with the help of Eviews software and for the non-smooth variable sequences, we need to carry out the differential processing before carrying out the unit root test.
Test method: to determine the specific form of spatial panel modeling
In spatial econometrics, the LM test is mainly used to check which form of spatial autocorrelation dominates.
Hausmann test: selection of fixed and random effects
In the selection of fixed effects and random effects of the model, we can select the appropriate effect through the Hausman test. When the original hypothesis is rejected, the establishment of a fixed effects model should be chosen. On the contrary, when the original hypothesis can not be rejected, that is, the individual effect has nothing to do with the explanatory variables. At this time, we should choose the random effects model. The Hausman test’s original and alternative hypotheses can be summarized as follows:
The indicator system used in this paper contains 11 evaluation indicator systems, and the indicator data come directly from the 2012-2021 Economic Yearbook of a province compiled by a provincial statistical bureau and the 2012-2021 statistical yearbook of each city, and another part of the data is obtained by calculating and processing the original data.
The global autocorrelation value of a province’s regional economic sustainable development from 2012 to 2021 is calculated by GeoDa software and tested for significance, and the results of global autocorrelation analysis are shown in Table 2. According to the data in the table, it can be seen that when the significance level is 0.1, only the Moran’s I value in 2016 passes the significance test, and its Global Moran’s I value is 0.135, with a P-value of 0.032, which fully shows that there is a strong spatial positive autocorrelation of the economic development of the region of a certain province in 2016, indicating that the regions with a higher or lower per capita GDP tend to be neighboring. The Global Moran’s I values for 2012-2016 and 2017-2021 failed the test, indicating that the regional economic development of Hebei Province is a scattered and disorderly process and does not show significant spatial aggregation on the whole, and the economic development of each city is still uncoordinated and lacks the pulling power of the regional center.
Global self-correlation analysis
| Year | Moran′s I | E(I) | Mean | Sd | P value | Z(I) |
| 2012 | 0.141 | -0.001 | -0.094 | 0.223 | 0.164 | 1.044 |
| 2013 | -0.007 | -0.001 | -0.092 | 0.236 | 0.339 | 0.365 |
| 2014 | -0.053 | -0.001 | -0.085 | 0.229 | 0.402 | 0.158 |
| 2015 | -0.054 | -0.001 | -0.083 | 0.233 | 0.404 | 0.129 |
| 2016 | 0.135 | -0.001 | -0.09 | 0.229 | 0.032 | 0.348 |
| 2017 | -0.02 | -0.001 | -0.09 | 0.232 | 0.333 | 0.317 |
| 2018 | 0.13 | -0.001 | -0.093 | 0.235 | 0.175 | 0.938 |
| 2019 | 0.054 | -0.001 | -0.101 | 0.237 | 0.242 | 0.635 |
| 2020 | 0.145 | -0.001 | -0.106 | 0.239 | 0.156 | 1.053 |
| 2021 | 0.175 | -0.001 | -0.097 | 0.226 | 0.126 | 1.239 |
The dynamic trend of global autocorrelation is further analyzed based on the folded area-filled graph of the global Moran index for the level of sustainable development of the regional economy in a province from 2012 to 2021, and the global Moran index from 2012 to 2021 is shown in Figure 2. According to the analysis, the global spatial autocorrelation index is in a faster decline stage from 2012 to 2015, from 0.141 to -0.054, indicating that the economic links between the regions are more sparse between 2012 and 2015, and it is in an upward stage from 2015 to 2016, with the Moran index rising rapidly from -0.054 to 0.135, and an economic depression during the period 2016- 2017 period was again characterized by economic depression, reflected in the Moran index. During the period 2017-2021, the Moran index has remained greater than 0, despite economic instability.Overall, in recent years, regions have focused on their development but neglected interaction with neighboring regions, and economic ties between them have gradually weakened.
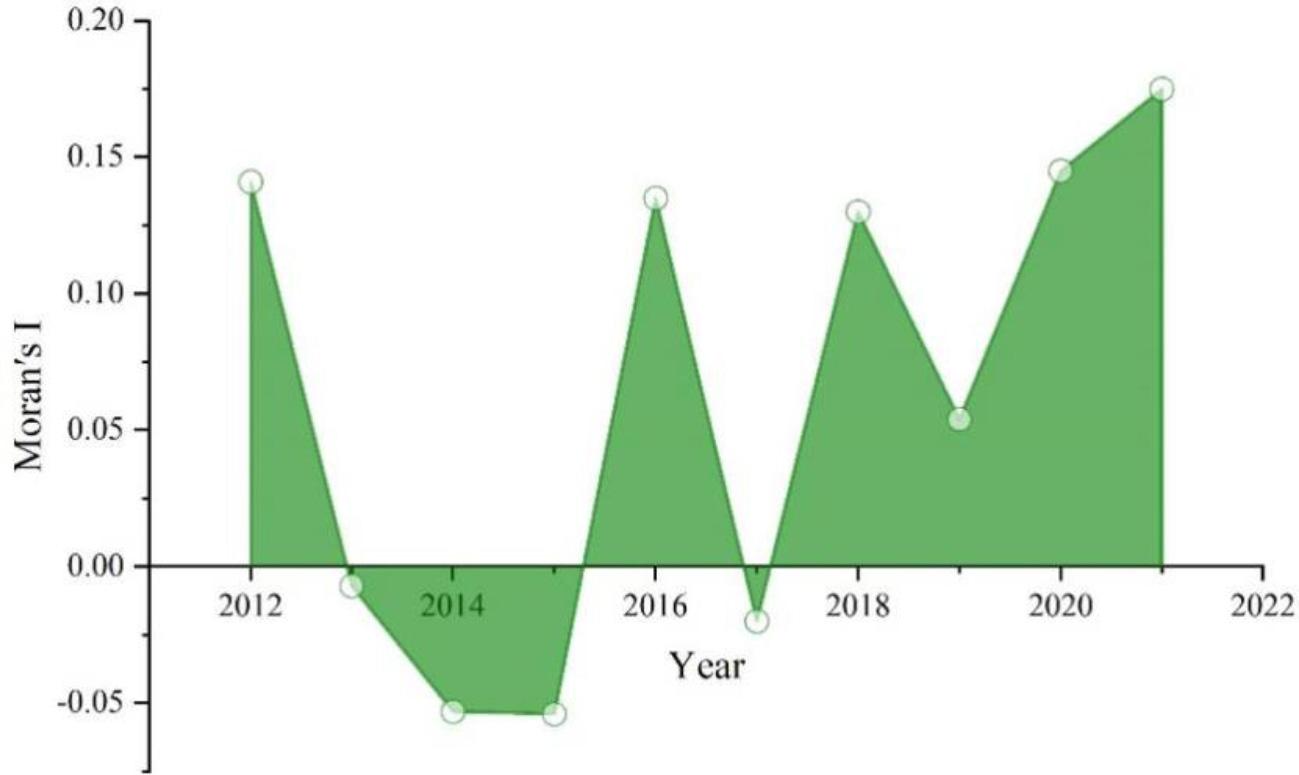
Global Moran index in 2012-2021
Moran scatter plot analysis
Due to the limitation of the length of this paper, in order to highlight the main change process of the spatial distribution characteristics of the economic development of a province, this paper calculates the Moran scatter plot of the regional economy of a province from 2016 to 2021 by GeoDa software and statistically analyzes the quadrant distribution of the 11 regions of a province. Fig. 3 shows the Moran scatter plot of the regional economy of a province from 2016 to 2021, in which (a)~(f) respectively denote the distribution of Moran scatter quadrants of 11 regions in a province from 2016 to 2021 as shown in Table 3. The number of regions belonging to low-value agglomerations in the third quadrant between 2016 and 2021 consistently exceeds the number of regions in the second and fourth quadrants ah, which indicates that there is a certain spatial agglomeration phenomenon in the regions with a similar level of economic development. Specifically, if the regions are all relatively low-value economies indicates that the development characteristics of these regions are more similar. Based on the changes in the Moran scatter from 2016 to 2022, the analysis found that the number of scatter points in Quadrant 1 and Quadrant 4 scatter remained at a relatively stable state. The increase in scatter points in Quadrant II indicates an increase in the number of regions with large development gaps.The third quadrant’s scatter points have decreased by one, which indicates that the economic status of the region or its neighboring regions has improved. For the regions in Hebei Province, Baoding’s change from “LL” to “LH” indicates that the economy of its neighboring regions has developed faster, and its economic strength has increased. If the region changes from the “LL” type to the “HH” type, it means that the development speed of the region has been ahead of the neighboring regions for a long time, and the development level of the neighboring regions has also increased. A change from “HL” to “HH” indicates an increase in the level of development of the surrounding counties. However, a change from “HH” to “LL” indicates a decline in the economic level of the area. The change from “LH” to “LL” indicates that the level of development in the surrounding regions of these two areas has declined and does not show a strong regional pulling capacity.
The Moran map of the regional economy of a province in 2016-2021 The Moran scattered quadrant distribution in 11 regions of a province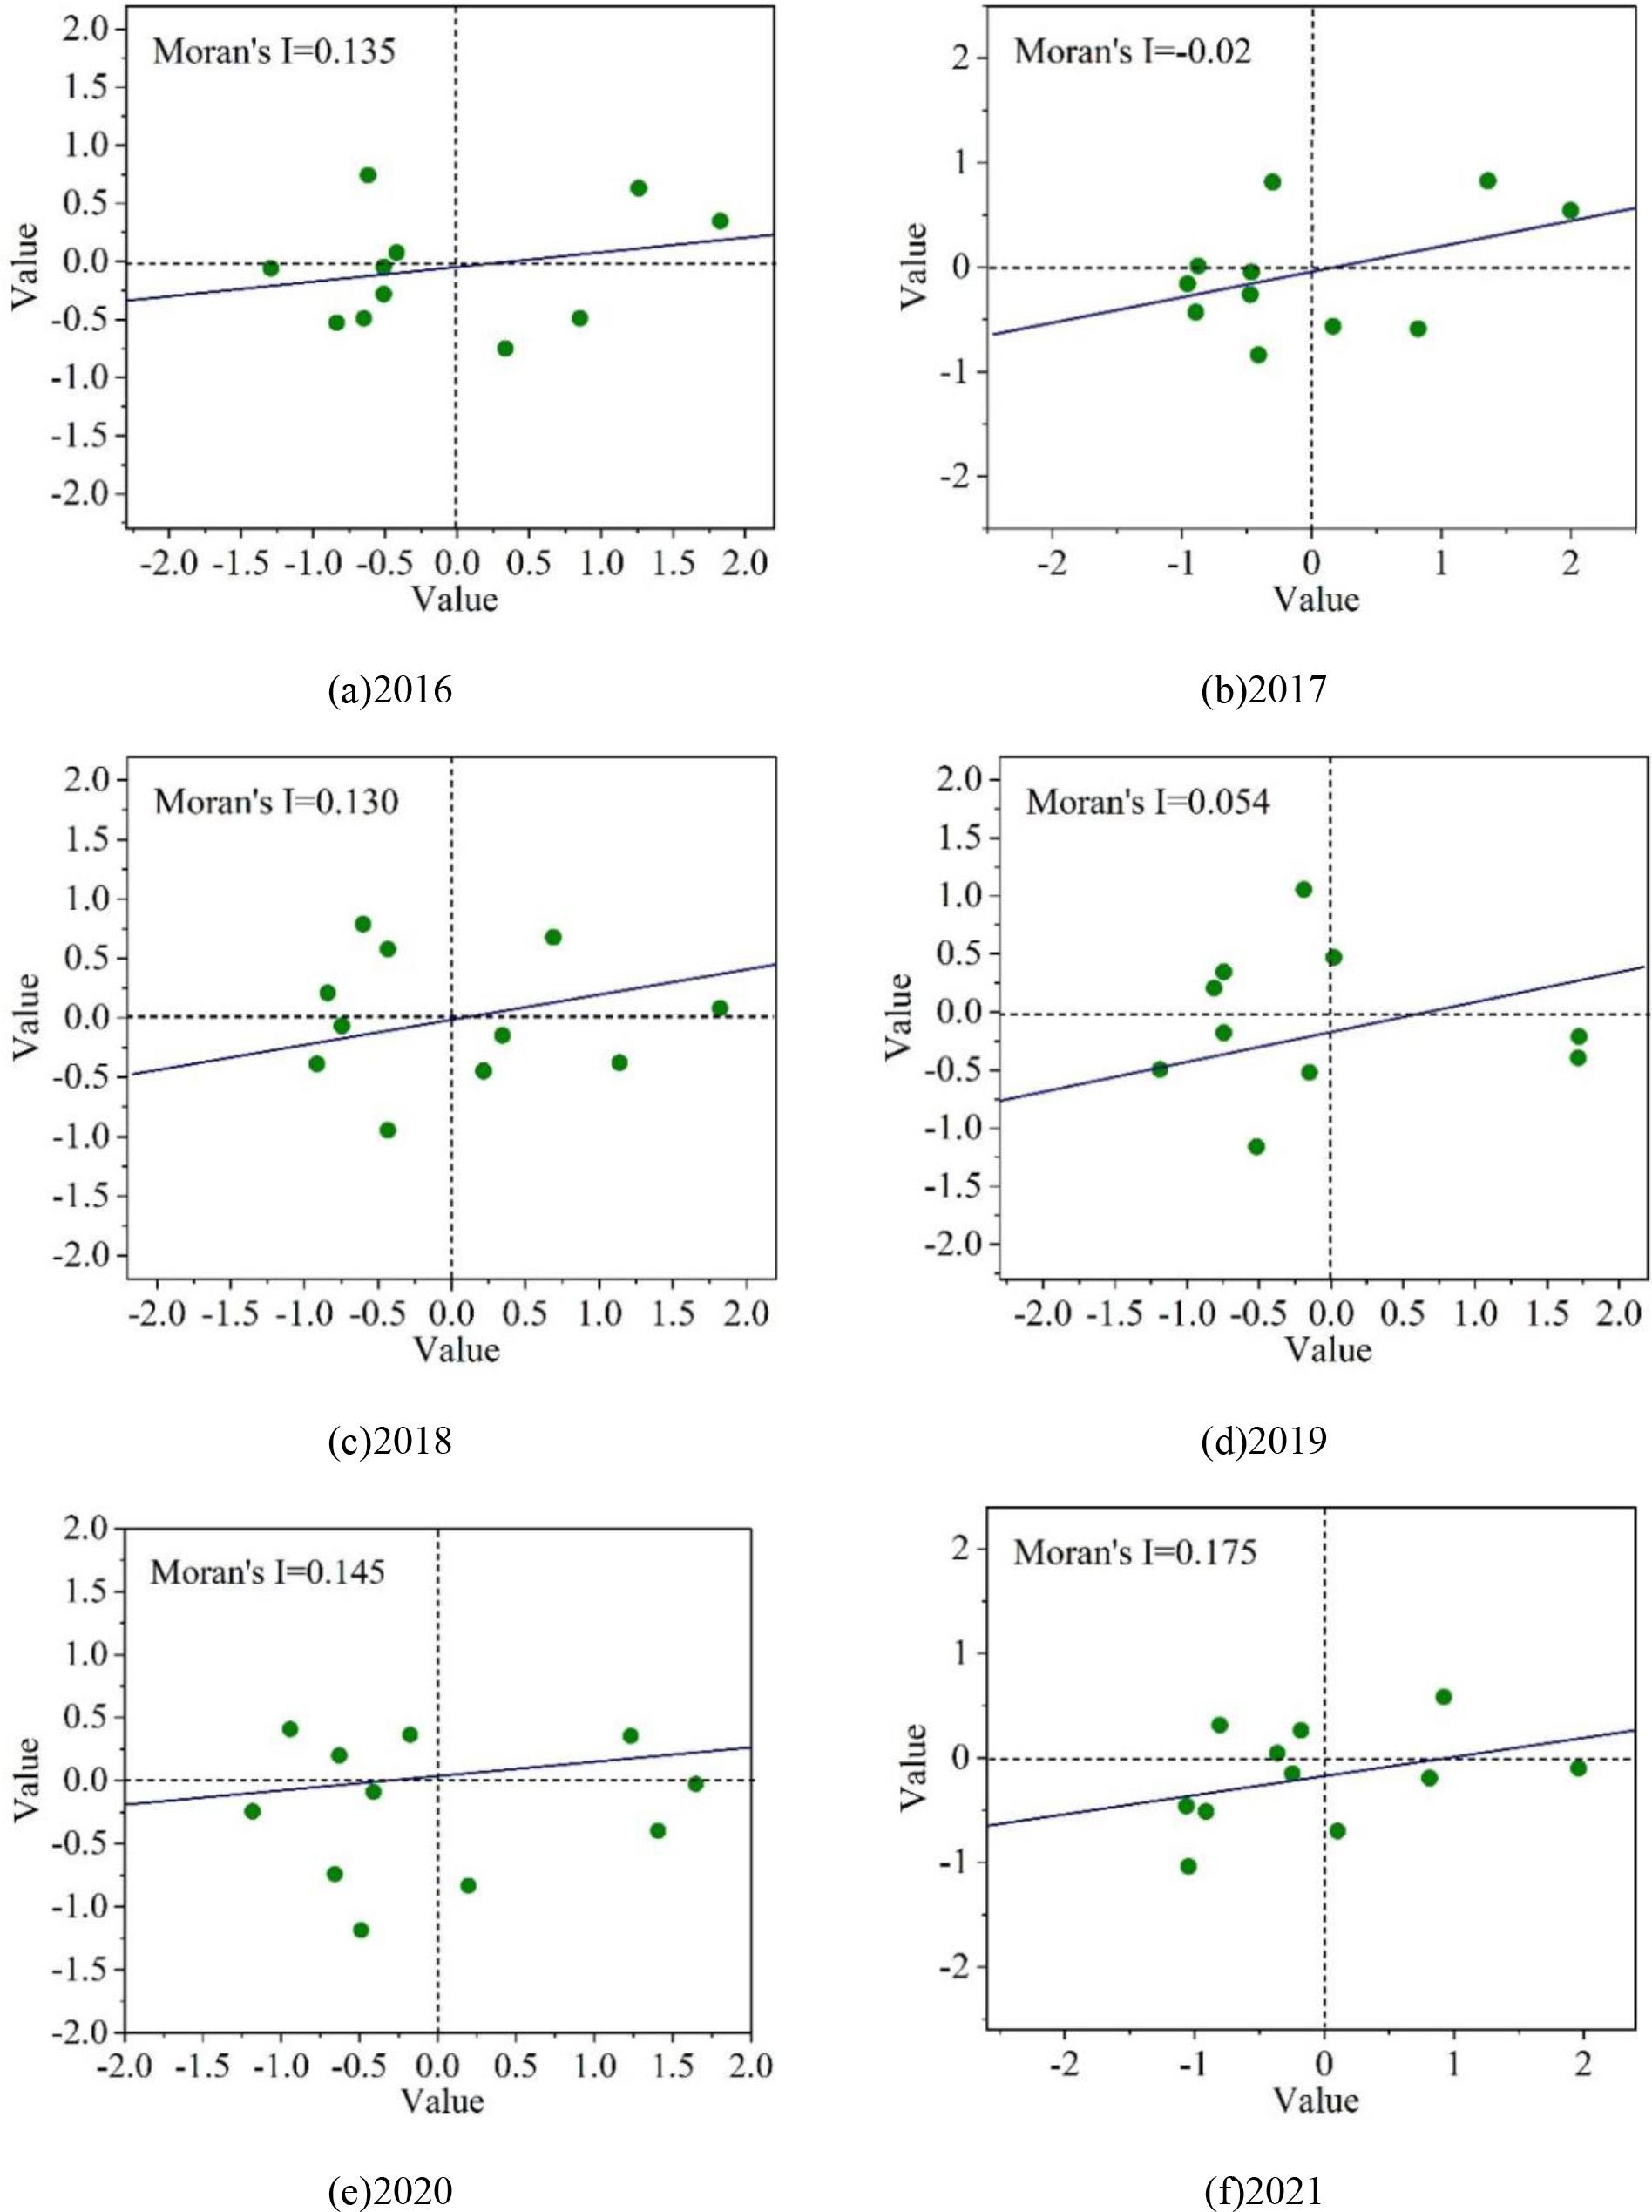
Quadrant
2016
2017
2018
2019
2020
2021
First quadrant
2
2
2
2
1
2
Second quadrant
2
1
3
3
3
3
Third quadrant
5
6
3
4
4
4
Fourth quadrant
2
2
3
2
3
2
LISA cluster diagram analysis
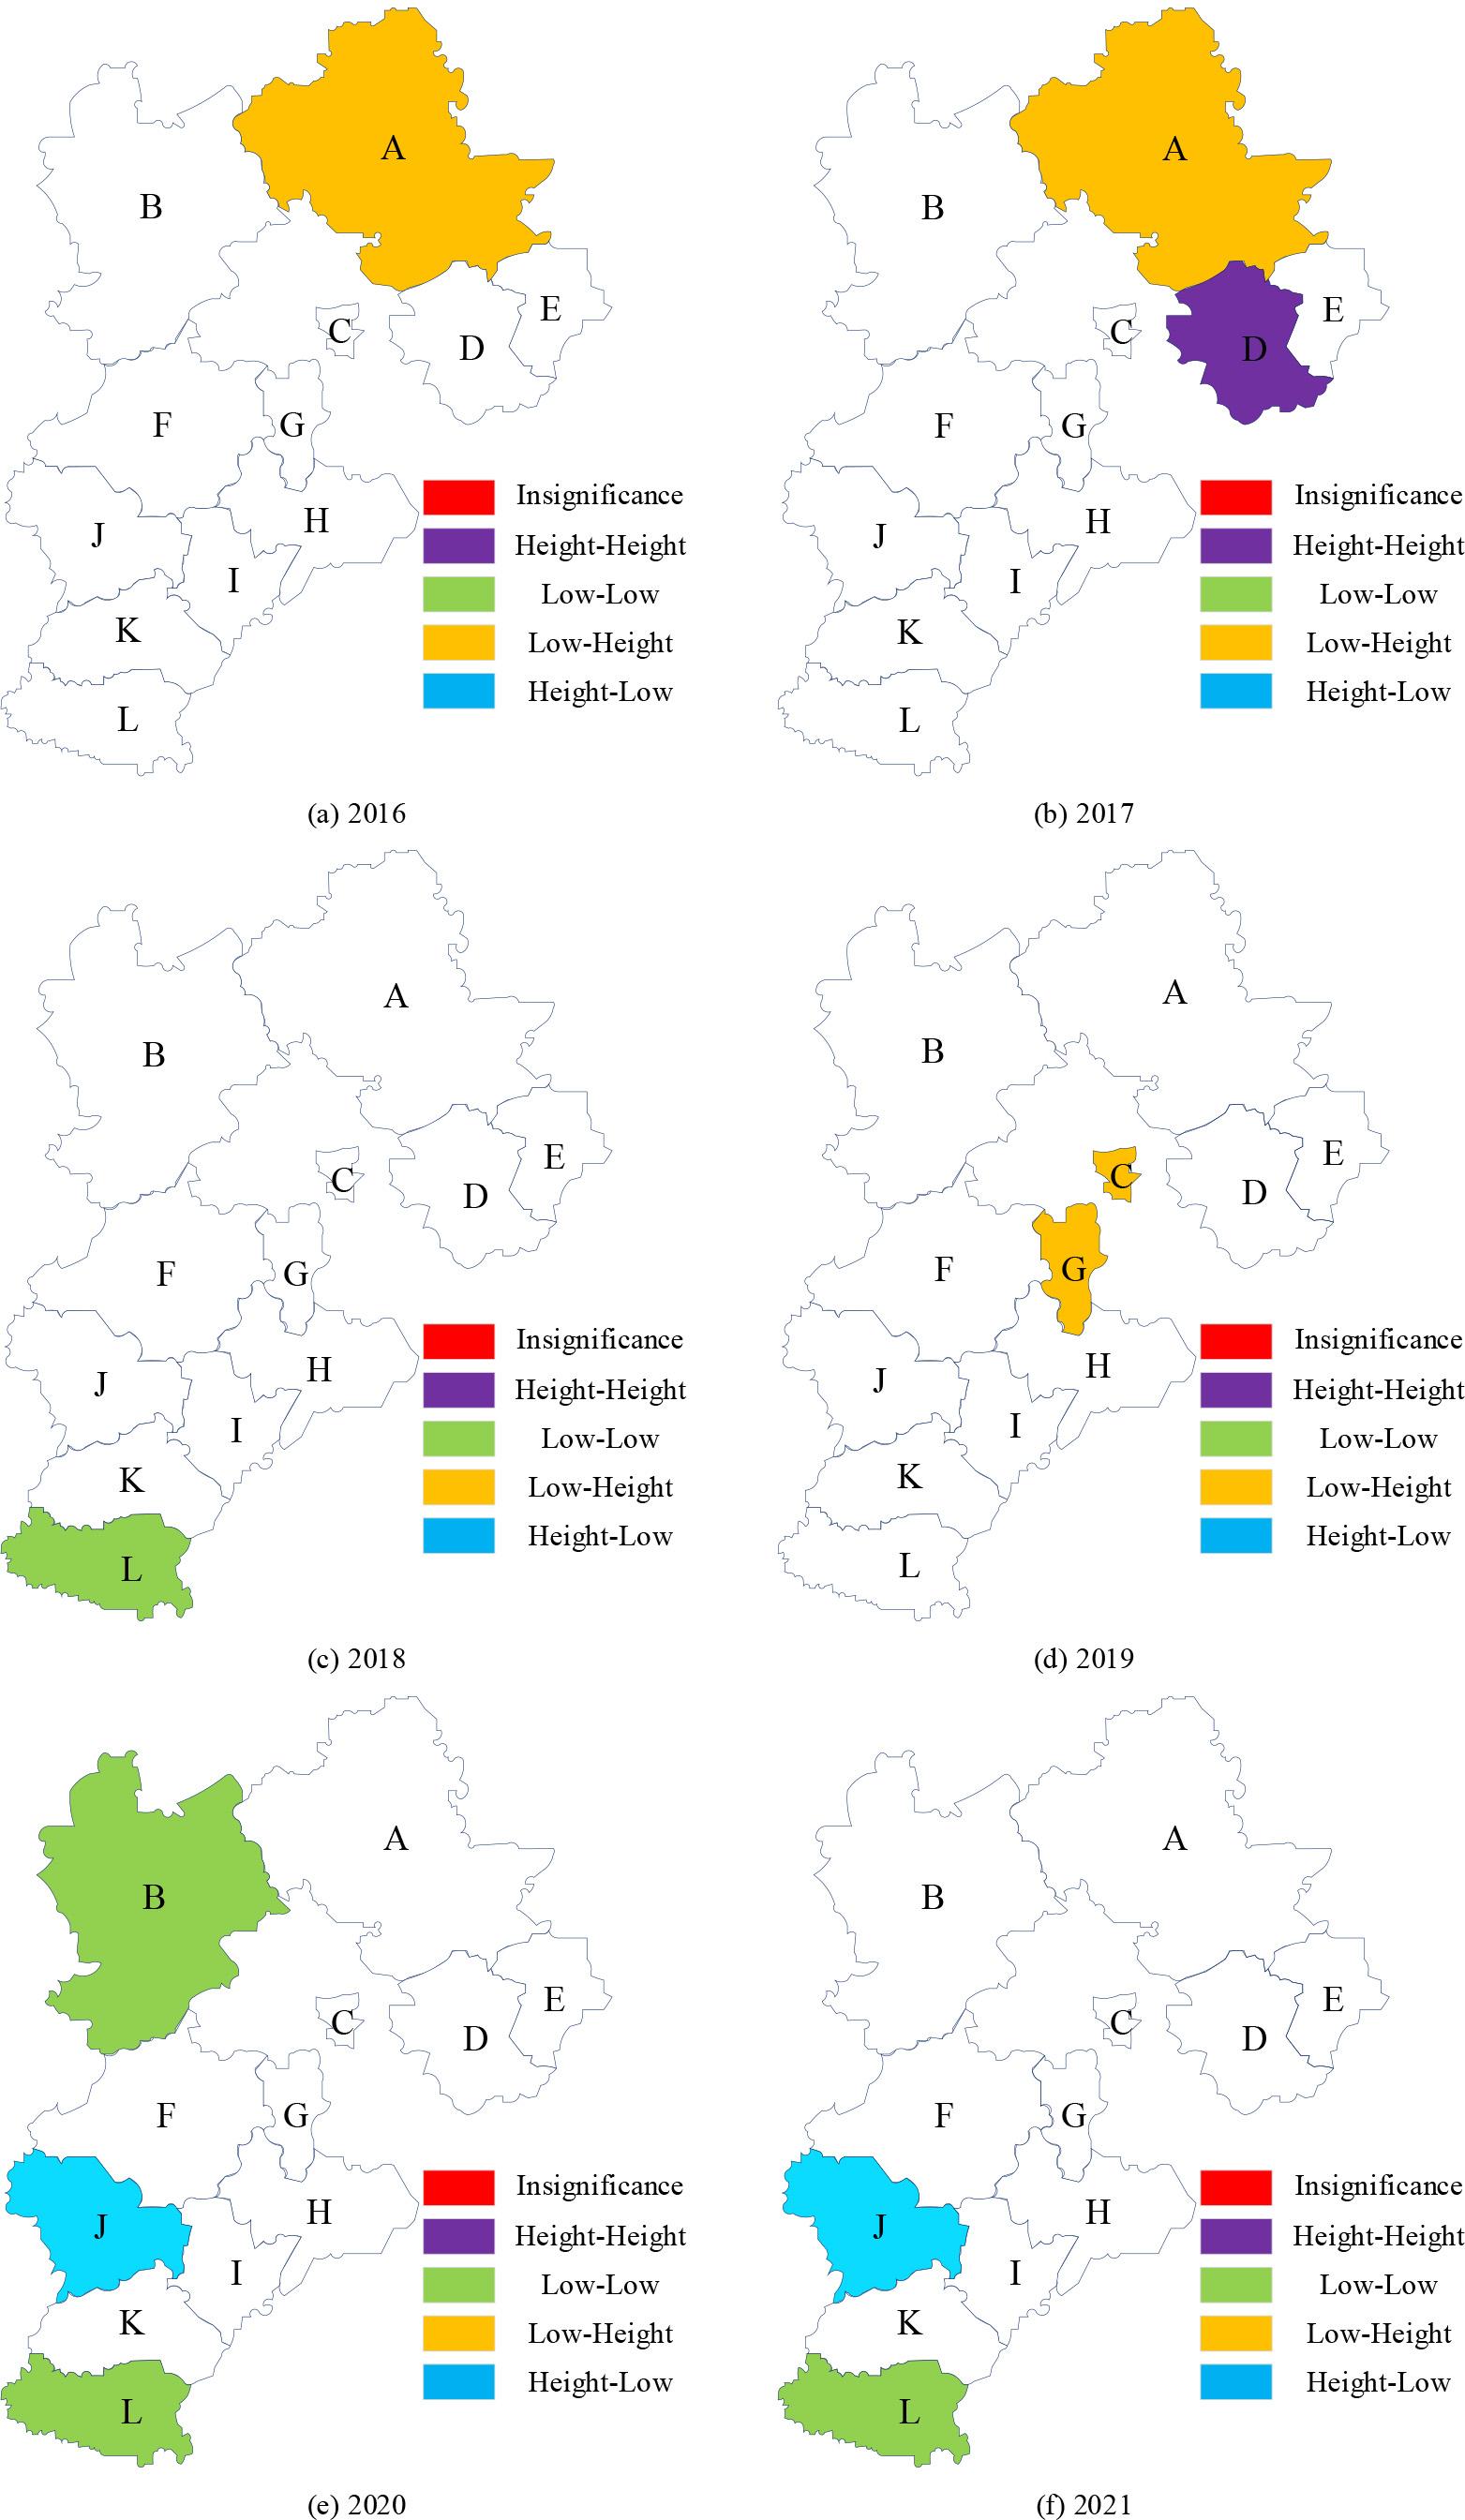
LISA agglomeration map refers to the level of agglomeration of similar geographic areas on the spatial pattern. In this study, the LISA agglomeration map is generated at the level of significance of 0.1 to test the significance of each scatter point, and Figure 4 shows the LISA agglomeration map of the regional economy of a province in 2016-2021. Through the analysis, we found that the overall spatial correlation pattern of regional economic development in a province during 2016-2021 is relatively unstable, showing the following three characteristics:
Both “HH” and “LH” types are not significant. 2016 and 2017, only region A has “LH” agglomeration characteristics and passes the significance test. 2017, the spatial agglomeration characteristic is “LH”. In 2017, the spatial agglomeration characteristics of the “HH” type of Region A and Region D passed the significance test, and in 2019, only Region G and Region C are “LH” type and more significant. “HL” type of significant areas increased, but not obvious. 2020 and 2021, through the test of significance of the “HL” type, are region J, indicating that the level of economic development of region J itself continued to improve, to improve the overall regional economic development level of a province, should focus on playing Shijiazhuang’s economic radiation capacity to pull the economic development of neighboring regions. In order to improve the overall level of regional economic development in a province and reduce the differences in regional economic development, we should focus on Shijiazhuang’s economic radiation capacity and pull the economic development of neighboring regions. The number of regions with significant “LL” type increases and then decreases, with more obvious changes. During the period from 2016 to 2019, the number of significant “LL” regions increased from 0 to 3, and the range of significant regions is mainly concentrated in the southern region of a province. From 2020 onwards, and the number of regions that passed the significance test of the “LL” type decreased to 1, which is only the region L. From 2020 onwards, the number of regions with “LL” type passing the significance test decreases, and in 2021, the number of regions passing the significance test decreases to 1, which is only region L. This shows that in recent years, it has been committed to upgrading the level of overall regional economic development of a certain province, narrowing the regional differences, and focusing on the support of the development of these regions, and it has achieved remarkable and excellent results. LISA gathering chart of a provincial economic region in 2016-2021
Before estimating parameters in panel data, it is necessary to select between fixed and random effects. Hausman test is used to determine whether the panel data is a method of using a fixed effect model or a random effect model. This paper uses STATA software to conduct Hausman test regression to get the Hausman test value of 110.80, and the p-value is 0.001, the establishment of the hypothesis
Then, by conducting an F-test, it is found that F(11.123) > 05.0F(11.123) and the p-value is 0.001, so the original hypothesis is rejected, there are individual effects in the model, and the individual fixed effects model is better than the mixed regression model. Combining the Hausman test and F test mentioned above, this paper chooses the individual fixed effect model. According to the established empirical model, the fixed effect analysis is done through STATA software in order to facilitate the calculation of the 11 evaluation indicators in order to add five factors of industrial structure, basic public services, innovation drive, policy support, and then through the regression to get Model 1, Model 2, Model 3, Model 4, Model 5, and finally the regression on the overall five influencing factors of the entire sample to get the Model 6, the fixed effect analysis of the panel data is shown in Table 4. It can be seen that from the full-sample results, group entry has little effect on the significance of each variable. Overall, the economic factor of regional GDP (Q1) has a positive and significant effect on the level of sustainable regional economic development at a 10% level of significance. The others are identical and will not be repeated.
The fixed effect of panel data is analyzed
| Variable | Model 1 | Model 2 | Model 3 | Model 4 | Model 5 | Model 6 |
| GDP | 0.023 (1.64) | 0.008 (1.89) | ||||
| The added value of the first production | -0.001 (-0.34) | 0.006 (0.44) | ||||
| Industrial added value | -0.003 (-2.04) | 0.004 (2.47) | ||||
| The added value of the third industry | -0.006 (-0.18) | 0.015 (0.54) | ||||
| The number of employees at the end of the year | -0.035 (-0.88) | -0.026 (-0.39) | ||||
| Total retail sales of consumer goods | 0.008 (1.28) | 0.008 (0.76) | ||||
| The actual use of foreign capital | 0.006 (2.25) | 0.008 (2.28) | ||||
| The balance of the year-end balance of urban and rural residents | 0.005 (0.007) | -0.008 (-0.87) | ||||
| The whole club will invest in fixed assets | 0.004 (0.009) | -0.049 (-3.06) | ||||
| Local budget internal income | -0.038 (-2.66) | -0.057 (0.077) | ||||
| Expenditure within the general budget of local finances | 0.097 (0.022) | 0.066 (0.033) | ||||
| _cons | 0.174 (9.08) | 0.158 (6.08) | 0.115 (9.13) | 0.139 (49.08) | 0.104 (6.02) | 0.15 (2.12) |
| R2 | 0.047 | 0.022 | 0.036 | 0.001 | 0.066 | 0.214 |
| F | 2.414 | 1.041 | 2.733 | 0.046 | 7.175 | 3.538 |
In order to verify the reliability of the measurement results, the above regression model is subjected to a robustness test. The robustness test is used to examine the robustness of the evaluation methods and indicators of the explanatory ability, used to test when changing some conditions, the evaluation methods and indicators of the evaluation of the evaluation results to maintain a relatively consistent and stable interpretation, usually the robustness test using changing the sample range, changing the value of the parameters, changing the explanatory variables and other methods. The results of the robustness test are shown in Table 5. In this paper, model 7 replaces the quantitative value of the indicator in the current period with the quantitative value of the indicator in the lagged period, and model 8 replaces the evaluation indicator so as to carry out the robustness test. According to the data in the table, it can be concluded that the results of model 7 and model 8 are basically consistent with the estimation results of model 6, so the full-sample estimation results can be considered robust.
Robustness test results
| Variable | Model 6 | Model 7 | Model 8 |
| Original model | Explain the variable lag issue | Replace the explanatory variable | |
| GDP | 0.018 (1.935) | 0.016 (1.934) | 0.019 (1.933) |
| The added value of the first production | 0.006 (0.485) | 0.005 (0.484) | 0.007 (0.483) |
| Industrial added value | -0.016 (-2.538) | -0.017 (-2.537) | -0.018 (-2.536) |
| The added value of the third industry | 0.015 (0.545) | 0.016 (0.546) | 0.014 (0.543) |
| The number of employees at the end of the year | 0.008 (0.805) | 0.009 (0.806) | 0.007 (0.804) |
| Total retail sales of consumer goods | 0.008 (2.335) | 0.007 (2.334) | 0.007 (2.334) |
| The actual use of foreign capital | -0.008 (-0.915) | -0.007 (-0.914) | -0.009 (-0.913) |
| The balance of the year-end balance of urban and rural residents | -0.049 (-3.06) | -0.048 (-3.05) | -0.047 (-3.07) |
| The whole club will invest in fixed assets | -0.045 (0.442) | -0.046 (0.443) | -0.044 (0.441) |
| Local budget internal income | 0.237 (0.013) | 0.236 (0.012) | 0.238 (0.014) |
| Expenditure within the general budget of local finances | 0.388 (0.007) | 0.387 (0.006) | 0.389 (0.008) |
| _cons | 0.174 (9.08) | 0.173 (9.07) | 0.175 (9.09) |
| R2 | 0.214 | 0.213 | 0.215 |
| F | 3.569 | 3.568 | 3.570 |
Based on the characteristics of sustainable regional economic development, this paper proposes a study of sustainable regional economic development based on spatial autocorrelation. Based on the construction principle of the evaluation index system, the comprehensive evaluation index system of regional economic sustainable development is determined, and then the spatial weight matrix is composed. Comprehensive research data and spatial autocorrelation calculation formula are used to explore the level of sustainable economic development in regions. The global spatial autocorrelation index was in a relatively rapid decline stage from 2012 to 2015, from 0.141 to -0.054, indicating that the economic ties between regions were more sparse during this period, but it was in an upward stage from 2015~2016, with a rapid increase in the Moran index from -0.054 to 0.135, followed by the 2016-2017 period of economic recession, and by 2017-2021, the Moran index has remained greater than 0 despite economic instability. In addition, in 2021, the number of regional economies of type “LL” is reduced to one, which is only region L, i.e., it has been committed to improving the overall level of regional economic development of a province in recent years.GDP (Q1) has a positive and significant impact on the level of sustainable development of the regional economy at the 10% significance level, and the remaining 10 indicators are all significant and pass the robustness test. Passed the robustness test. Demonstrating the current level of sustainable development of the regional economy makes people further realize the importance of regional economies, which are practical value for promoting economic development.
In order to realize sustainable regional economic development, it is necessary for all people to firmly establish a sense of sustainable development and to assume their respective responsibilities and obligations in sustainable regional economic development. We will continue to transform government functions, maintain the correct direction of regional economic development, create a favorable market environment and fair competition conditions, and make the market mechanism the dominant force in promoting regional economic development. Accelerate the transformation of the mode of economic growth and establish a low-consumption, high-yield, economizing regional economic system.Improve the urban ecological environment and enhance the comprehensive functions of the city in terms of large production, market, and service.Improve the irrational economic structure and continuously adjust the supply structure and quality of public goods and services.Focus on talent cultivation and advocate scientific and technological innovation, so that science and technology can be transformed into the first productive force. Develop scientific planning and highlight regional characteristics. Strengthen exchanges and cooperation, and strive for mutual benefits. Properly handle the relationship between environment and development, equity and efficiency, material civilization and spiritual civilization, urban development and regional progress, immediate and long-term interests, and local and overall interests. These are all issues that need to be carefully considered and implemented seriously by policymakers and implementers.