Professional Development Paths and Teacher Competence Enhancement of Vocational School Teachers under the Integration of Intelligent Technology

Published Online: Mar 17, 2025
Received: Oct 27, 2024
Accepted: Feb 10, 2025
DOI: https://doi.org/10.2478/amns-2025-0212
Keywords
© 2025 Lingyu Zhou, published by Sciendo
This work is licensed under the Creative Commons Attribution 4.0 International License.
Vocational school teachers are a vital part of the vocational education system. They bear the multiple missions of training students, conducting research and serving the society. However, with the development of the times and social changes, the professional development of vocational school teachers also faces new challenges and opportunities [1-4]. In recent years, with the continuous progress and application of intelligent technology, teachers in vocational schools are facing various changes in teaching and research, which triggered the research interest in the professional development and ability enhancement of college teachers based on intelligent technology [5-7].
With the progress of educational technology, traditional teaching methods are gradually replaced by intelligent-assisted teaching. Intelligent technology can provide college teachers with personalized teaching programs and intelligent assessment guidance through independent learning and data analysis. Through intelligent technology, vocational school teachers can better understand the learning characteristics and needs of students and provide more accurate and effective teaching [8-11]. At the same time, smart technologies can also reduce the teaching load for vocational school teachers and help them better manage the classroom and resources. The application of these technologies will greatly enhance the teaching level and career development space of vocational school teachers, thus contributing to their overall teaching ability [12-15]. However, the professional development of vocational school teachers based on smart technologies also faces some challenges. Intelligent technologies require a large amount of data support and algorithmic models, which often contain a large amount of personal information. Therefore, college teachers need to ensure the privacy protection and security of data when using smart technologies [16].
Based on the development of intelligent technology, this paper establishes a professional development path for teachers in vocational schools, encompassing the construction of teaching environment, education and teaching reform, improvement of teachers’ ability, balanced development of education and innovation of teaching evaluation. For the application of intelligent technology in teachers’ professional development, taking the analysis and monitoring of teaching classroom as the focus point, on the one hand, facial landmark features are fused through cross-attention and self-attention, and input into ViT network to realize students’ facial expression recognition. On the other hand, based on the residual (2+1) dimensional network structure, 3D convolution is decomposed into spatial and temporal convolution, and Transformer coding layer and auxiliary loss function are introduced to realize students’ behavioral gesture recognition. After fusing facial expression recognition and behavioral gesture recognition at the decision-making layer, a student classroom emotion recognition model is obtained, and a case study is conducted as an example of a classroom in a vocational school to judge the effectiveness of the proposed method in this study. Then, 25 elements of teacher competence are screened out through literature analysis and questionnaire survey, and the ratings of these elements are obtained by questionnaire survey, and the collected data are downgraded through exploratory factor analysis to establish a model of teacher competence in vocational schools. Based on this, the enhancement strategy of teacher competence is explored in combination with intelligent technology.
The continuous development of intelligent technology has prompted people to re-examine the role and positioning of teachers in vocational schools, and to explore the reshaping of the role of teachers in vocational schools and the path of professional development. The methods and paths of intelligent technology to promote the professional development of teachers are shown in Figure 1. To realize the professional development of teachers with the help of intelligent technology, we should start from the five aspects of synchronous construction of the teaching environment, educational and teaching reforms, improvement of teachers’ competence, balanced development of education and innovation of teaching evaluation.
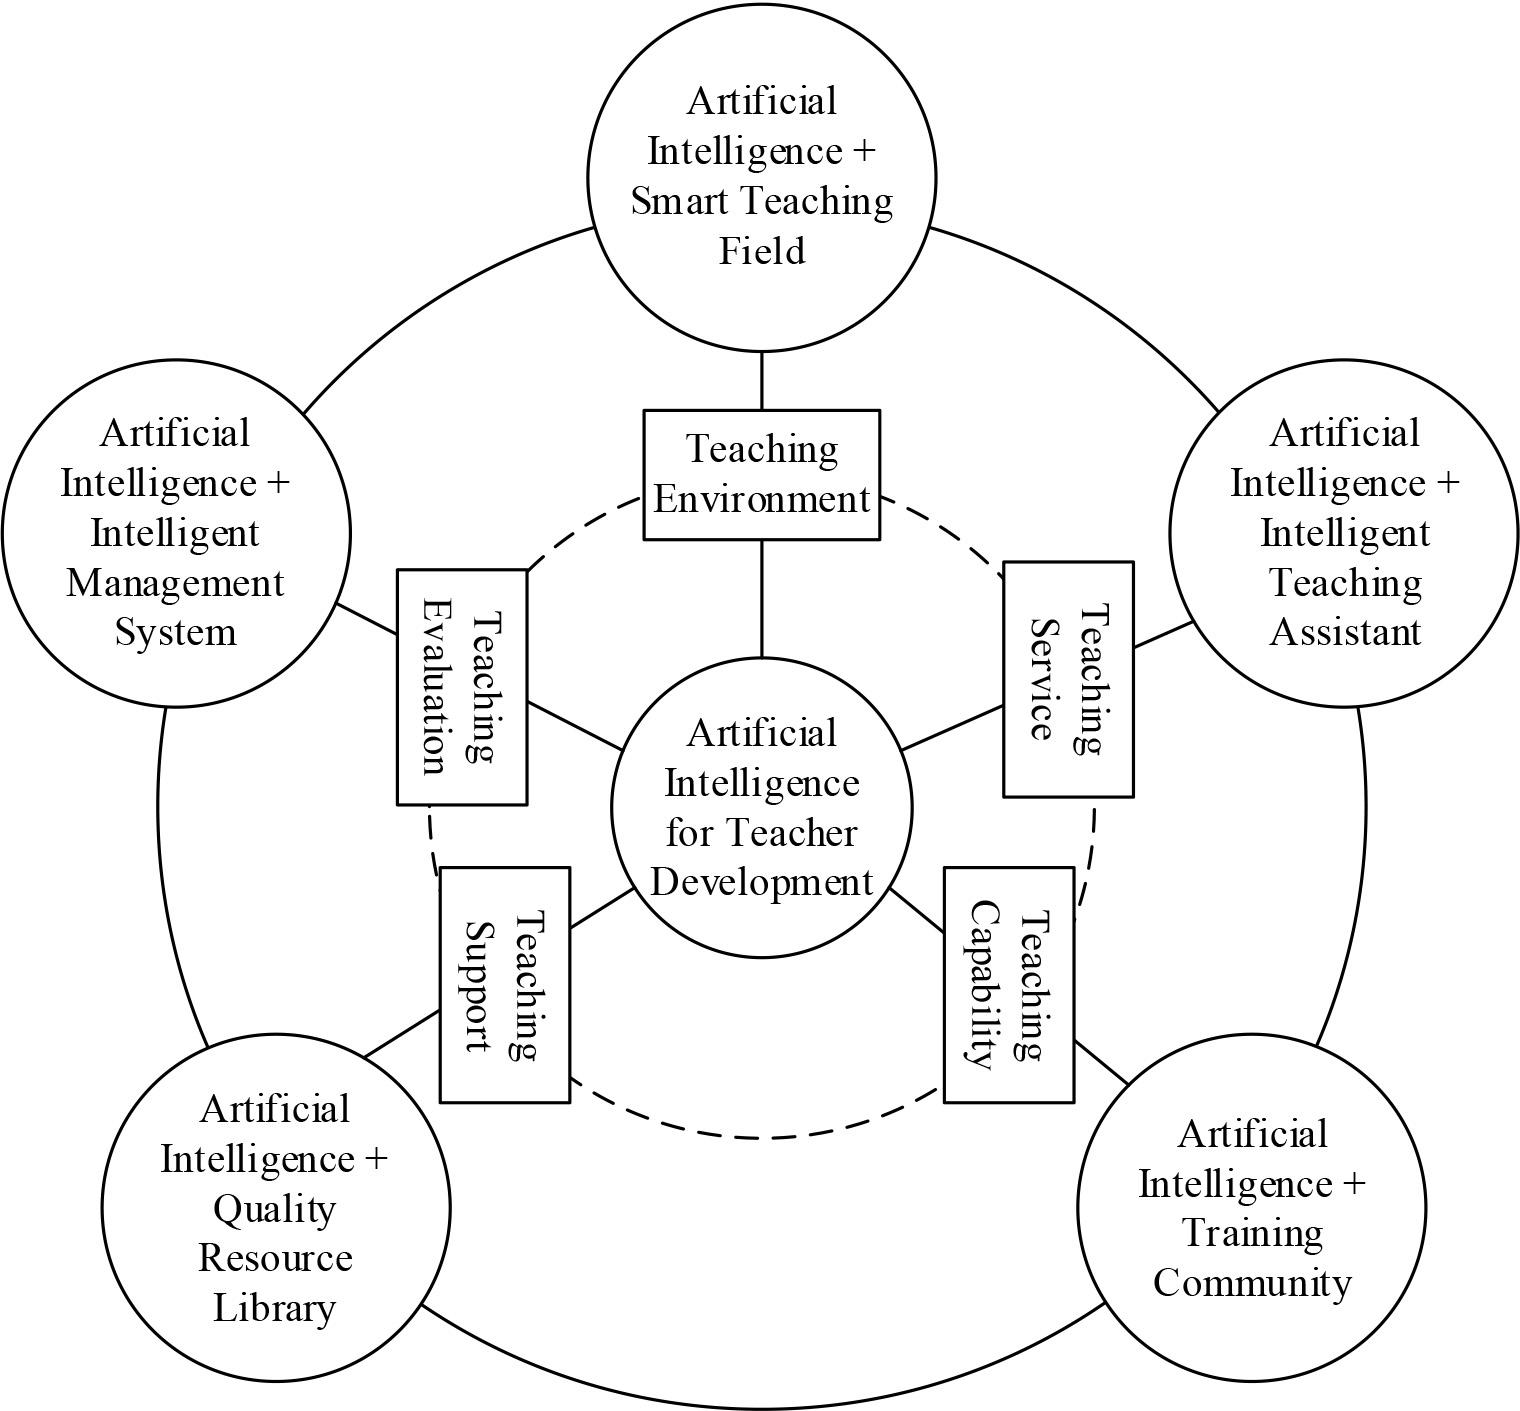
The path of intelligent technology to promote the development of teachers
Intelligent technology and big data technology can help build a highly interconnected smart education and teaching field that integrates physical and virtual teaching spaces, optimizing and promoting the comprehensive development of teachers. First, big data, 5G, wired, wireless and IoT are integrated to build smart campuses and smart teaching environments, including modernized physical teaching environments such as interactive seminar smart classrooms, remote interactive smart classrooms, VR immersive smart classrooms, and micro-grid training smart classrooms, as well as online learning spaces and virtual simulation learning spaces, to provide teachers with smart technology and teaching support. Secondly, AR, multi-modal fusion technology, automatic decision-making technology, text enhancement technology, etc. are applied to the smart teaching environment to provide technical support for teacher-student, student-student, and human-computer interactions.
Utilizing big data, Internet of Things, cloud computing and other intelligent facilities to create teacher-wise teaching assistants can provide technical support for teacher development and reshape the ecology of teacher professional development. Firstly, smart teaching assistants have features such as immersion and interactivity, which help to enhance knowledge reserves, promote learning, and improve classroom efficiency. Second, intelligent teaching assistants can assist teachers in lesson preparation, intelligently recommend learning resources and technology tools, generate personalized teaching resources, provide personalized Q&A and after-school tutoring, assist teachers to get rid of mechanical teaching work, and promote teachers to innovate teaching content and change the teaching mode. Third, students can interact with the intelligent teaching assistant by asking and answering questions, and the assistant can further ask questions while answering them, forming a positive interaction between the two.
First, build a training community platform, use wearable devices, voice recognition technology, etc. to collect teachers’ physiological data, teaching behavioral data, teaching psychological data, teaching emotional data, etc., and establish teachers’ portraits by means of data analysis to provide diagnosis and advice. Secondly, using teacher training and the practical experience of regional teacher development, it carries out online and offline hybrid research and practice on improving teachers’ teaching ability, and realizes regular guidance by means of pairing and helping. Finally, through mutual evaluation, resource sharing and collaborative learning among teachers, we promote the innovation of mechanisms, reorganization of resources and migration of services, and carry out in-depth discussions to enhance the effectiveness of training and promote teachers’ professional development.
With the help of big data technology and other means, it aggregates high-quality educational resources, establishes a high-quality resource base, promotes the common construction and sharing of high-quality educational resources and the innovation of application services, and creates a sustainable digitalized educational resource-sharing ecosystem. First, develop teacher development platforms such as intelligent teaching platform, intelligent diagnosis platform, virtual teaching and research platform, develop training resources that integrate online and offline, and create a teacher teaching resource library, teacher development course library, and teaching status database. Secondly, based on teacher portrait data, establish a quality resource sharing mechanism according to teachers’ learning characteristics, realize intelligent selection of quality resources and merit-based push services to meet teachers’ professional development needs. Finally, establish the standard and mechanism for regular updating of quality resources to ensure the quality of the teacher development quality resource database and provide teachers with quality resource services.
Relying on the intelligent environment, we have established an intelligent management system, which collects, mines and analyzes data in the teaching scene, detects teaching effects, diagnoses teaching problems, guides teaching practice, optimizes education management, and forms an intelligent, standardized and scientific teaching management system. Firstly, it tracks and records teachers’ development paths, and accurately diagnoses teachers’ development needs, development status and development strategies. Secondly, it realizes intelligent diagnosis of teachers’ and students’ “teaching” and “learning” behaviors, dynamically analyzes and evaluates learners’ behaviors, and forms a visual diagnostic analysis report and systematic and precise promotion plan for teachers’ disciplinary knowledge, professional competence, and literacy level. Finally, the diagnostic feedback of teaching through artificial intelligence provides innovative solutions for teaching organization and learning activities to improve teaching efficiency.
According to the above teacher professional development path based on intelligent technology, intelligent technology can be utilized to build a teaching assistant system to dynamically monitor students’ learning status and empower vocational school teachers’ classroom teaching. Based on this, this chapter uses computer vision and other related technologies to construct a classroom emotion recognition model that integrates facial expressions and behavioral gestures to help vocational school teachers obtain real-time feedback from students in the classroom, so that they can adjust their teaching in time and improve the quality of classroom teaching.
This section aims to recognize students’ emotional states in the classroom through the observation of facial expressions. A dual-attention fusion of facial landmark features for Vision Transformer expression recognition method called DualAtt-ViT is proposed.
The EfficientNet-B0 network is used to extract the facial landmark features, while the DenseNet-121 network is used to extract the global image features.The EfficientNet-B0 searches for the rationalized configuration of the three parameters of the network’s image input resolution
Constraint (4) ensures that the scaling of the network is reasonable, and that as
The DenseNet121 model consists of 4 Dense Blocks and 3 Transition Layers.The Block is internally composed of multiple layers, each of which is directly connected to the outputs of all the previous layers, forming a densely connected network. Therefore, the feature mapping of layer
In this study, feature fusion is realized by introducing a dual-attention mechanism, which combines both cross-attention and self-attention methods to fuse features from DenseNet-121 and EfficientNet-B0 to improve the accuracy of facial expression recognition. Facial landmark features
The output of cross-attention is then computed as:
Here
In this process, the facial landmark features and global image features are first fused and reshaped by the cross-attention mechanism, followed by further optimization by the self-attention mechanism, which together form an intermediate feature representation with dimension (32,49,256).
The ViT network achieves accurate classification of facial expressions through deep learning of multiple Transformer coding layers. During the model training process, the cross-entropy loss function is used to measure the difference between the model output and the real label with the following formula:
For the research of classroom emotion recognition of students based on behavioral gestures, a behavioral recognition method of R(2+1)D-Transformer with fusion of auxiliary loss, named R(2+1)D-Transformer-AL, is proposed.
R(2+1)D network is a deep learning network structure designed for video processing, aiming to effectively extract spatio-temporal features from video data. Conventional 3DCNNs perform direct convolution on three-dimensional data (time × height × width). For each convolution kernel, the number of parameters is calculated as follows:
After obtaining the five dimensional feature tensor (N,512,8,1,1) from the R(2+1)D module, these features are fed into the Transformer coding layer for further transformation. In this layer, the features are transformed into a new tensor Y with dimensions (
In the R(2+1) D-Transformer-AL model, the design of the total loss function adopts an approach that combines the primary classification loss
In this equation,
Primary Classification Loss
Auxiliary loss
The loss functions for both
Focusing on the identification of students’ affective states in the classroom environment, this study constructs a comprehensive analytical framework for classroom affective identification by analyzing two key dimensions: students’ facial expressions and behavioral gestures. To quantify emotional states, the PAD Emotion Scale was used to assign values and quantitatively assess students’ facial expressions and behaviors.
Considering that facial expressions and behaviors may have different importance in expressing emotions, their influence is adjusted by designing a fully connected network and training the weights in the decision fusion process. Therefore, different behaviors and expressions may have different weights when calculating the overall emotion value. Ultimately, the overall average emotion value of students is calculated using the following formula:
The purpose of applying the student classroom emotion recognition system in an actual vocational school education classroom is to apply intelligent technology to classroom teaching in order to verify the usefulness, accuracy and feasibility of the system in actual classroom teaching, and to discuss the application of intelligent technology in the professional development of teachers.
The application object is chosen to be a class of a vocational college with a total of 48 students, of which 22 are female and 26 are male, and the class is divided into four groups on average.
Hardware facilities for data collection are deployed in the class, so the experimental environment is in a real teaching scenario (recording classroom), with two HD surveillance cameras in the front and back of the recording classroom as the global filming tools, one at the front of the classroom to collect the students’ expression and gesture data from the frontal perspective of the students, and the other at the back of the classroom as the auxiliary of the front-end camera to collect the students’ body gesture data and the The other one is at the back of the classroom, as the auxiliary of the front-end camera, to collect the students’ body posture data and the expression data that cannot be captured by the front-end camera, thus improving the accuracy of the recognition and avoiding the occurrence of omission and misdetection. In addition, in order to further analyze the mood and learning state of each group, this study added a mobile filming device at the right rear end of the classroom for real-time filming and recording.
At the end of the course, the classroom video captured by the HD camera is imported into a data acquisition and processing server, which converts the video into an image sequence and uses a facial expression and behavioral gesture fusion algorithm based on intelligent technology to realize the intelligent recognition of students’ emotions, which is provided to the teacher for post-course reflection, introspection, and evaluation.
The teaching process in vocational schools is divided into five stages: problem introduction, activity exploration, work presentation, outcome evaluation and program adjustment. Based on the emotional recognition of students’ facial expressions and body postures, we use data visualization methods, such as “emotion columns”, to present students’ emotional experiences during the problem solving process, and thus analyze the students’ emotional changes and learning status during the problem solving process.
The distribution of the percentage of students’ emotions in each stage is shown in Figure 2, and the trend of the seven emotions in each stage is shown in Figure 3. In each stage of the learning process students’ emotional bias is different, in the initial stage of the classroom teacher for the introduction of the problem, students show more average emotions, mainly neutral (43.4%), that is, the normal natural state of listening to the teacher’s lectures, the student’s emotions are more often shown as happy (29.2%) and surprised (31.5%), indicating that the teacher’s introduction of the content of the teacher to cause curiosity and interest in the students, and thus engaged in listening to the lectures. Thus, they were engaged in listening to the lecture.
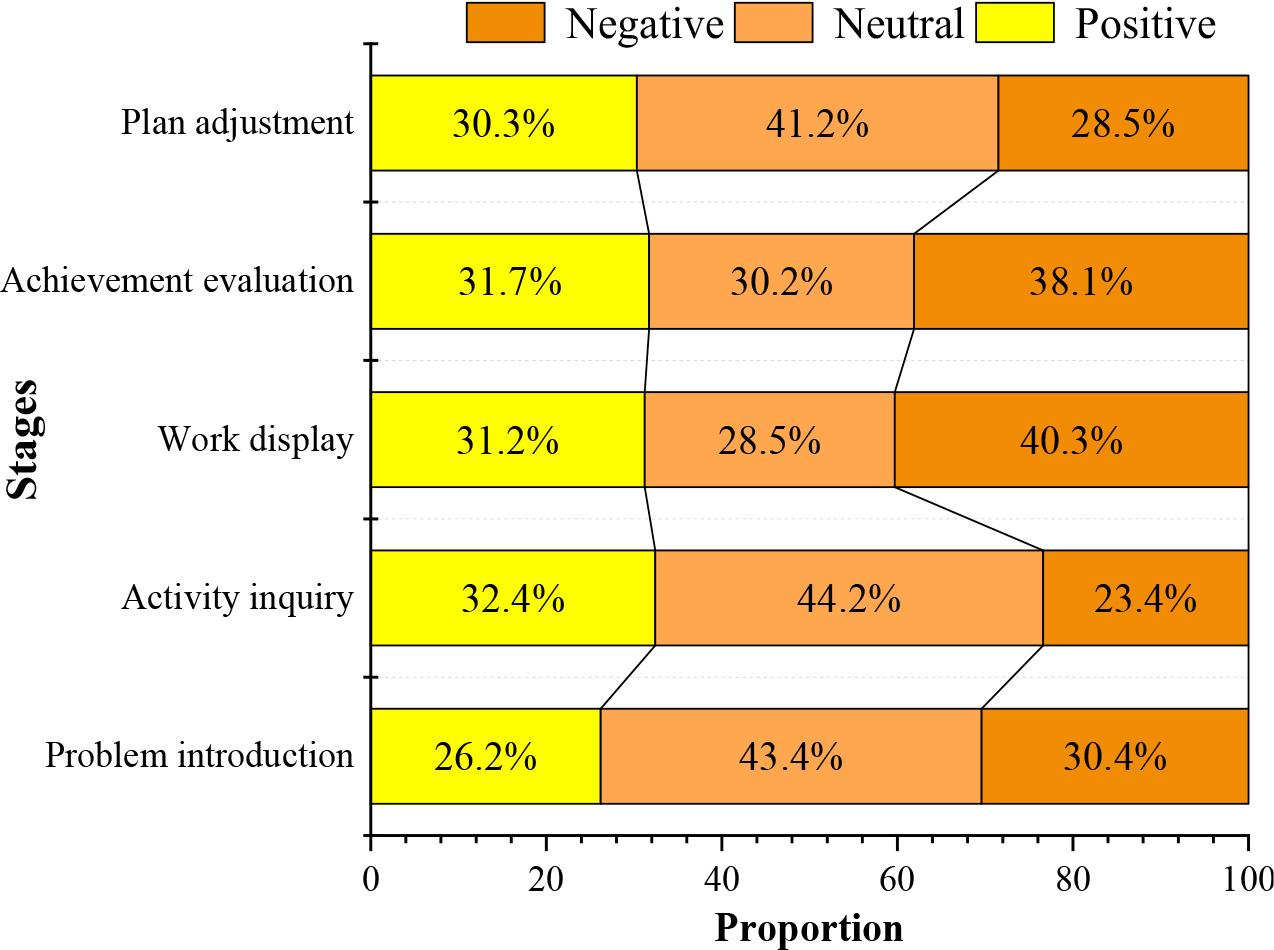
The proportion of students’ emotions at all stages
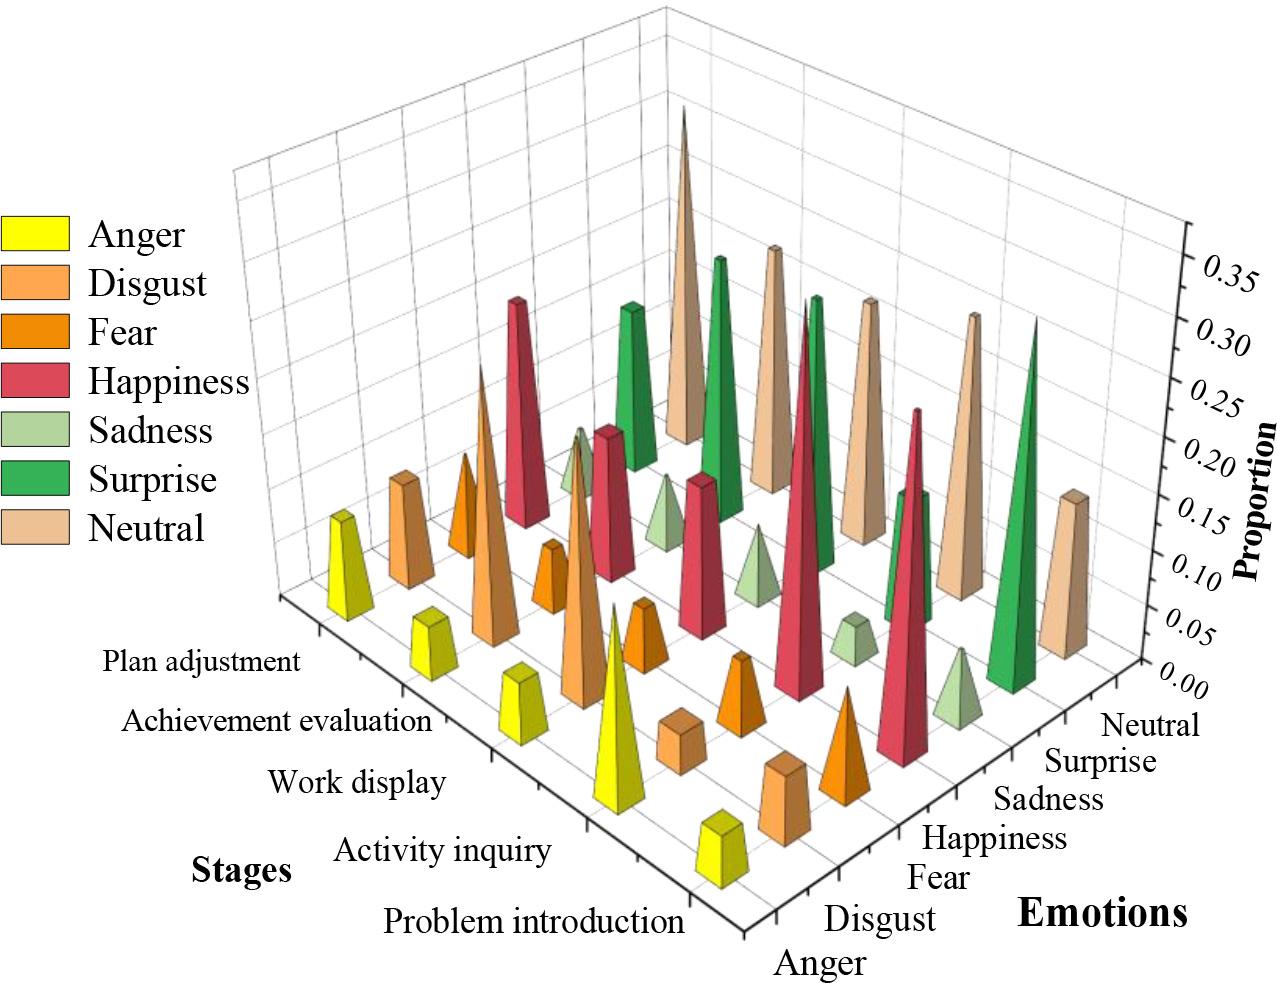
The changes in the seven emotions at various stages
In the second stage of activity exploration, students’ positive emotions increased (32.4%) and negative emotions decreased (23.4%), and more emotions appeared as neutral (24.9%), happy (33.5%), and angry (17.1%), which showed that students needed to divide the task and discuss with their group members to design the model initially in activity exploration, and in this process, there might be a difference of opinion between students, as well as an interest in completing the task. Differences of opinion, but also full of fighting spirit to complete the task, emotions are high, so in this stage students’ learning emotions are the most abundant.
The third and fourth stages of student emotions show a negative bias, negative emotions are more than 38%, specifically to frustration, surprise and neutral, combined with the actual teaching situation found that this stage of the students will be completed works on display, the teacher and the other groups to evaluate it, for the questioning of others, students are prone to produce a sense of frustration, emotionally depressed, for the praise of others, students are prone to Students are prone to be surprised and happy when they are praised by others.
In the fifth stage, students need to design and readjust their works according to the suggestions given by others, and the teacher also provides and explains more optimized problem-solving tools to help students improve their tasks, in which the percentage of students’ negative emotions decreases significantly (28.5%) and the neutral emotions increase (41.2%), which indicates that students are once again engaged in the design activities, and the happy emotions increase significantly.
Specifically, in terms of the seven categorical mood dimensions, neutral and happy moods had the highest percentages, averaging about 23% and 22%, respectively, reflecting the fact that most of the students were not in a high or low mood, and most of the time were in a smoother learning state.
According to the correspondence between emotion and learning state, the average value of learning state of students in each group in each teaching session was counted, and Figure 4 shows the trend of students’ learning state in each group. From an overall point of view, the learning state of the whole class shows a relatively smooth trend of change, with a lower learning state score (7.92) during independent inquiry learning and a significant increase (8.00) in the learning state when the work is displayed for teacher’s evaluation, which indicates that appropriate participation and intervention by the teacher can effectively improve the learning state of students and mobilize their motivation for learning.
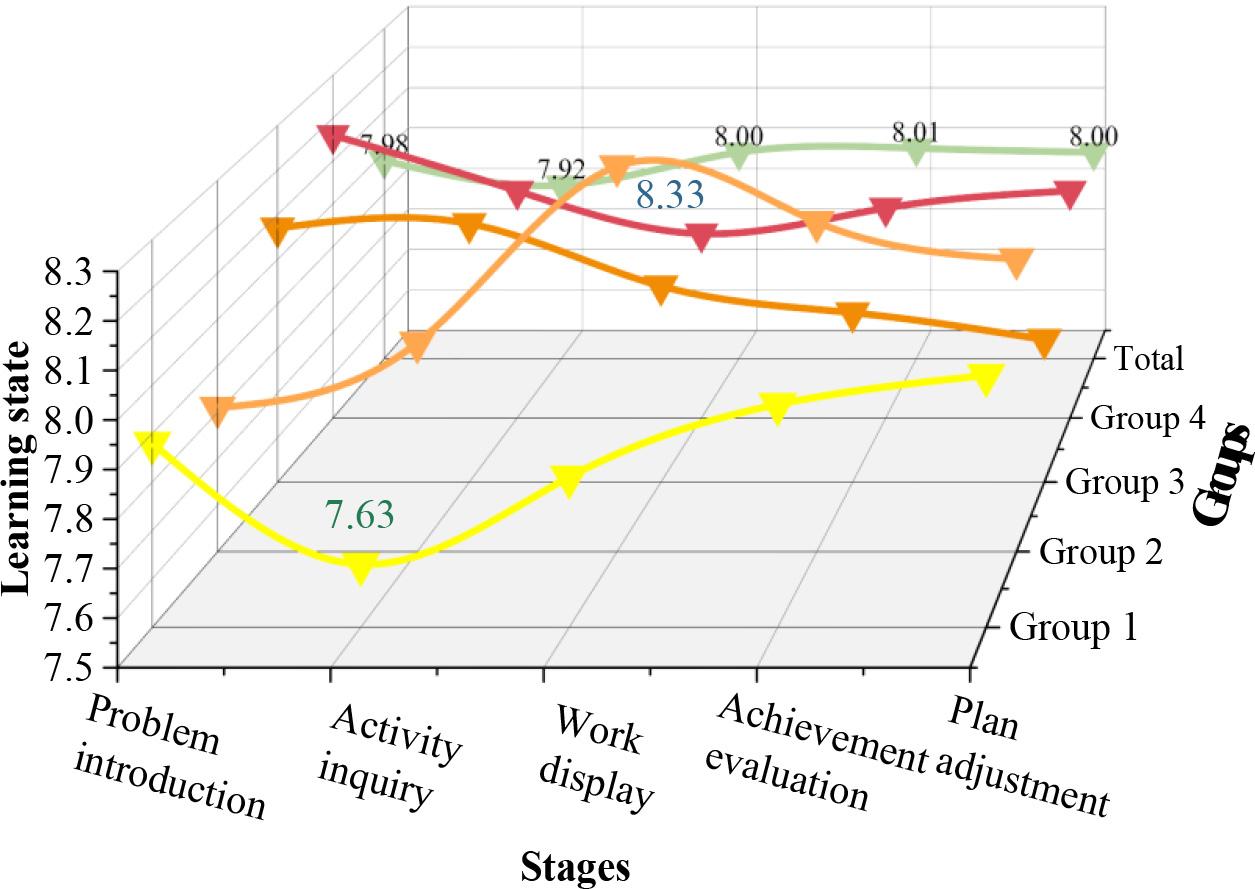
Changes in the learning state of students in each group
The overall learning state of Group 1 was poor, and the group fell into a low state in the second stage of the activity exploration session (7.63).Group 2 had a greater fluctuation in the change of learning state, and presented a high learning state in the process of completing the task on their own and sharing with their peers (8.33), which can be deduced that the students in this group were more motivated in their independent learning, and their learning was more effective.Group 3 tended to flatten out during the entire Group 4 showed a downward trend from the initial state of good, and then slightly improved. It is found that students in different groups have different learning characteristics in each learning stage. Teachers can find out the learning styles of students according to the learning status of students in each course, and then adjust the subsequent teaching strategies and contents in a targeted way to improve the professional development of teachers.
After discussing the application of intelligent technology in teachers’ professional development, this part proposes effective strategies for teachers’ competence enhancement by collecting the characteristic elements of professional competence possessed by teachers in vocational schools, constructing a model of teachers’ competence using SPSS mathematical and statistical analysis, and integrating intelligent technology.
Through literature analysis method, questionnaire survey method and expert opinion method and other methods to collect vocational school teachers should have the ability characteristics of the literature analysis of the ability characteristics of the elements and open-ended questionnaire collected by the ability characteristics of the elements of the analysis, merge, eliminate redundant items, and ultimately get to contain 25 vocational school teachers ability characteristics of the elements of the teacher’s ability characteristics, teacher ability characteristics of the elements of the Table 1, as shown in the preparation of the questionnaires from this. Teachers from a number of vocational schools in a certain place were selected as the target of the survey, and each teacher was asked to score the listed elements of teacher competence, and the questionnaire was actually recovered 223 copies, with a recovery rate of 94.09%, and 205 valid questionnaires, with an effective rate of 91.93%.
Key elements of teacher’s l ability
| Symbol | Element | Symbol | Element | Symbol | Element |
|---|---|---|---|---|---|
| X1 | Professional title | X10 | Practical teaching skills | X19 | Combining theory with practice |
| X2 | Professional knowledge | X11 | Business practical experience | X20 | Education research ability |
| X3 | Basic knowledge | X12 | Professional training | X21 | Academic communication ability |
| X4 | Education expertise | X13 | Industry communication ability | X22 | Sense of responsibility |
| X5 | Teaching method ability | X14 | Communication skills | X23 | Dedication |
| X6 | Teaching design ability | X15 | Social service capacity | X24 | The ability of ideological and moral education |
| X7 | Advanced teaching concept | X16 | Organizational management | X25 | Self-control ability |
| X8 | Teaching management capabilities | X17 | Information update ability | ||
| X9 | Verbal ability | X18 | Self-learning ability |
Through the feasibility test of the questionnaire data, the KMO sampling aptitude measure is 0.869, indicating that the correlation between the variables is very strong, while the Bartlett spherical chi-square value is 6195.622, and the significance level of sig is 0.000 < 0.05, indicating that the items are not independent of each other, and that the scale data come from the overall of the normal distribution, and the rejection of the null hypothesis indicates that it is suitable to carry out the factor analysis.
Factor analysis is a statistical analysis method that describes most of the original information with a few factors through dimensionality reduction. According to the correlation size of each index, it reorganizes the original variables by means of coordinate transformation to convert the original multiple correlated variables into another group of irrelevant variables by making linear changes, even if the correlation between variables in the same group is high and the correlation between variables in different groups is low. The first few principal components with the highest variance are selected, thus reflecting most of the original variable information with fewer variables, i.e., common factors. The sum of the product of the variance contribution ratio of each factor as a weight and the score of that factor is then used to construct the composite score function.
The model of factor analysis method is as follows:
Assuming
When
Let
The element
The analytical steps of factor analysis are:
A potentially fundamental premise of factor analysis is that there should be strong correlations between the original variables, otherwise it is not possible to construct fewer common factors reflecting the common characteristics of certain variables. The Bartlett’s test of sphericity and the KMO method are usually used to test whether the original variables are amenable to factor analysis.
Among the methods for solving factor loading matrix, principal component analysis based on principal component model is the most widely used, which transforms the original variables into another set of uncorrelated variables, i.e. principal components, by making linear changes through coordinate transformation.
Its mathematical model is:
Of these,
The factor loading matrix is the
In order to reduce the number of variables, the number of factors in the mathematical model of factor analysis
To determine the number of common factors
The public factor variables obtained after principal component analysis are new variables obtained after linear transformation and their meaning needs to be defined.
A row in loading matrix
Factor rotation is the right-multiplication of the factor loading matrix
After determining the factor variables, what needs to be obtained are the specific data values for the different common factors, which are the specific values of each factor on each sample. The score function for the
Comprehensive evaluation is usually done using a factor-weighted total score, which is calculated using the formula:
The results of the recovered valid questionnaires were entered into SPSS for factor analysis to obtain the descriptive statistics of the data. The statistical results of the sample teachers’ competency profile elements are shown in Fig. 5. The average value of the importance of the 25 teachers’ competency profile elements fluctuates between 3.25 and 4.30, and the importance of all the elements is above the general level, from which it can be seen that these 25 teachers’ competency profile elements derived through the literature screening method as well as the questionnaire survey method are scientifically sound and reasonable. In addition, the standard deviation of the 25 elements of teacher competence fluctuates between 0.30 and 0.79, and the standard deviation of each element of competence is not very large and roughly comparable, so it can be seen that there is consistency in the scoring of the same element by the subjects, which strengthens the credibility of the results of the study.
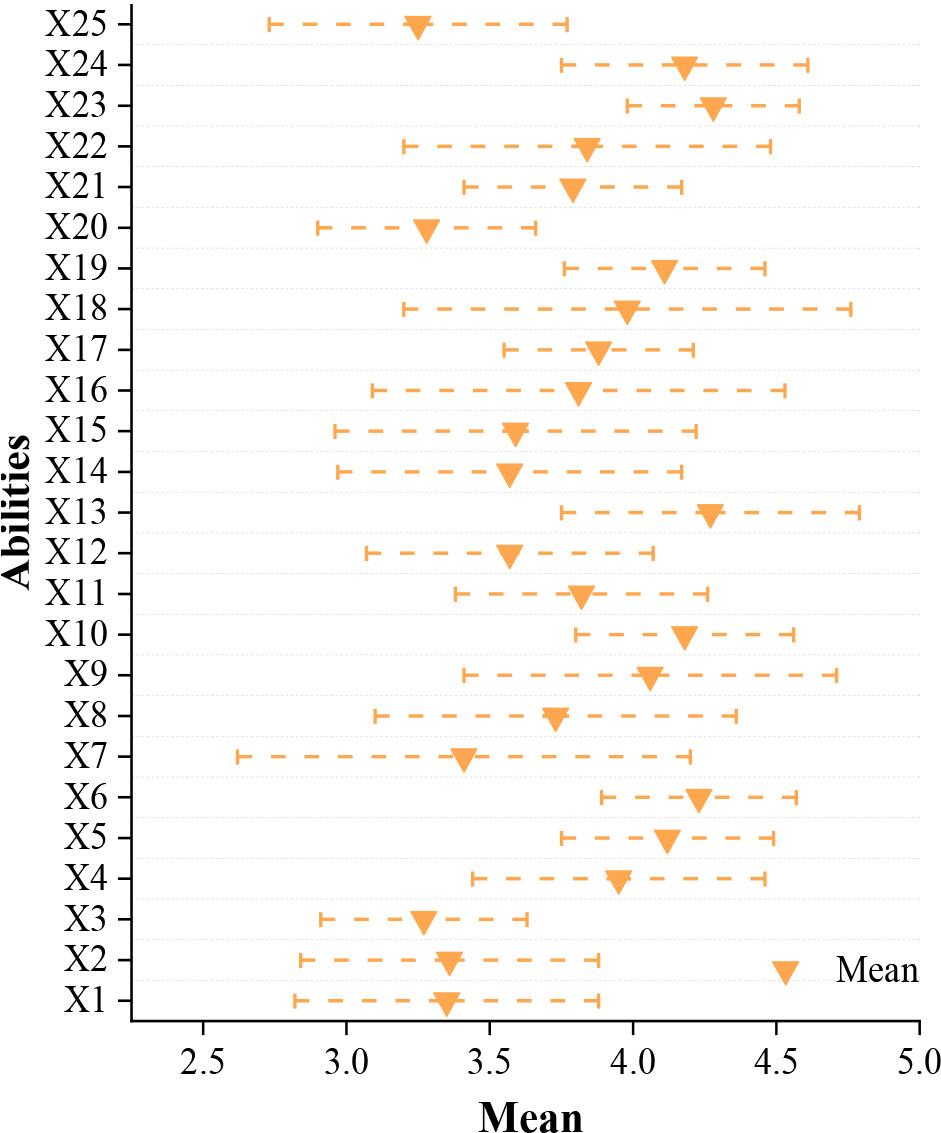
The statistical results of the ability characteristics of the sample teachers
In order to explore the intrinsic structure of these vocational ability characteristic elements, this study adopts principal component analysis to extract the main factors, orthogonal rotation by maximum variance method to extract the factors with initial eigenvalue greater than 1, and the final number of extracted public factors is determined to be 5. The eigenvalues and variance contributions of the public factors are shown in Table 2. The rotated factor structure is effectively simplified: the total variance explained by public factors F1~F5 is 35.1%, 26.4%, 12.5%, 8.4% and 4.3%, and the cumulative variance contribution rate reaches 86.7%.
The eigenvalue and the variance contribution rate of the public factor
| Total variance interpretation | ||||||
|---|---|---|---|---|---|---|
| Module | Initial eigenvalue | Rotational load squared | ||||
| Total | Variance | Cumulation | Total | Variance | Cumulation | |
| 1 | 8.268 | 0.351 | 0.351 | 7.262 | 0.351 | 0.351 |
| 2 | 5.402 | 0.208 | 0.559 | 5.571 | 0.264 | 0.615 |
| 3 | 3.297 | 0.161 | 0.720 | 2.352 | 0.125 | 0.740 |
| 4 | 2.285 | 0.096 | 0.816 | 1.566 | 0.084 | 0.824 |
| 5 | 1.319 | 0.051 | 0.867 | 1.036 | 0.043 | 0.867 |
The factor component matrix reflects the loading of the factor on the original variables, and Table 3 shows the component matrix of the teacher competence factors. In the first factor, information updating ability, educational research ability, social service ability, combination of theory and practice, self-study ability, organization and management ability, and academic communication ability, which are variables mainly reflecting the research and professional development ability of teachers in vocational schools, have high loadings on the first factor (0.798~0.961), and can be named as research and professional development ability.
The component matrix after rotation
| Module | |||||
|---|---|---|---|---|---|
| 1 | 2 | 3 | 4 | 5 | |
| X17 | 0.961 | ||||
| X15 | 0.941 | ||||
| X20 | 0.915 | ||||
| X19 | 0.911 | ||||
| X18 | 0.894 | ||||
| X21 | 0.851 | ||||
| X16 | 0.798 | ||||
| X5 | 0.931 | ||||
| X9 | 0.915 | ||||
| X7 | 0.908 | ||||
| X10 | 0.893 | ||||
| X6 | 0.841 | ||||
| X8 | 0.834 | ||||
| X13 | 0.925 | ||||
| X14 | 0.878 | ||||
| X12 | 0.862 | ||||
| X11 | 0.848 | ||||
| X24 | 0.959 | ||||
| X25 | 0.932 | ||||
| X23 | 0.915 | ||||
| X22 | 0.889 | ||||
| X4 | 0.945 | ||||
| X3 | 0.884 | ||||
| X1 | 0.859 | ||||
| X2 | 0.778 | ||||
The variables of teaching design ability, teaching method ability, teaching management ability, advanced vocational teaching concept, language expression ability, and practical teaching skills have loadings greater than 0.834 on the second factor, which mainly reflect the vocational teaching ability of teachers in vocational schools, and are named as vocational teaching ability. Similarly, the third, fourth and fifth factors were named as professional practice ability, personal traits, and professional quality, respectively.
Based on the results of the above factor analysis, this study divided the 25 teacher competency profile elements into five dimensions, and the total variable scores of the corresponding common factors were obtained based on the mean scores of each element derived from the SPSS descriptive analysis. Finally, the weights of each teacher competency profile element were calculated separately based on the average of the scores of the competency profile elements corresponding to each teacher competency profile element dimension. The weights of the teacher competency profile elements are shown in Table 4. The weights of scientific research and professional development ability, personal attributes, vocational teaching ability, professional quality and professional practice ability are 19.98%, 20.56%, 20.93%, 18.39% and 20.14%, respectively, of which the vocational teaching ability has the greatest influence on the improvement of teachers’ competence in vocational schools.
The weight of the characteristics of teachers’ ability
| Elements | Number | Variable score | Factor score | Weights /% | Ranking |
|---|---|---|---|---|---|
| Research and career development ability | 7 | 26.44 | 3.78 | 19.98% | 4 |
| Personal trait | 4 | 15.55 | 3.89 | 20.56% | 2 |
| Vocational teaching ability | 6 | 23.73 | 3.96 | 20.93% | 1 |
| Professional quality | 4 | 13.93 | 3.48 | 18.39% | 5 |
| Professional practice | 4 | 15.23 | 3.81 | 20.14% | 3 |
Through the above analysis to complete the construction of the model of teachers’ competence in vocational schools, based on the summarized characteristic elements of teachers’ competence, integrating intelligent technology to explore the path of teachers’ vocational competence in the three aspects of professional practice, vocational teaching, scientific research and professional development.
The government and enterprises should play a leading role in establishing a big data platform to monitor teachers’ professional practice ability and provide data support for the assessment of teachers’ ability in vocational education. Artificial intelligence experts should be organized to assess the actual situation of teachers’ competence in vocational colleges and introduce corresponding improvement measures. Schools regularly send professional teachers and backbone teachers to work with employees at the production line of enterprises as a way to understand industry dynamics, collect typical work cases, and improve practical teaching ability. Backbone teachers can also make use of the policies provided by the government and vocational institutions to set up on-campus master teacher studios.
In terms of cultivating and improving teachers’ intelligent vocational teaching ability, vocational colleges and universities should formulate a strategic plan for the in-depth integration of artificial intelligence and vocational education, establish a perfect teacher training system, enrich the opportunities for developing teachers’ professional skills, and urge school teachers to participate in more of such relevant national or provincial training programs. Secondly, strengthen the training of teachers’ information technology skills, and develop a targeted and generalized training program for professional teachers’ information technology skills. Teachers should make use of the dynamic, interactive and multimedia features of “Internet +” to actively participate in the teaching of online courses. In addition, they should combine teaching and research, adopt interdisciplinary teaching methods, and give full play to teachers’ intelligent and innovative abilities.
Firstly, teachers themselves should formulate career development plans to improve their professional abilities and promote professional growth in a timely manner according to the school’s training plan and implementation program. Secondly, teachers can improve their basic teaching skills by observing public classes of experienced teachers or online classes of famous teachers. They can also improve their professional theoretical and practical skills by participating in skills competitions. Finally, teachers should utilize their spare time to expand their knowledge, conduct comprehensive research on teaching theories and educational methods, and enrich their deep understanding of vocational education.
The innovation of digital technology in the intelligent era has promoted the development of vocational education. Based on the integration of intelligent technology, this paper proposes the professional development path of vocational school teachers, and promotes the professional development of teachers in an all-round way by creating an "artificial intelligence + smart teaching field", creating an "artificial intelligence + smart teaching assistant", forming an "artificial intelligence + research community", creating an "artificial intelligence + high-quality resource library" and building an "artificial intelligence + intelligent management system".
Constructing a student classroom emotion recognition model that integrates facial expression and behavioral gesture recognition, and conducting a specific case study. The model is able to effectively recognize students’ emotions at all stages of the classroom, and the sample classroom has the largest proportion of students in neutral (23%) and happy (22%) emotions, and students are in a smooth learning state overall. The four groups found that the students’ learning state varied greatly, and teachers could reflect on and adjust their teaching based on the model’s feedback results on students’ emotions to promote teachers’ professional development and teaching quality.
Through the collection of elements of teacher competence characteristics and questionnaire survey, combined with the factor analysis method to realize the construction of the teacher competence model, the five elements of scientific research and professional development competence (19.98%), personal attributes (20.56%), vocational teaching competence (20.93%), professional qualities (18.39%), and professional practice competence (20.14%) were obtained, with vocational teaching competence having the most obvious impact on teacher competence The influence of enhancement is most obvious.
Vocational education teachers’ professional practice ability should be improved with the help of industrial enterprises, teachers’ intelligent vocational teaching ability should be cultivated, and teachers’ subjective initiative to improve scientific research and professional development should be stimulated, so as to promote the further enhancement of teachers’ ability in vocational schools.