Research on the New Construction Industrialization Platform Based on Computing Technology
Mar 17, 2025

About this article
Published Online: Mar 17, 2025
Received: Oct 14, 2024
Accepted: Feb 02, 2025
DOI: https://doi.org/10.2478/amns-2025-0194
Keywords
© 2025 Zhensen Zhang, published by Sciendo
This work is licensed under the Creative Commons Attribution 4.0 International License.
Figure 1.
Figure 2.
Figure 3.
Figure 4.
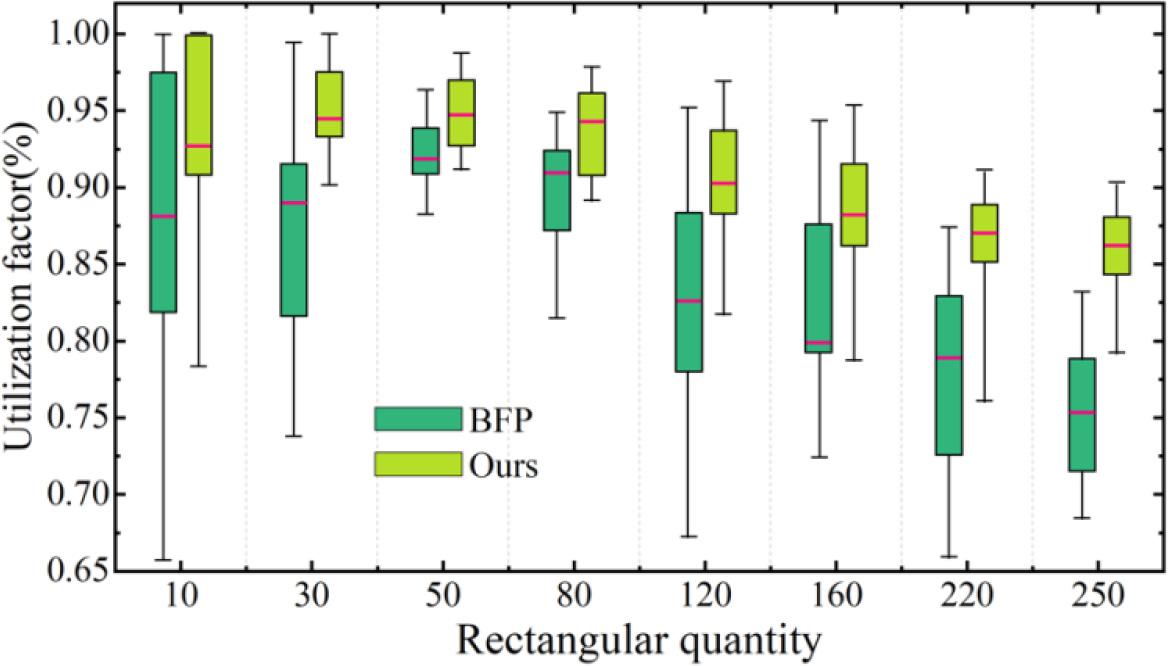
Figure 5.
Figure 6.
Figure 7.
Construction cost management of engineering projects
| Application | Item | Budget cost | Actual cost |
| Personnel management | Norm number | 392417man-hours | 284152man-hours |
| Fixed manual | 82yuan/man-hours | 147yuan/man-hours | |
| Labor budget | 32178194yuan | 42231852 yuan | |
| Material management | Budget reinforcement | 10152t (4000yuan/t) Total:40608000yuan | 9042t (3800yuan/t) Total:34359600yuan |
| Commodity concrete | 46200m3 (420yuan/ m3) Total:19404000yuan | 41250m3 (360yuan/ m3) Total:14850000yuan | |
| Mechanical management | Tower crane | 3360000yuan | Introduce the intelligent and interforce mechanical management and find zero effectively, The fault of the parts, the overall service life of the equipment, the actual cost of the equipment is 8028340 yuan. |
| Pump car | 558000yuan | ||
| Excavator | 8150000yuan | ||
| Other | 803500yuan | ||
| Total Cost | 105061694yuan | 99469792yuan | |
The optimal comparison results of different algorithms
| Algorithm | Utilization ratio (%) | Utilization standard deviation (%) | Schedule time (s) | Schedule time Standard deviation (s) |
| GA | 87.24 | 0.92 | 582.1 | 6.42 |
| TGA | 88.06 | 0.88 | 574.9 | 7.23 |
| TGSA | 89.75 | 0.73 | 579.8 | 8.37 |
| GWO | 90.38 | 0.69 | 552.4 | 9.04 |
| TGWO | 91.24 | 0.54 | 554.3 | 8.45 |
| DSSA | 89.48 | 0.47 | 558.6 | 4.31 |
| TDSSA | 92.51 | 0.51 | 452.4 | 5.26 |
| Ours | 96.79 | 0.48 | 489.5 | 6.18 |
The size and number of rectangular parts
| No | Material | Length/mm | Width/mm | Quantity |
| 1-A1 | Q345B | 880 | 200 | 10 |
| 1-A2 | Q345B | 580 | 500 | 10 |
| 1-A3 | Q345B | 185 | 350 | 10 |
| 2-B1 | Q345B | 250 | 260 | 10 |
| 2-B2 | Q345B | 1200 | 210 | 10 |
| 3-C1 | Q345B | 340 | 790 | 10 |
| 3-C2 | Q345B | 120 | 215 | 10 |
| 4-D1 | Q345B | 450 | 235 | 10 |
| 4-D2 | Q345B | 1000 | 565 | 10 |
| 4-D3 | Q345B | 400 | 180 | 10 |
| 5-E1 | Q345B | 180 | 340 | 10 |
| 5-E2 | Q345B | 830 | 420 | 10 |
Performance comparison of two algorithms
| No. | Average | Worst | Best | STD. | Time(ms) | |||||
| BFP | Ours | BFP | Ours | BFP | Ours | BFP | Ours | BFP | Ours | |
| 10 | 0.879 | 0.563 | 1.000 | 0.095 | 2.48 | |||||
| 30 | 0.883 | 0.689 | 0.985 | 0.043 | 4.24 | |||||
| 50 | 0.918 | 0.672 | 0.973 | 0.031 | 7.51 | |||||
| 80 | 0.906 | 0.661 | 0.972 | 0.065 | 9.65 | |||||
| 120 | 0.823 | 0.623 | 0.959 | 0.073 | 13.37 | |||||
| 160 | 0.807 | 0.635 | 0.931 | 0.066 | 18.73 | |||||
| 220 | 0.792 | 0.628 | 0.971 | 0.065 | 42.19 | |||||
| 250 | 0.776 | 0.631 | 0.969 | 0.082 | 103.26 | |||||
| Means | 0.848 | 0.638 | 0.970 | 0.065 | 25.18 | |||||