A Secure Access Approach to English Language Education Networks for Edge Computing

Published Online: Mar 17, 2025
Received: Oct 27, 2024
Accepted: Feb 08, 2025
DOI: https://doi.org/10.2478/amns-2025-0193
Keywords
© 2025 Lili Jin et al., published by Sciendo
This work is licensed under the Creative Commons Attribution 4.0 International License.
With the increasing popularity of IoT technology, more and more devices in English education are connected to the Internet, creating a huge amount of data. However, these devices face great challenges in security and communication quality because they generally run in an edge system with low power consumption and low computing power. In order to ensure the security and performance of the edge computing system, it is necessary to establish a complete set of network security protocols [1-4].
Edge computing technology is an emerging computing paradigm that provides faster and more reliable data transmission and processing capabilities by processing data in a location closer to the user’s device. In English education, the application of edge computing technology is gradually showing great potential, providing more possibilities and convenience for the English education process [5-8]. In the process of English education, edge computing technology can provide a more stable and efficient network connection, achieve personalised English education, and promote the development of education informatisation. However, the application of edge computing technology in English education also faces some challenges. The first one is the network security problem [9-12]. Due to the wide distribution of edge computing devices, educational institutions need to strengthen the security protection of edge devices to prevent the leakage of students’ personal information and the loss of educational data due to attacks on the devices. Second is the complexity of device management and maintenance [13-16]. Large-scale deployment of edge devices requires device management, software updates and troubleshooting, which puts high demands on the technical support capabilities of educational institutions [17-18].
This paper proposes an incremental traffic feature extraction strategy based on statistics, which meets the requirements for feature extraction in real-time English education network security environments.Meanwhile, the final feature vector is simplified through feature analysis and cropping so that it can accurately reflect the real network behavior and improve the detection rate and accuracy of network intrusion.Based on this, we are studying the security construction of edge computing network resources using NFV, and establishing a DHR security model using the architectural characteristics of the edge computing network itself. At the same time, it was subjected to utility verification and failure rate analysis to prove its usability and test its supportive role in English education network security.
The main problem of feature extraction is to extract the data reflecting the traffic characteristics from the traffic data without doing a specific analysis of the traffic load. The feature extraction strategy proposed in this paper is inspired by existing research and proposes an incremental traffic feature statistics strategy based on statistical data.
Currently, there are two main ideas for device-specific network traffic feature extraction:
Time-based: out of the assumption that network behaviours have a strong correlation in time, statistics of the current connection and the connection records in a previous period (e.g., 2s) are counted.
Connection-based: when the temporal correlation of network behaviours is weak, the data of the current connection and a certain number of previous connection records are counted.
The time-based feature extraction technique involves aggregating the same hosts and services within a certain time frame and then counting them. The main problem of this method is that if the intruder adopts the means of delay attack, that is, adding a random time delay between two consecutive connections, then the statistics will be invalid, and anomalies cannot be detected. Therefore, in this paper, we use connection-based feature extraction to avoid the effect of delay between neighbouring connections by counting the feature data in the nearest
In the real-time environment of English education, where the network packet circulation rate is high, the statistics of the NSL-KDD dataset become more complex to meet the real-time requirements. Thus, the key issue for traffic feature extraction is how to ensure that the algorithm for counting each feature is lightweight. In order to solve this problem, this paper proposes an incremental statistical method: for a specific device, in order to statistic feature
The standard deviation is calculated incrementally. Whenever a new record is generated, the sample variance needs to be recalculated. The incremental calculation can avoid the repeated reading and calculation of all previous records, significantly reducing the memory occupation and computational resources and improving the performance of the system in a real-time network environment. In the actual English education network environment, there is no need to really calculate the mean and standard deviation, but only need to record
Initial feature vectors
Reducing the dimension of the feature vector can significantly reduce the system’s demand for computational resources, including smaller data storage and faster data processing. To this end, this paper investigates the network traffic features to determine the extent of their contribution to intrusion detection for feature selection, which in turn reduces the number of features, improves the efficiency of the clustering model, and reduces resource usage.
In this paper, we first plot the cumulative distribution function (CDF) for each feature to study its differences, which mathematically means the integral of the probability density function, which can completely represent the probability distribution of a random variable. The distribution of the number of unique destination IPs contacted by devices in the network is not Gaussian but heavy-tailed, with observations growing very slightly in the tails of the function. The distribution indicates that more than 70% of the devices are connected to less than 20 unique destination IPs. On the other hand, the tails of the distribution indicate that, in some cases, a device may be connected to more than 500 destination IPs. Similarly, more than 75% of the devices do not generate traffic related to the SSH service, whereas some of the devices generate a large number of them, suggesting that there is a suspicious node in the network.
Thus, data points distributed at the tail of the function have a greater impact on intrusion detection. In classification or clustering, it is important to capture data that can differentiate between anomalous and normal traffic.
Studies on the distribution of eigenvalues have also revealed significant correlations between different features. For example, the number of connections initiated by the attacker and the number of connections between the target devices grows synchronously as the attacker scans the nodes. These facilitate the discovery and removal of redundant information from the features.
This paper utilizes the correlated feature selection technique (CFS) and variance selection method to identify and eliminate features that are not crucial for intrusion detection.
The main principle of CFS is to calculate the linear correlation of each feature. The correlation is calculated using the Pearson correlation coefficient, whose value ranges from [–1,+1], with positive values representing correlation, negative values representing negative correlation, and
The main idea of the variance selection method is to remove features with low variance. That is, if a feature has a low variance in all the input data, it means that the feature does not vary much in the sample as a whole and thus is not very useful for the ding clustering task.
To ensure that there are no overly biased features, all feature values are normalised to [0,1] during clustering. The variance of each normalized feature in each cluster is calculated after clustering using variance selection. If the variance of a feature is the same across clusters (within a certain range), the feature is judged to contribute less to the clustering process, and then it is removed from the final feature vector (e.g., REJ error).
With the above two feature tailoring methods, 15 statistics are selected as the final features of this paper due to their strong linear robustness and strong contribution to the clustering process (higher variance). Statistics of each feature in the first 100 connections and with the same target host connection as the current connection are counted, and three statistics for each feature
Anomaly detection is based on the extracted feature values for intrusion detection judgment and classification. This paper adopts the rule-matching method [19]. Firstly, rule matching is carried out on the feature values collected above. The known attack methods and abnormal behaviors can be effectively discovered by screening and classifying the data through the pre-set rule base.After the rule matching is completed, the unmatched data are statistically analyzed.The purpose of statistical analysis is to discover potential abnormal behaviors and unknown attack methods by analyzing the quantity, frequency, and other characteristics of the data. Statistical analysis can identify new types of attacks and anomalies that cannot be identified by rule matching. Therefore, by combining rule matching with statistical analysis, both known abnormal behaviors and potential unknown attacks can be effectively detected, thus improving the security and stability of the system. After completing the anomaly detection, the final intrusion detection result is generated by combining the rule-matching results and statistical analysis results. With the intrusion detection results, the system will be based on the specific means of attack, the first time the intrusion response processing, to ensure that the alarm information is transmitted to the network administrator in a timely manner.
This section is dedicated to providing a mobile edge computing network security solution based on NFV technology [20], which tackles the English education network security problem by exploiting security endogenous to the edge computing network’s architecture intrinsic security functions and attributes.
This paper proposes a security framework for edge computing network with NFV technology based on the ETSI Recommended Architecture by designing network function modules endogenous to the edge system to complete the required security functions based on a dynamic trust mechanism through dynamic scheduling of mobile edge applications aimed at maintaining secure services in the edge computing network during a preset update cycle. Said security framework comprises a mobile edge host, a mobile edge manager, a mobile edge orchestrator, an operations support platform, and a mobile edge user terminal.
The operation support platform comprises a security detection module responsible for user-oriented access and service scheduling of the mobile edge system. Specifically, it is used to obtain an application access request from the mobile edge user terminal, including a service model of a pending computation task, a security level of a mobile edge application required for the pending computation task, and a computational resource required for the pending computation task, and perform security detection of the application access request. In addition, the operation support platform will determine whether the user is in the preset blackmail user database based on the identification of said user.
In every predetermined update cycle, the staff performs overall service maintenance and updates to the edge system. The security level of the aforesaid mobile edge application is dynamically updated within the range of the preset update cycle based on the mobile edge trust list as well as the application service records, namely:
In addition, this section presets four-time cycles for each edge service within a preset update cycle.
In the preset first time cycle, the operation support platform obtains the computing task information of each user from the mobile edge user side, obtains computing task features by performing feature extraction on the computing task information, matches the computing task features with the preset first behavioural features, identifies a suspicious computing task, marks the user to which the suspicious computing task belongs as a suspicious user, and monitors the computing task of the suspicious user.
On the basis of the above security framework, this section designs an endogenous security scheme that meets the differentiated security needs of users, which is shown in FIG. 1, wherein when the user terminal application sends a service request to the operation support platform, it begins to execute the mobile edge security process. Among them, the user terminal application’s computing task includes two service mode requests including performance priority mode and security priority mode, and the operation support platform receives the service request from the user terminal application.
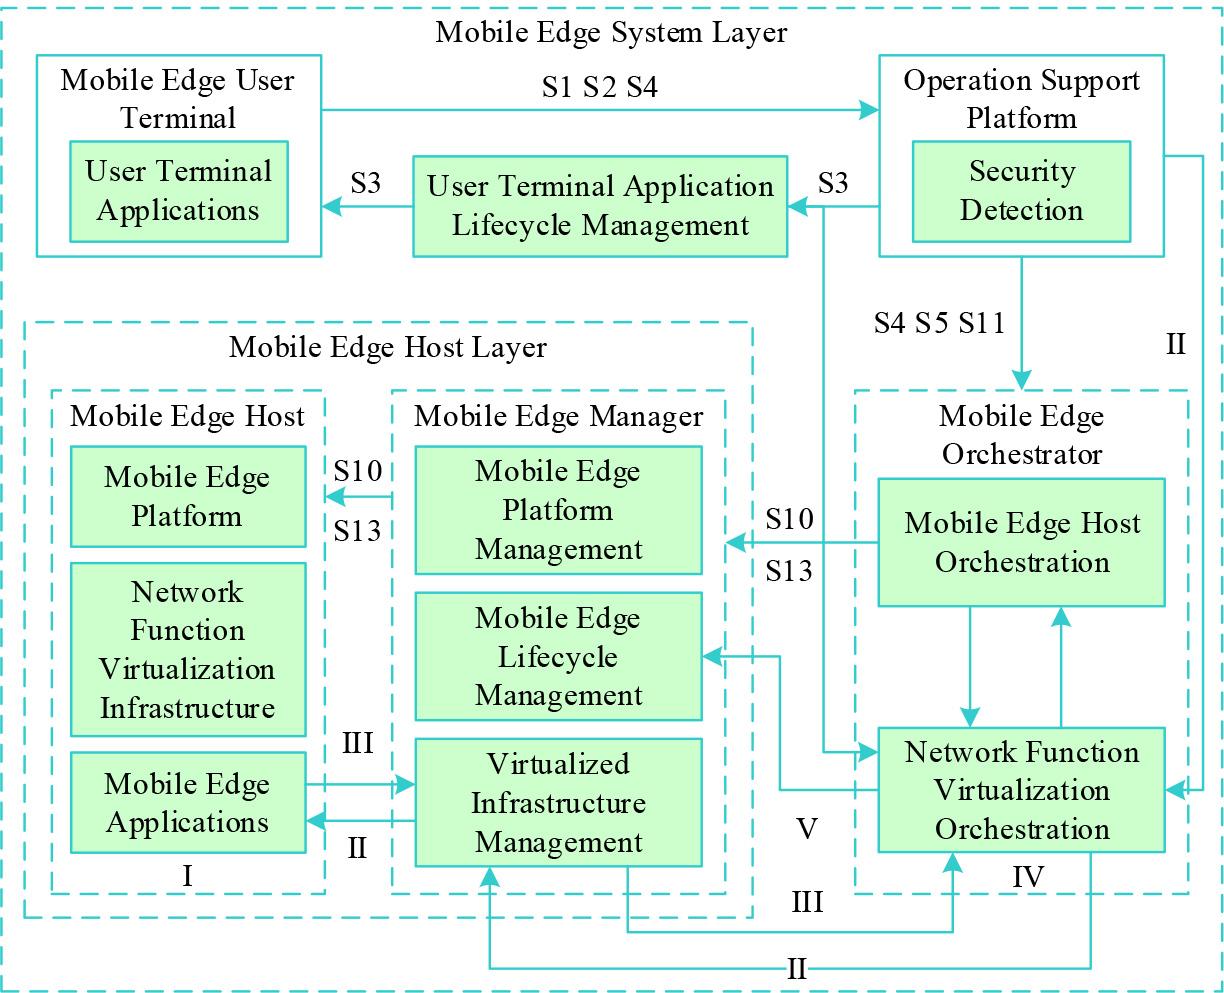
The endogenous safety scheme of network is calculated based on NFV
In order to gain a deeper understanding of how the key features in the endogenous security scheme based on dynamic heterogeneous redundant constructs affect the security of the edge computing network, this paper establishes a security model of dynamic heterogeneous redundant constructs of the edge computing network for edge computing network services and conducts a security analysis of the states of different components in it after modelling.
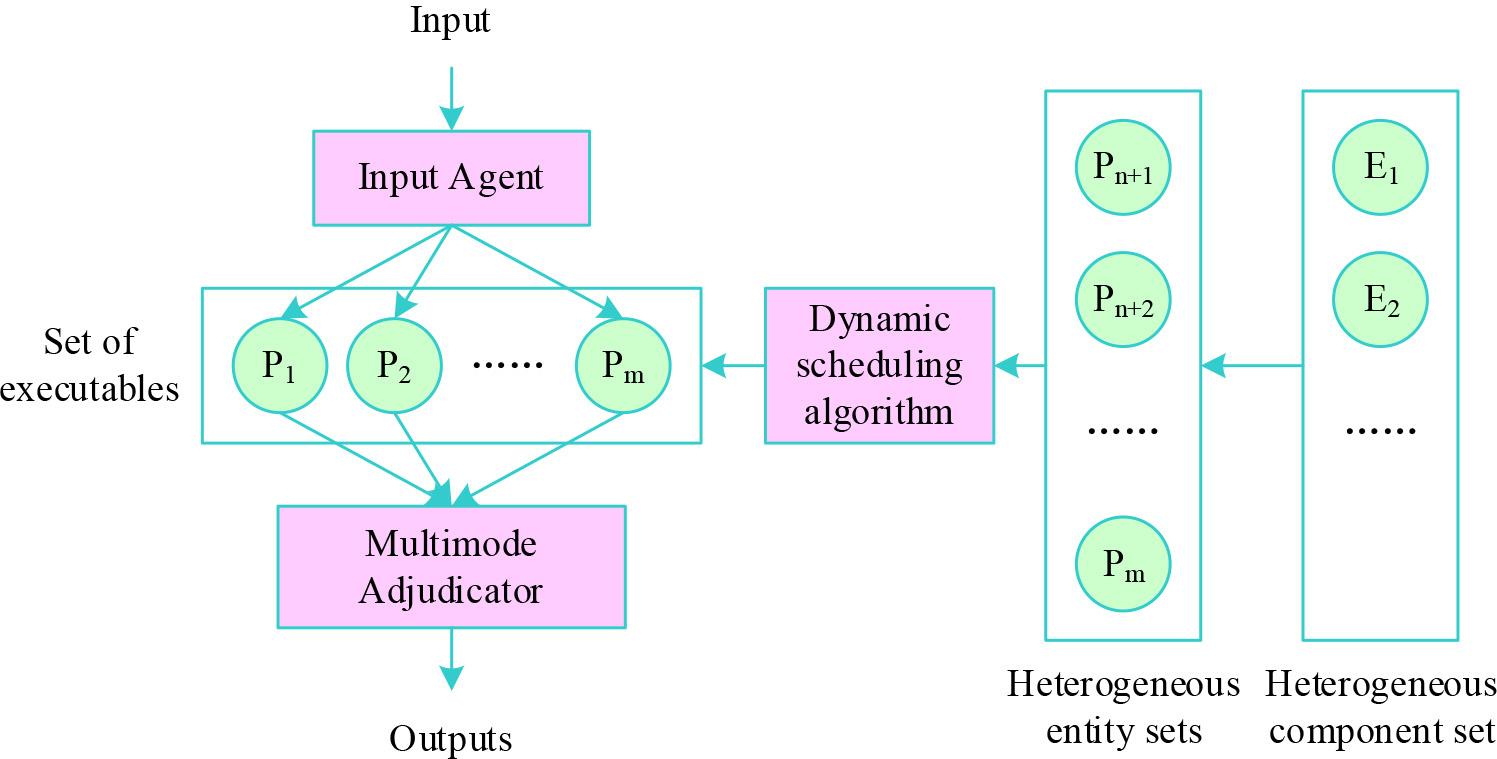
The Input, Processing, Output (IPO) model is the basis of the mimetic defense technique [21]. When an input enters the IPO model, the input agent first replicates and distributes
DHR model
Based on the DHR model, a security model for edge computing network is constructed, where the input data source is the computational task data required by the edge service, the functions of input agent replication and distribution are performed by the network function virtualisation orchestration module as described in the previous section, the virtualisation infrastructure management module acts as a multimodal adjudicator as well as being responsible for checksum filling of the distributed data, and finally the network function virtualisation orchestration module is responsible for the dynamic scheduling of heterogeneous entities.
Assume that in a penetration attack against vulnerability
In a DHR security model where the execution set contains
From 0≤
The above analysis shows that the DHR-based security defence model can effectively reduce the success probability of penetration attacks against vulnerabilities on English education networks. The English education network environment and operation mechanism are strongly correlated with the success rate of cyber attacks. In the DHR security model, the cyber attacks face the difficulty of synergised attacks on heterogeneous multiple dynamic targets under non-cooperative conditions Attack chain is very fragile. The dynamic changes in the English education network infrastructure and operation mechanism will disrupt the temporal and spatial consistency performance of the results of the synergised attacks. The successful completion of the attack chain will become a small probability event or a non-deterministic event.
In the DHR security model, each functionally equivalent heterogeneous executor may have indeterminate vulnerabilities and backdoors, but the heterogeneous design is likely to make these vulnerabilities and backdoors different. Theoretically, by ensuring heterogeneity and independence, i.e., the absence of correlation and synergy, between executables, it will be difficult for an attacker to act on most executables at the same time to produce exactly the same anomalous outputs, and make the system’s defences fail. The attack action that causes this defence failure is called attack escape, and the escape probability is used as a measure of system security, based on a simplified model to derive the approximate steady-state escape probability of a heterogeneous redundant system with redundancy of 3 as time tends to infinity:
In this paper, the UNSW-NB15 dataset and the CICIDS2017 dataset are used as the simulation experimental data, and the training set and test set are divided in the ratio of 7:3, and the data distribution is shown in Table 1. Both contain new types of network attacks, e.g., backdoors, worms, etc., so they can better reflect the current network intrusion behaviour patterns. The benchmark dataset is described as follows.
Data distribution
| Data set | Type | Training set | Test set |
|---|---|---|---|
| UNSW-NB15 | Analysis | 1754 | 1105 |
| Backdoors | 1258 | 1057 | |
| Do S | 8359 | 7546 | |
| Exploits | 25486 | 18934 | |
| Fuzzers | 14562 | 12548 | |
| Generic | 113598 | 105365 | |
| Normal | 1608413 | 1245339 | |
| Reconnaissance | 7618 | 4586 | |
| Shellcode | 847 | 754 | |
| Worms | 126 | 95 | |
| CICIDS2017 | Benign | 1054921 | 1014532 |
| Botnet | 1548 | 1254 | |
| Brute Force | 11693 | 10258 | |
| DDoS | 105486 | 84521 | |
| DoS | 122846 | 102546 | |
| Port Scan | 102935 | 95125 | |
| Web Attack | 1058 | 1254 |
In order to verify the effectiveness of the intrusion detection method based on traffic feature extraction, this paper compares different intrusion detection methods with the intrusion detection method based on traffic feature extraction. Figures 3 and 4 show the comparison of the intrusion detection methods based on the K-means algorithm, based on the graph neural network, and based on the SVM with the method of this paper for the training and validation of the UNSW-NB15 and the CICIDS 2017 datasets, respectively. Comparison of loss rates during the process. It can be seen that the loss rate of the intrusion detection method based on traffic feature extraction is reduced during the training process compared with the remaining three methods, and reaches a minimum of 0.29. It has a faster convergence speed. It can be seen that the intrusion detection method based on traffic feature extraction effectively solves the problem of error-prone detection, and the model is easier to optimize and converge, resulting in better performance.
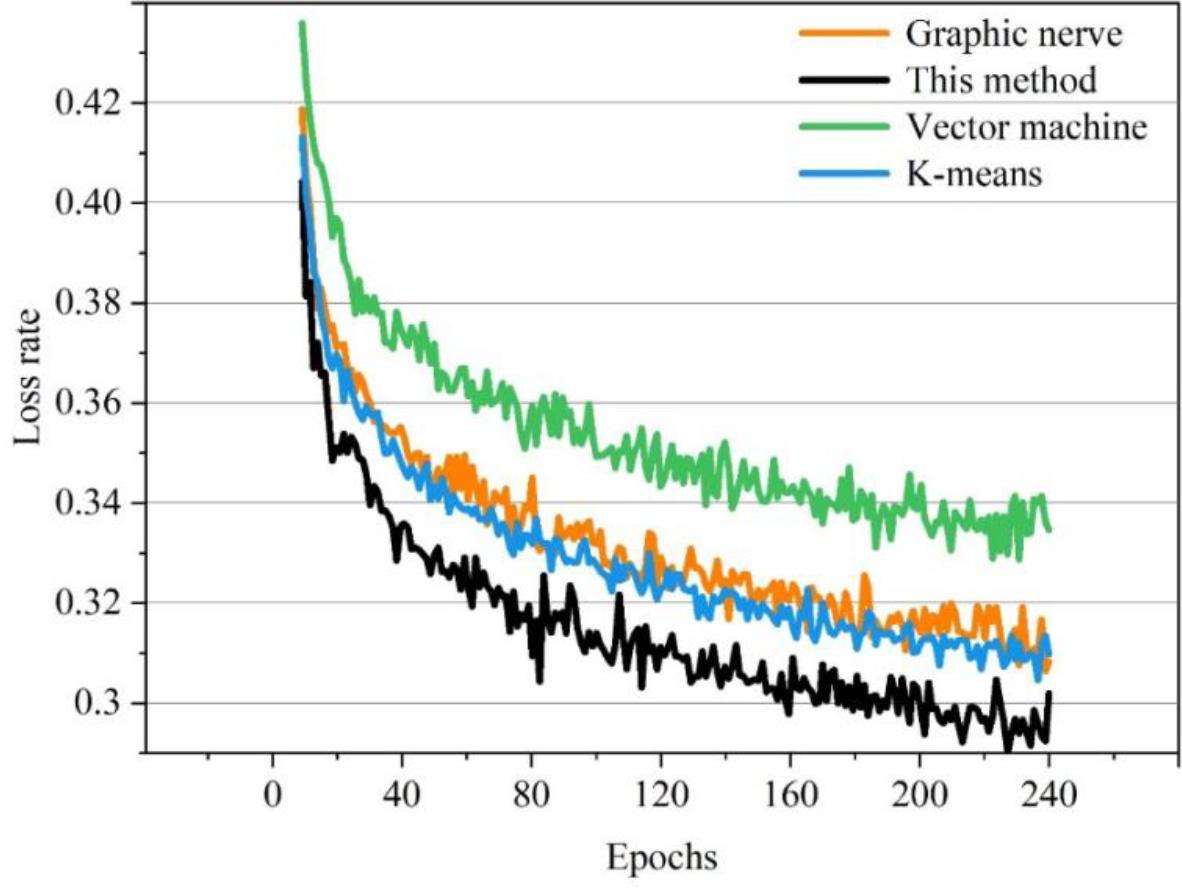
The loss rate of the UNSW-NB15 data set is compared
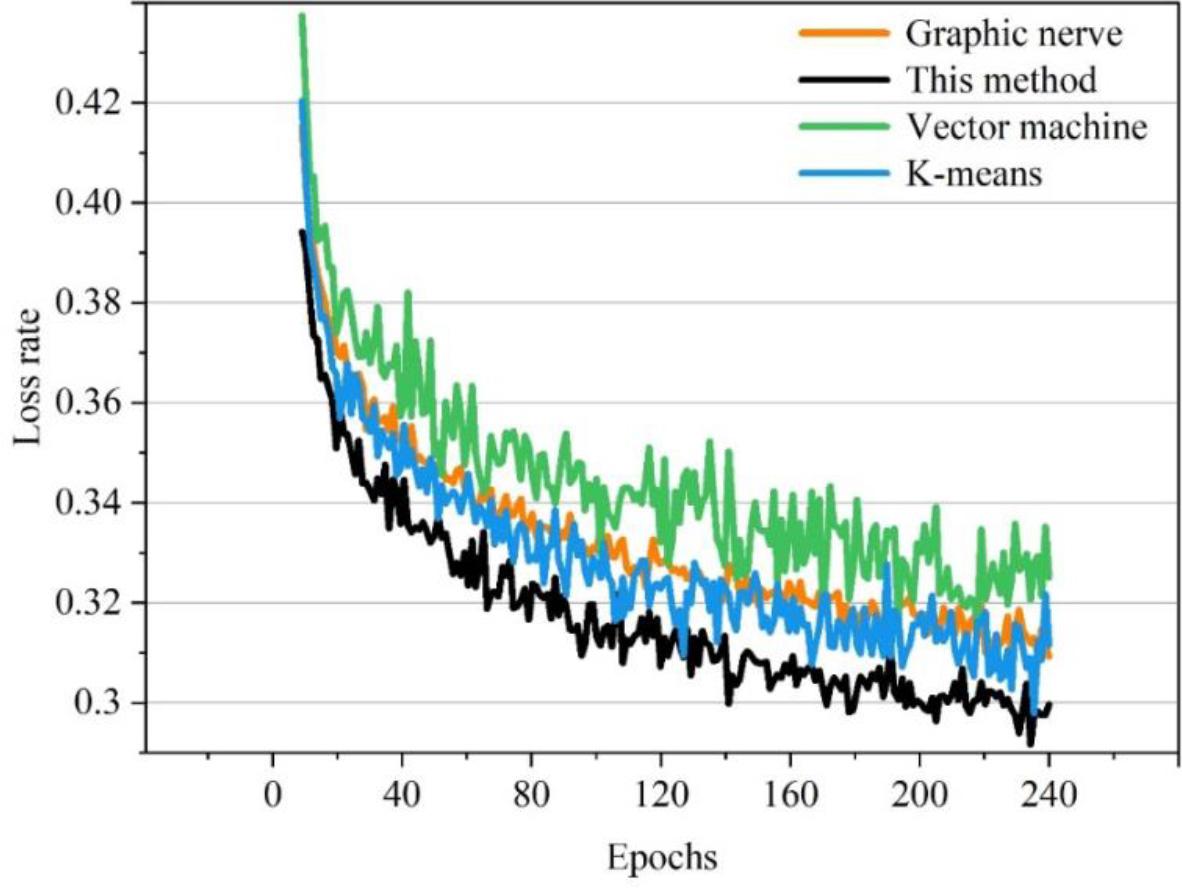
The loss rate of the CICIDS2017 data set is compared
Figure 5 shows the intrusion detection time statistics of the four methods, and the serial numbers 1-4 on the x-axis refer to this paper’s method, the K-means algorithm, the graph neural network-based and the SVM-based intrusion detection methods, respectively. Through observation, it can be seen that this paper spends less time on intrusion detection; when the amount of English education text reaches 400, the time spent is 3.25s, which is much lower than the other several detection methods. Thus, it is evident that the algorithm presented in this paper is superior. The rule-matching speed of this paper’s algorithm has a certain improvement in efficiency over other algorithmic detection methods, which indicates that the proposed algorithm is successful and will be helpful for the future development of intrusion detection methods.
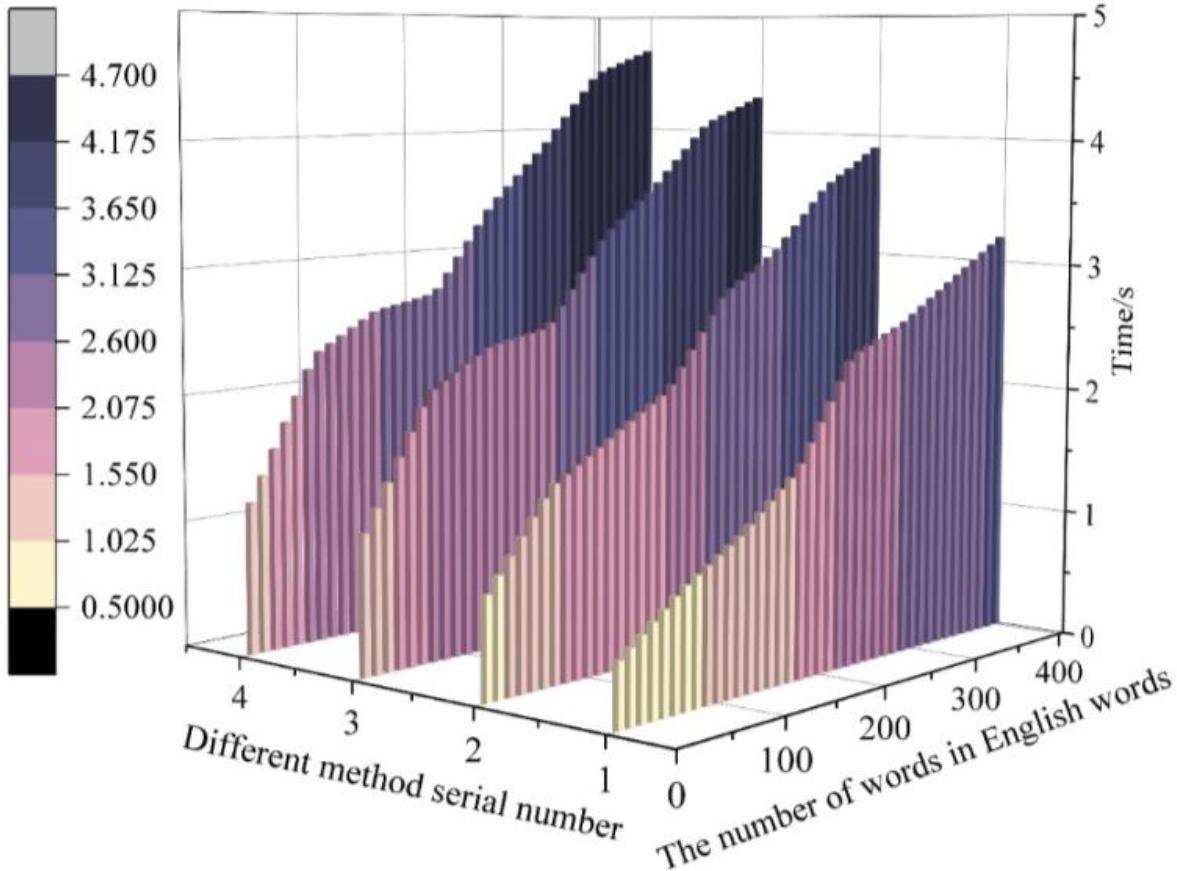
Four methods of consuming time contrast
When the actuators in the cybersecurity scheme lose their original functions, we believe that the protection ability of the DHR-based edge computing cybersecurity scheme decreases significantly and the security risk increases. At this stage, the commonly used scheduling algorithms for actuators in DHR-based edge computing network security schemes are dominated by the random scheduling Random algorithm, which has good randomness and is not easy for attackers to penetrate the laws. Common scheduling strategies for dynamically selecting executives up and down the line include the FAWA algorithm, which uses historical information as the basis for scheduling, and the algorithm that combines heterogeneity with historical information, etc. The FAWA algorithm dynamically schedules executives using feedback information from historical attacks, which improves their defensive capability, but it does not take into account the similarity between executives.The H2 algorithm innovates by combining heterogeneity with historical information, which improves the dynamics and reduces covariance.Dynamics reduces the probability of common-mode vulnerabilities, although its focus is on improving the adjudication algorithm. Therefore, in order to verify the security reliability of this paper’s DHR-based network security scheme for edge computing, this section sets up comparative experiments of Random, FAWA, and H2 algorithms to analyse the failure of different algorithms that are in the same environment. Therefore, this chapter uses the ratio of the area of the actuator common-mode vulnerability to the area of all vulnerabilities in the working set to represent the system failure rate to reflect the security and reliability performance of the system from the side. The attacker’s attack behaviour and the attack means used have randomness. If an attack method can lead to more than half of the function failure of the executables that are working, it is judged that the original function of the proposed system fails, has been breached, and is in the failure state. In this paper, simulation experiments are conducted using MATLAB.First, the similarity matrix of the component set of each functional module is randomly generated, and the types and numbers of vulnerabilities are randomly selected. Subsequently, random simulation experiments are conducted through the Monte Carlo method, and the performance of the randomly generated executables is shown in Table 2. Table 2 shows the seven randomly generated executables generated using MATLAB simulation and their performance in the last five cycles.The numbers in the first and second columns of the table are only numbers and do not have arithmetic functions such as addition, subtraction, multiplication, and division.Each of the seven executables contains a different type and number of vulnerabilities, and some of the executables contain several homologous vulnerabilities.MATLAB is used to simulate an attack against a specific vulnerability.
Random generated execution body
| Execution number | Loophole | The current situation of the five periodic tables |
|---|---|---|
| 1 | 1, 4, 5, 6, 7 | [0 1 0 0 0] |
| 2 | 2, 4, 6, 15 | [0 0 0 1 1] |
| 3 | 4, 7, 9, 11, 13 | [0 1 1 0 0] |
| 4 | 8, 5, 6, 12, 16 | [0 0 0 0 1] |
| 5 | 14, 15, 16 | [0 0 0 1 0] |
| 6 | 17, 18, 19 | [0 0 1 0 0] |
| 7 | 17, 10, 11 | [0 0 0 1 0] |
The combined score of each executable calculated using the Random algorithm in this paper is shown in Table 3. When an attacker successfully uses a certain number of vulnerabilities to launch an attack, it will cause the output of the executables containing this vulnerability to show abnormalities. As shown in Table 3, the attacker chooses vulnerability No. 17 to launch an attack, and the executables containing vulnerabilities No. 17, No. 6 and No. 7 will show anomalies in the arithmetic results. Subsequently, the anomaly information is fed back to the scheduling module, and the scheduler timely changes the work performance values of executives 6 and 7 according to the scheduling policy, which changes the composite anomaly value of the anomalous executives and in this way, it reduces the ranking of the executives under attack in the set to be selected. Finally, the scheduler makes the anomalous executives go offline temporarily for cleaning, which circumvents the problem of system failure due to continuous attacks, improves the security and reliability of the system, and ensures the security of network access for English education.
This article is part of the safety plan
| No.1 | No.2 | No.3 | No.4 | No.5 | No.6 | No.7 | |
|---|---|---|---|---|---|---|---|
| Comprehensive score | 8.5 | 3.38 | 7.4 | 8.4 | 3.5 | 3.97 | 2.8 |
| Attack no. 2 after the total score | 8.5 | 7.56 | 7.4 | 8.46 | 3.4 | 3.8 | 2.7 |
| Attack no. 13 after the total score | 8.2 | 3.35 | 2.56 | 8.44 | 3.56 | 3.78 | 2.69 |
| Attack no. 14 after the total score | 8.12 | 3.46 | 7.14 | 8.41 | 9.46 | 3.45 | 2.94 |
| Attack no. 17 after the total score | 8.16 | 3.41 | 7.45 | 8.28 | 3.59 | 9.46 | 10.24 |
Further, assuming that there are a total of seven executors to be selected in the executor set, and the scheduler selects five executors into the running pool to participate in the work each time, after the same work of 800 scheduling cycles, the average system failure rates of Random, FAWA and H2 algorithms are shown in Fig. 6. As can be seen from Fig. 6, FAWA and H2 methods maintain a lower failure rate to a certain extent, showing a certain degree of dynamics and security of the algorithms, but in most scenarios, their failure rates are still higher than that of the Random method of this paper. 800 experimental cycles, the failure rate of the Random method of this paper is always maintained at 0.52 or less, and at the same time, the overall failure rate is lower than that of the other algorithms that show higher security. Therefore, the likelihood of similar vulnerabilities or defects in English education network security being exploited by attackers will be much lower than that of systems using several other algorithms in the DHR-based edge computing network security scheme using the Random method as the scheduling policy, which well ensures the security of the English education network, and indicates that the access method designed in this paper for the security of the English education network is effective.
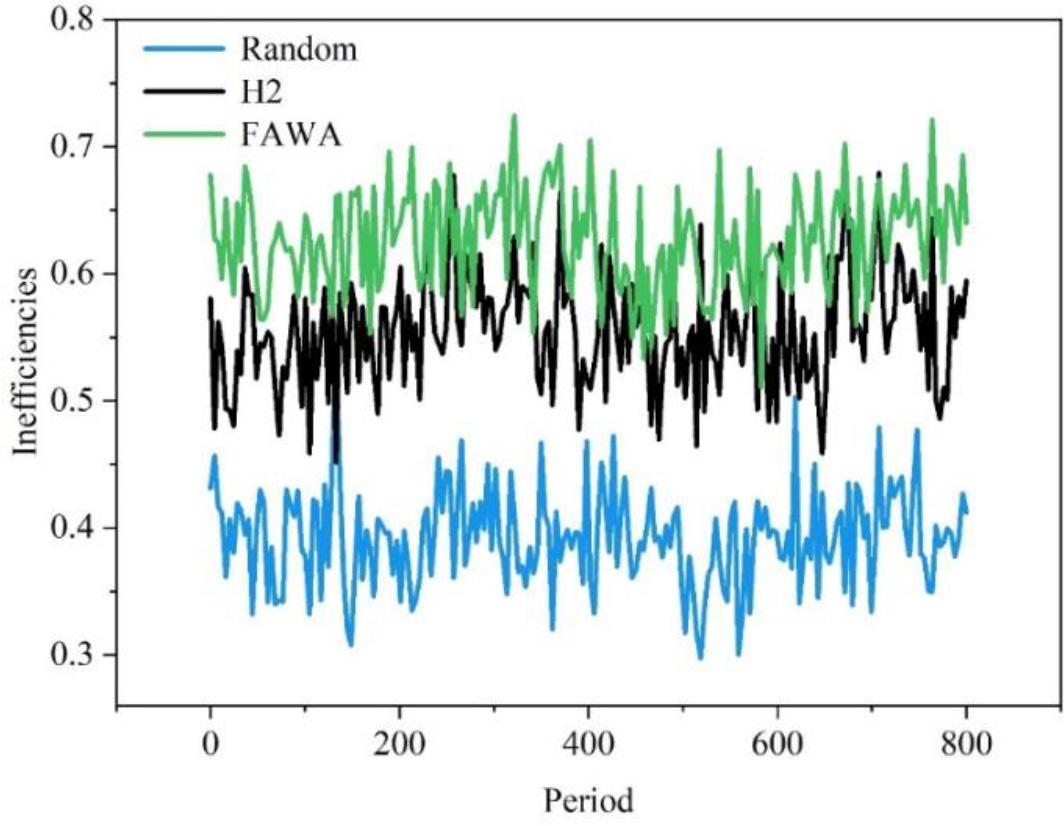
The efficiency of each algorithm
Nowadays, English education network security faces security risks such as unauthorised access, sensitive data leakage, and cyber-attacks. In order to solve this problem, the article proposes a mobile edge computing network security protection scheme.
The intrusion detection method based on traffic feature extraction reduces the loss rate in the training process compared with the remaining three methods, with a minimum of only 0.29. The intrusion detection method that uses traffic feature extraction takes less time to detect intrusions, only 3.25s when the text volume is 400, which is much less than the other detection methods. It can be seen that the algorithm in this paper has a superior performance in terms of loss rate and time spent. It shows that the proposed algorithm of intrusion detection method based on traffic feature extraction is successful and inspires the future development of intrusion detection methods.
When an attacker launches an attack, the Random algorithm used in this paper’s scheme feeds the abnormal information to the scheduling module, thus reducing the ranking of the executives suffering from the attack in the to-be-selected set, avoiding the problem of system failure due to the sustained attack, and improving the security and reliability of the system. The Random method of this paper ensures that the failure rate of the security scheme of this paper always maintains below 0.52, which shows high security and ensures secure access to the English education network.