A study of the techniques used in film narratives to show characters’ inner conflicts and social contexts through the spatial layout of housing spaces

Published Online: Mar 17, 2025
Received: Oct 09, 2024
Accepted: Feb 05, 2025
DOI: https://doi.org/10.2478/amns-2025-0175
Keywords
© 2025 Xuanyu Yu, published by Sciendo
This work is licensed under the Creative Commons Attribution 4.0 International License.
In recent years, with the discursive shift around space in Chinese film studies, the material attributes and media representations of film have been widely emphasized, and narratology has provided an ambiguous impetus for the discussion of film space [1-2]. The way space unfolds is narrative, and film narrative, as a way to express experience and represent reality, is a response to and is affected by different spatial organizations, and its completion depends on the generation of spatial-temporal relations in the film plot [3-5]. In order to motivate the audience to achieve an immersive experience during the viewing process, movies need to carefully construct narrative space as a way to attract the audience’s attention and make them actively participate in the movie plot.
The spatial layout of housing in a movie is a concrete embodiment of a person’s or a group’s way of life, aesthetic ability, culture and art, and also reflects people’s inner desire and pursuit [6-7]. The size of props in the spatial layout is the same as the size of interior decoration furniture in real life, and multiple props and furniture form a complete environment, which can effectively show the identity and character of the main character [8-11]. In addition, the creation of contemporary film art through continuous innovation of interior props, examining the architectural decorative features of the social background of the film and striving to accurately restore the decorative styles of the buildings of the era in which the film was made, reflecting the real appearance of different eras, and bringing the moviegoer back to that era [12-15]. In short, in the future design of movie space layout, there will also still appear a large number of elements similar to real-life interior decoration, which will bring more visual impact and aesthetic enjoyment to people through continuous exploration and courageous attempts [16-17].
In this paper, through the case study of the spatial layout of housing and the characters’ inner conflict and social background in three movies, namely, Family Friends, Big Star and Hand of God, we initially explain the techniques of displaying the characters’ inner conflict and social background in the movie narratives. Based on the spatial narrative theory and film narrative theory, as well as research results in various fields, the research model of this paper is composed of a housing space layout feature extraction algorithm and correlation analysis. The video images of housing spatial layout in film narrative are collected and chunked, the dynamic features of housing spatial layout video images are extracted by the method of similarity measure, and the detection of edge features of housing spatial layout video is pushed forward by combining the method of automatic fusion matching and the method of single-frame visual aberration analysis. An evolutionary deep learning algorithm is introduced to control the convergence of the extracted edge parameters of housing spatial layout, so as to achieve the comprehensive extraction of housing spatial layout features.Information such as characters’ inner conflicts and social backgrounds is collected through text analysis and visual analysis, and the textual information is transformed into quantitative data required for the study by coding. Based on the calculation results of Pearson’s correlation coefficient between housing space layout and character’s inner conflict and social background, the correlation analysis between housing space layout and character’s inner conflict and housing space layout and social background is carried out, respectively. Based on the results of the modeling experiments, it is argued that adopting a housing space layout reflects the characters’ inner conflicts and social backgrounds in the movie narrative.
As the basic space of human life, the spatial layout of housing carries profound social and cultural significance, as well as affecting the characters’ inner emotions.In this study, three classic films, Family Friends, Big Star, and Hand of God, are selected as cases for analysis, which are unique and representative in their narrative style, thematic content, and spatial layout of housing.The analysis methods of the case study mainly include textual interpretation, visual analysis, and psychological analysis.Through detailed observation and interpretation of the spatial layout of housing in the films, the case studies are analysed and interpreted in depth with the relevant theoretical framework.
In the film Family Friends, despite the fact that Jeremiah has amassed a huge fortune through his immoral money-lending practices, he lives in a shabby, dirty, dark, humble flat, a living environment that visually reflects the character of Jeremiah’s inner world. The dilapidation and filthiness of the room contrast with the miserliness and greed of his character, who refuses to spend a single cent to repair the room, even though he takes advantage of all the small advantages. The darkness of the room symbolises the ugliness and darkness of his inner self; he is profit-driven, greedy and lustful and sees the act of lending money as helping others, but in reality, it is a means to satisfy his ugly desires. This environment reflects Jeremiah’s character flaws and moral degradation. He also lives with his sickly and tyrannical mother in this crowded and damp place, and this family life environment expresses his attachment to her, which makes it difficult for him to get rid of his psychological perversion and depression.
The residences of Andreotti and Berlusconi, who are the leaders of the government in The Greatest Showman, also reveal their social status.Andreotti’s house, although it appears less frequently in the film, demonstrates his mystery and taste with its dark and mysterious atmosphere, as well as its refined and traditional tone.In contrast, Berlusconi’s seaside villa is extremely luxurious, containing parks, lawns, pools, and multiple buildings. It reflects not only his power and position in politics but also his immense wealth as a businessman.
In the film Hand of God, Fabito’s home becomes the film’s housing space, a flat that is neither luxurious nor spartan but full of familial warmth and intimacy, and this housing space becomes the container that holds Fabito’s emotions and memories, the central place of emotional interaction and memory accumulation in the film. Fabito shares a room with his brother, and they share a deep sense of brotherhood. They exchange conversations about puberty at bedtime. It is also here that Fabito experiences the dramatic conflict and reunion between his parents. These details and heartwarming moments of family life formed an integral part of his upbringing. Yet after the death of his parents, he returns to his home, a once vibrant and warm space transformed into an empty and quiet place. This transformation creates a stark contrast on a visual and emotional level, a sense of vacancy after the loss of a central member of the family. Fabito’s brief stay in this space is not only a retrospective of his past life, but also a symbol of his personal growth and the beginning of his independent life.
Before constructing the algorithmic model, its theoretical foundation needs to be clarified. The relationship between the spatial layout of housing in film narratives and the inner conflicts of characters and social background stations is subtle and complex [18]. In order to quantify this relationship, one can draw on research findings from several fields, such as psychology, sociology and cinema. For example, emotion theory in psychology can help us understand how the spatial layout of housing affects the emotional state of characters. Class theory in sociology can explain how the spatial layout of housing reflects social class differences and conflicts. The narrative theory in film studies can guide us on how to grasp the role of housing space layout in film narratives as a whole.
After clarifying the theoretical foundation, the design of the algorithmic model can be started. The core idea of the model is to reveal the intrinsic connection between them by extracting the characteristics of the spatial layout of the housing in the film and correlating and analysing them with the psychological state of the characters and the social background data.
Acquisition and chunking of housing spatial layout video images
In order to achieve vectorised extraction of housing spatial layout data in the film, the chunking template matching technique is used for the automatic chunking of housing spatial layout video images [19] and the fusion of key feature points of the housing spatial layout video images is carried out according to the similarity of the different features to obtain the chunking principle of the housing spatial layout video images as shown in Fig. 1.
Block processing of video images in building interior space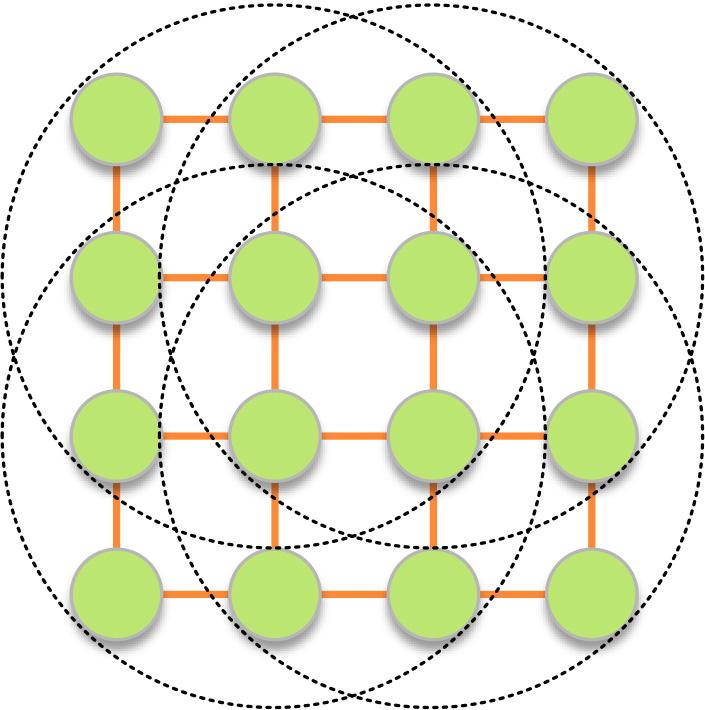
According to the chunk structure diagram of the housing spatial layout video image shown in Fig. 1, the housing spatial layout video image is divided into blocks of affine invariant regions of 4 × 4 sub-regions. The pixel feature point detection of the housing spatial layout video image sequences is carried out by using the distribution field similarity metric and the vector quantisation decomposition method for the housing spatial layout video image processing and feature analysis. The construction of the housing spatial layout video the generated sequence of geometrically invariant moments of the image is:
In the above equation,
Based on the above analysis, the design of the housing spatial layout video image acquisition model and the edge feature detection model of spatial decorative feature points are obtained, and the spatially distributed pixel set is represented as follows:
In Eq. (3),
Edge feature detection of housing spatial layout video image
After completing the acquisition and chunking processing of video images, the housing spatial layout video image feature points are aligned, and the similarity metric is used to extract the dynamic features of the housing spatial layout video image. In the decoration template, the edge feature points of housing space layout video images can be described as:
The feature point matching is performed for each feature point, and the automatic fusion matching method of housing spatial layout video image is used to align the information, construct the template matching model of image features, and obtain the pixel reconstruction result of housing spatial layout video image as:
In the above equation (6), (
It is assumed that the edge information of the housing spatial layout image along the gradient direction is:
Eqs. (9), (10) decompose the edge information of the housing space layout image into two components along the gradient direction, and use
In Eq. (11),
Edge parameter extraction of housing spatial layout parameter distribution sequence
According to the acquired housing spatial layout feature volume, the progress deepening learning algorithm is introduced to extract housing spatial layout features comprehensively [20].
Assuming that the visual feature extraction parameter of housing spatial layout is and the linear unbiased estimator is
On this basis, the fuzzy state parameter of housing spatial layout features is set as:
The fast Fourier transform method is used to reconstruct the dynamic contour distribution feature points of the visual image of housing spatial layout, calculate the output gradient information of the visual image of housing spatial layout, and obtain the output value as:
Through edge parameter segmentation and fusion filtering detection, using the method of constrained model construction, the visual discrimination parameters of housing spatial layout are obtained as:
Implementation of feature extraction based on evolutionary deep learning
In the process of housing spatial layout feature extraction, the determined feature parameters are interfered with by a variety of factors, resulting in poor convergence of feature extraction. Therefore, this paper adopts the evolutionary deep learning algorithm to control the convergence of parameters so as to ensure the extraction accuracy of housing spatial layout features. Evolutionary deep learning is an artificial intelligence algorithm that is widely used in many fields. It is an intelligent algorithm that integrates natural algorithms and evolutionary mechanisms and can find the optimum quickly, and the optimal solution obtained can solve the problems encountered in the research process. Therefore, in this paper, the extraction of housing spatial layout features is achieved with the help of an evolutionary deep learning algorithm.
The convergence threshold of evolutionary deep learning is set to satisfy:
Through the linear filtering of high-resolution information fusion detection, combined with the edge region pixel reorganisation, to achieve the housing spatial layout visual feature extraction segmentation. The segmentation formula is:
The fitting coefficients of the resolved multidimensional spatial chunking images for housing spatial layout visual feature extraction are obtained by the two-dimensional parameter fitting method
According to the results of multi-scale machine learning, reorganise the visual image of housing spatial layout, and use the quaternion (
Choose
Before analysing the correlation between housing layout and characters’ inner conflict and social background, it is first necessary to obtain and process the data in the film that can reflect the characters’ state of mind and social background. In film narratology, collecting and processing data on characters’ mental states and social backgrounds in films is a complex and delicate task. These data are not only crucial for understanding the deeper meaning of the film but also the basis for analysing how the film shows the characters’ inner conflict and social background through the spatial layout of the housing. The following is a detailed account of this process.
Text Analysis
Film scripts and character dialogues are important sources for understanding the psychological state of characters. Through careful analysis of the plot development and dialogue content in the script, the emotional fluctuations, psychological changes, and character traits of the characters can be revealed. For example, arguments, confessions, or monologues between characters can often directly reflect their inner conflicts and struggles. Scene descriptions in the script also contain rich information. Through the detailed depiction of the scene, one can feel the ambiance of the characters and then surmise their psychological state. For example, dim lighting, small spaces, etc., may depress or anxiety of the characters on time.
Visual Analysis
An actor’s performance and body language are other important ways to convey the psychological state of a character. Subtle changes in a character’s emotions can be captured by observing the details of the actor’s expression, movement, and eyes. For example, a sad look or a clenched fist may convey a character’s inner pain or anger. The camera language used by the director can also influence the audience’s understanding of the character’s psychological state. Different camera angles, camera switches, and circular compositions can create different atmospheres and moods. For example, close-up shots can highlight a character’s facial expression, thus showing their inner world more intuitively.
Social Background Information
In order to accurately reconstruct the background of the era in which the film is set, the study has reviewed relevant historical documents and archival materials.These materials include political, economic, and cultural information, which helps to understand the social environment and the behavior of the characters in the film.At the same time, the study effectively obtains the social background reflected in the film by communicating with historians, sociologists, and film scholars.
Data Cleaning
There is some information in the collected data that is not related to the research topic, so the study carefully screens and removes irrelevant information manually to ensure the purity and accuracy of the data. At the same time, the study promptly identified and corrected any errors or omissions in the data collection process to ensure the completeness and reliability of the data.
Data classification and coding
According to the needs of the study, the collected data are classified according to different themes. For example, the psychological state of the characters can be classified as joy, sadness, anger, etc., and the social background can be classified as politics, economy and culture. In order to facilitate the subsequent data analysis, the categorised data are coded, and the coding is in the form of numbers, such as coding joy as 0, sadness as 1, anger as 2, etc., so as to transform the textual information into quantifiable data.
Relationships
A correlation is an objective, uncertain dependence that exists between phenomena. In this relationship, as the dependent variable takes on a value, the other variable will have a number of values to match it. These values show some volatility, but they always fluctuate up and down around their mean value and follow a certain pattern.In the study of correlations, the regularity between quantities needs to be approximated in the form of functional relationships. The correlation coefficient is a statistical indicator used to illustrate the degree of correlation between two types of data in the results of correlation analysis.
Pearson’s correlation coefficient
There are many ways to calculate the correlation coefficient. Pearson’s correlation coefficient is the product of the deviation of two series from their respective averages to measure the closest degree of correlation between the two series.
Assume that Sequence
The Pearson correlation coefficient
For discrete samples, the calculation of Pearson’s correlation coefficient can be transformed into Eq. (27), which facilitates programming using a computer language:
In general, the correlation coefficient and the criterion of the closeness of the correlation relationship are:
Experimental environment
In order to control extraneous variables so that several sets of comparison experiments can be conducted, all experiments in this paper were conducted on the same configured machine. The CPU used for the experiments is Intel(R) Core(TM) i9-10900K 3.70GHz, the GPU is Nvidia Geforce RTX 3090, the operating system is Ubuntu 18.04, and the programming language is Python 3.7.
Parameter Configuration
Due to the different sizes of the original data, the resolution of the input images, edge feature images, and feature extraction images of the network model are uniformly processed to 512 × 512, and the overall training samples get the number of iterations and batch sizes of 15,000 and 10, respectively. The model uses the Adam optimiser during sexual training, the learning rate is initially set to 0.0001, and the weight decay parameter weight_decay is set to 0.0003. The learning rate was updated using the StepLR strategy and the penalty factor for update was set to 0.84. The model parameters were initialised using normal distribution N (0.0, 0.05).
Introduction to the dataset
Currently, in the study of extracting spatial layout features of housing, the LSUN dataset is mainly used for training and validating network models. This dataset is an image scene understanding dataset containing image data from eight housing spatial layout scene categories such as bedroom, living room, etc., which is one of the important benchmark datasets in the field of computer vision. The LSUN dataset applicable to the housing spatial layout feature extraction task includes 5638 images, of which 4230, 397 and 1011 images are in the training, validation and test sets, respectively, which are similar to the pre-ImageNet dataset in terms of labelling distribution, and there is no labelled data in the test set, so it is not applicable in this experiment, and the validation set is used to validate the effectiveness of the proposed method. The dataset contains a total of 10 layout types with different topologies.
Data Preprocessing
In order to improve the generalisation ability of the model as well as to alleviate the overfitting problem, this paper mainly uses cropping and level-flipping operations when geometrically transforming the LSUN dataset.
Horizontal flipping of an image, also known as horizontal mirroring, can alleviate the overfitting problem during training to a certain extent, which is mainly achieved through the transformation of the matrix. For an RGB image of an indoor scene, assuming that the coordinates of the image before flipping are (
It should be noted that cropping the image during network training may lead to a change in its topology, and horizontal flipping of the image may swap the positions of the left and right walls in the indoor scene image. So, while performing horizontal transformation on the data, the category of pixels in the labels needs to be changed appropriately.
Pixel transformation refers to the use of pixel brightness transformation, contrast transformation, saturation transformation, Gaussian noise and blurring for image enhancement in image processing, and in this paper, the first three are mainly used in pixel transformation to process the data.
In order to fully evaluate the segmentation performance of the network model in this paper, as well as the comparison with other models, this paper adopts the evaluation metrics that are commonly used in the field of spatial layout feature extraction: intersection and merger ratio, mean intersection and merger ratio, pixel accuracy, category average pixel accuracy and overall pixel error. Compared to MPA, PE relatively ignores the problem of poor accuracy in some small categories and can reflect the overall extraction effect of the model.
Assuming that
Intersection and Union Ratio (IoU)
IoU denotes the ratio of the intersection and concatenation of the set of predicted true values and the set of predicted values for each category, which can be computed by
Average intersection and merger ratio
The mIoU denotes the average value of IoU for each category and its formula is shown in (32):
Pixel Accuracy
PA denotes the ratio between the number of pixels predicted to be correctly classified and the total number of pixels, and can be used to measure the classification accuracy of a dataset. Its calculation can be expressed as equation (33):
Mean Pixel Accuracy (MPA)
MPA is the mean value of pixel accuracy for all categories, which is calculated as shown in Equation (34):
Overall pixel error
PE denotes the proportion of total pixels occupied by pixels with global prediction error, which is calculated as shown in Equation (35):
In order to verify the effectiveness of the method proposed in this paper, as well as to compare the performance difference of other methods. This paper mainly conducts two sets of comparison experiments on the LSNU dataset: one time, the method model proposed in this paper is compared with the currently delivered housing spatial layout feature extraction algorithms FCN, PSPNet, and DeepLabV3+ to do comparison experiments. The second step is to compare the proposed method model with other methods for extracting housing spatial layout features, including traditional methods and research in the past two years.
Comparison with other feature extraction models
The experimental results in the LSUN dataset are shown in Table 1 and Table 2, where Table 1 shows the IoU values of each model on specific feature categories and mIoU of all feature categories, Table 2 shows the PA values of each model on specific feature categories and MPA and PE values of all feature categories, and F1-F5 denote the structural, open, closed, dynamic, and static space, respectively, of the housing spatial layout. Space 5 feature types. As a whole, the model proposed in this paper achieves 80.57%, 89.93%, and 7.62% of mIoU, MPA, and PE evaluation indexes, respectively, on the LSNU dataset, which is better than other models. From the experimental results in Table 1, it can be seen that compared with other feature extraction models, this paper’s method is overall better than each comparative method in terms of IoU and mIoU evaluation metrics, and the DeepLabV3+ model is more effective than the FCN and PSPNet models. Evaluated using the mIoU metrics on the LSNU dataset, this paper’s model exceeds the FCN, PSPNet, and DeepLabV3+ models by 9.53%, 7.31%, and 5.74%, respectively. The data in Table 2 show that on the LSNU dataset, the global evaluation metrics MPA and PE obtained by this paper’s model are 89.93% and 7.62%, which outperform the FCN, PSPNet, and DeepLabV3+ models by 11.36%, 7.47%, and 6.39% and by 11.33%, 9.74%, and 7.81%, respectively. In addition, on the evaluation index PA, the extraction ability of the model proposed in this paper in each specific feature is also better than the comparison method, and the feature extraction effect on the spatial layout of housing has obvious improvement.
Comparison of IoU and mIoU of each model on LSNU datasets Comparison pf PA, MAP and PE of each model on LSUN datasets
Method
IoU/%
mIoU/%
F1
F2
F3
F4
F5
FCN
34.87
71.83
78.44
88.47
81.57
71.04
PSPNet
43.26
74.67
80.03
89.12
82.38
73.26
DeepLabV3+
46.51
77.36
81.92
90.08
84.56
74.83
Ours
53.62
82.95
86.79
93.84
89.74
80.57
Method
PA/%
MPA/%
PE/%
F1
F2
F3
F4
F5
FCN
61.34
73.86
83.26
88.94
83.71
78.57
18.95
PSPNet
63.81
75.98
85.57
89.03
85.69
82.46
17.36
DeepLabV3+
65.47
79.42
87.42
90.26
89.37
83.54
15.43
Ours
73.94
85.97
92.38
94.63
92.09
89.93
7.62
Comparison with other feature extraction methods
Fig. 2 shows the performance of different methods on LSNU data with respect to pixel error, where No denotes non-end-to-end methods and Yes denotes end-to-end methods. Before, the CFILF method was considered a non-end-to-end method. After this belongs to the end-to-end learning method, and the end-to-end method is significantly better than the non-end-to-end method. Among several end-to-end methods, the network model proposed in this paper performs the best in PE evaluation metrics and achieves a pixel-level error rate of 6.26% on the LSNU test set, which fully verifies the superiority of evolutionary deep learning methods.
Comparison of this paper’s model with other related research methods on PE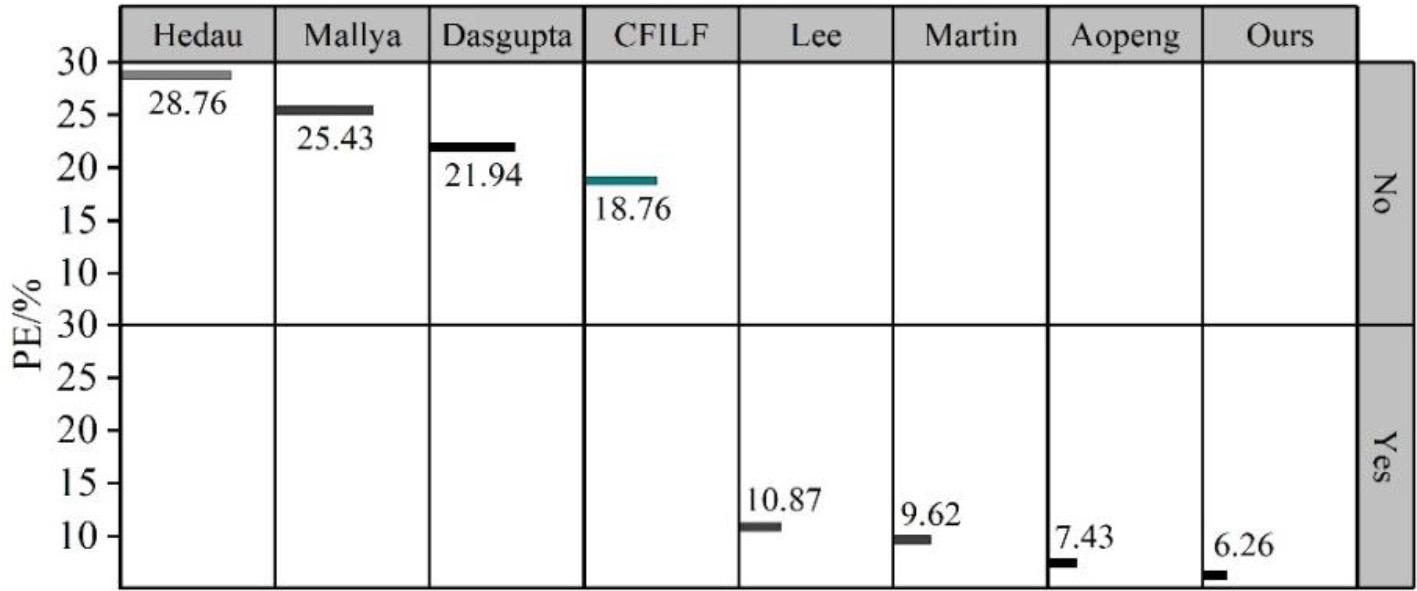
In summary, the effectiveness and superiority of this paper’s model in housing space feature extraction is verified through comparative analysis with other housing space feature extraction models. It lays the foundation for the following analysis of the correlation between housing space layout and characters’ inner conflict and social background, as well as the research on the technique of showing the inner conflict and social background of tasks in the film through housing space layout.
Data Selection
This paper classifies housing space layout into 5 types of layout, namely open layout, closed layout, hierarchical layout, symmetrical layout and asymmetrical layout, according to the extracted characteristics of housing space layout, which are coded as A-E, respectively.15 relevant films containing the 5 types of housing space layout are selected, and character psychology reflecting the characters’ inner conflicts in the films is classified as pleasant, conservative, complex, order-seeking and rebellious, 5 kinds, coded as 0-4, respectively. Calculate the Pearson’s correlation coefficient between the housing space layout and the character’s psychology to analyze the correlation between the housing layout and the character’s inner conflict.
Analysis of results
Figure 3 shows the results of calculating the Pearson correlation coefficient between 5 kinds of housing space layouts and 5 kinds of characters’ psychology, and the thickness of the connecting lines in the figure indicates the size of the correlation coefficient. From the figure, it can be seen that there is a strong correlation between the housing layout in the film and the psychological state that reflects the inner conflict of the characters. Pearson’s correlation coefficients of open layout, closed layout, hierarchical layout, symmetrical layout and asymmetrical layout and the psychology of pleasure, conservatism, complexity, pursuit of order, and rebellion are 0.927, 0.913, 0.943, 0.905, and 0.916, respectively. The findings indicate that it is preferred to display the characters’ relaxed and enjoyable hearts through the open layout in the film narratives.When there is a need to show the conservative nature of the characters in the film narrative, a closed layout is usually used in terms of housing layout. Hierarchical layouts, on the other hand, maybe a metaphor for the complexity and hierarchy of a character’s heart. The symmetrical and asymmetrical layouts, on the other hand, reflect the film character’s inner pursuit of order or social status and the character’s inner rebelliousness, respectively.
Correlation coefficient calculation results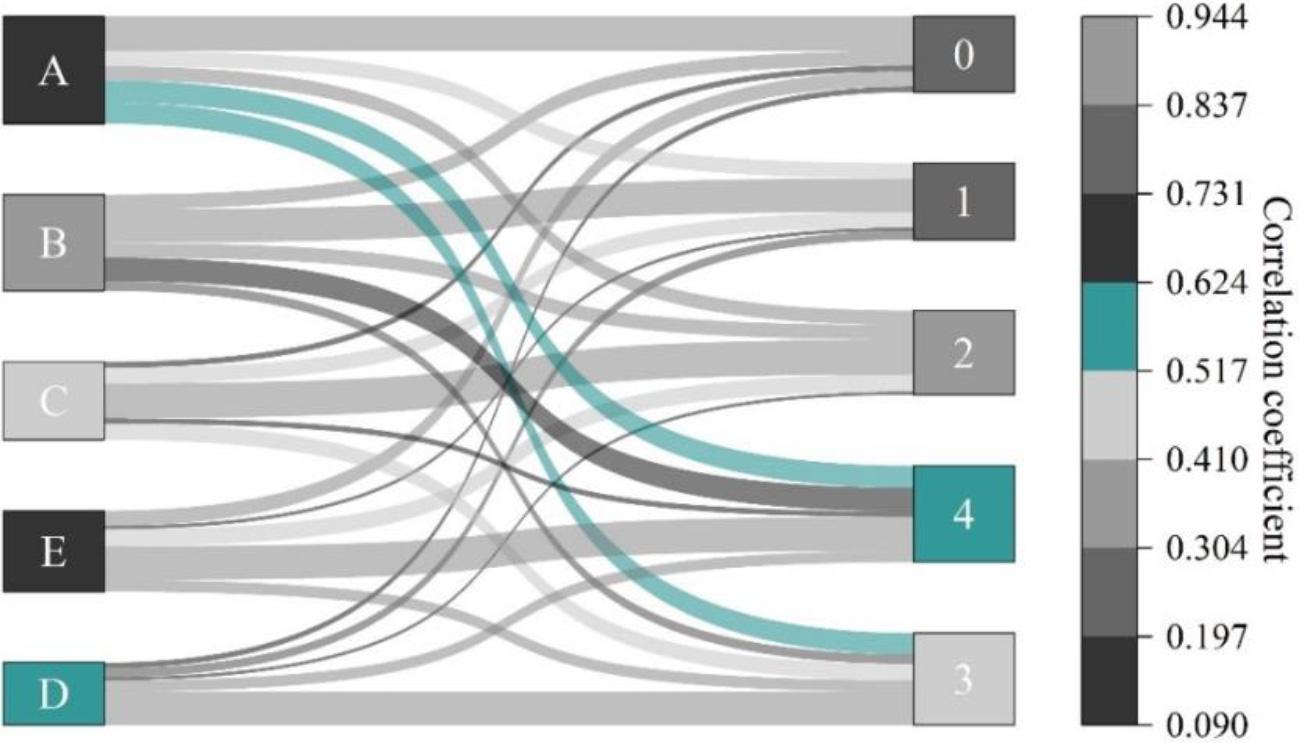
Data Selection
The changes in the spatial layout of housing in different periods not only reflect socio-economic, cultural, and technological progress, but also profoundly explain the transformation of people’s lifestyles and inner thoughts. Similar to the analysis in the previous subsection, this subsection selects the same 15 films and observes the different social backgrounds they reflect. By manually querying the background settings of the films, the social backgrounds of the films were classified into five types, namely, the 1950s, the 1960s, the 1970s, the 1980s, and the 1990s, coded as a-e. The spatial layouts of the housing were adjusted and classified into five types of layouts, namely thatched huts, small houses, silos, flats, and commercial houses, according to different social periods, coded as L1-L5, respectively. Calculate the Pearson correlation coefficient between housing spatial layout and social background, and analyse the correlation relationship between housing spatial layout and social background.
Analysis of results
Figure 4 shows the results of Pearson’s correlation coefficients between five different social backgrounds and the spatial layout of housing. The Pearson correlation coefficients between five kinds of housing spatial layout and five kinds of social backgrounds in the 1950s, 1960s, 1970s, 1980s and 1990s are 0.919, 0.973, 0.964, 0.942, 0.956, respectively, as can be seen in Fig. 4. The thatched roof houses reflect the economic backwardness and low standard of living situation of the 50s in social background. Low living standard condition. Small earth squares were typical housing in the 1960s, with simple indoor facilities that reflected the social context of the time, the hard economic conditions, and the minimum standard of people’s housing needs. The emergence of the silo reflects the huge demand for housing in the 1970s as a result of accelerated urbanisation and population explosion. The spatial layout of flats contributed to the modernisation of family structures and lifestyles in society, and the commercial housing of the 1990s highlighted the different levels of housing demand in the social context of the time.
Correlation coefficient between layout of housing and social background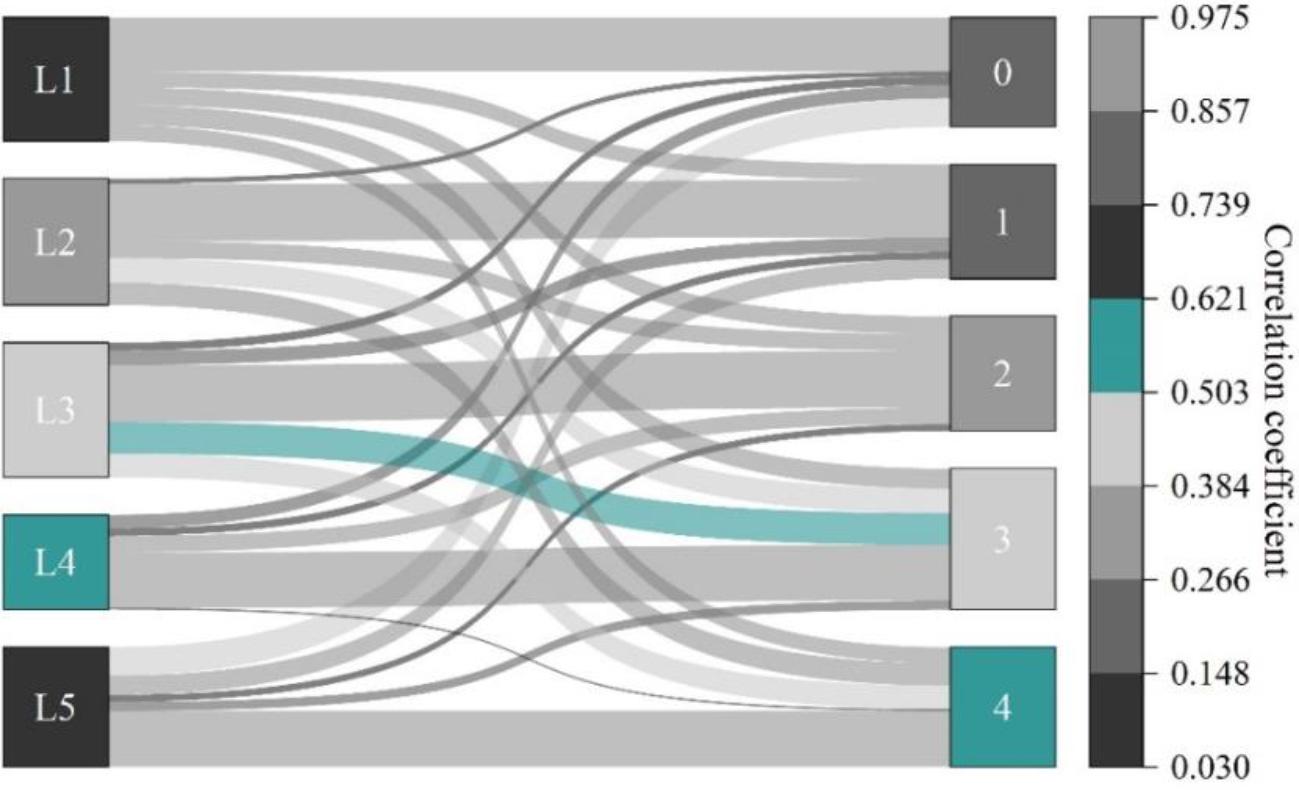
In summary, there is a strong correlation between the spatial layout of housing and the inner conflicts of characters and social backgrounds. The use of different spatial layouts of housing in the film narrative can effectively reflect the psychological state of the characters or the social background to be expressed. This film narrative technique of displaying characters’ inner conflicts and social backgrounds through the spatial layout of housing can make the audience feel the development of the film’s storyline more directly, and it is easier to put themselves into the storyline of the film. This technique is an important way to enhance the audience’s experience and improve their satisfaction with the film.
This paper focuses on the method of displaying the spatial layout of housing to depict the inner conflicts of characters and the social background in film narratives.An evolutionary deep learning model is used to extract comprehensive features from housing space layout.The correlation relationship between housing space layout and the character’s inner conflict, as well as the housing space layout and social background, is analysed according to the calculation results of Pearson’s correlation coefficient.
The mIoU, MPA and PE evaluation indexes achieved by this paper’s housing space layout feature extraction model on the LSNU data machine are 80.57%, 89.93%, and 7.62%, respectively, which are better than other models. And the global evaluation metrics of MPA and PE obtained by this paper’s model on the LSNU dataset are 89.93% and 7.62%, which are better than FCN, PSPNet, DeepLabV3+ models by 11.36%, 7.47%, 6.39% and 11.33%, 9.74%, 7.81%, respectively. It indicates that the model in this paper has higher performance in extracting housing spatial layout features compared to other models, which is more suitable for the needs of this study.
The Pearson’s correlation coefficients between five types of housing spatial layouts, such as open layout, and five types of psychological states, such as pleasure, which reflect the character’s inner conflicts, are 0.927, 0.913, 0.943, 0.905, 0.916, respectively, which indicate that the use of housing spatial layouts can effectively display the characters’ inner conflicts in the film narratives. The correlation coefficients between five kinds of social backgrounds, such as the 1950s, and five kinds of housing spatial layouts, such as thatched roof huts and small huts, are 0.919, 0.973, 0.964, 0.942, and 0.956, respectively, which indicate that the different housing spatial layouts can reflect the economic situation and people’s living conditions at that time, and thus let the audience intuitively feel the social background of the characters in the film narrative. From then on, this paper strongly argues the reasonableness of using the spatial layout of housing to reflect the inner conflict of characters and the social background of the film narrative through the correlation analysis and lays a solid foundation for the further study of film narrative techniques.