Analysis of Tourism Business Process Automation and its Benefits from an Educational Perspective
Mar 17, 2025

About this article
Published Online: Mar 17, 2025
Received: Nov 02, 2024
Accepted: Feb 09, 2025
DOI: https://doi.org/10.2478/amns-2025-0172
Keywords
© 2025 Ying Yu, published by Sciendo
This work is licensed under the Creative Commons Attribution 4.0 International License.
Figure 1.
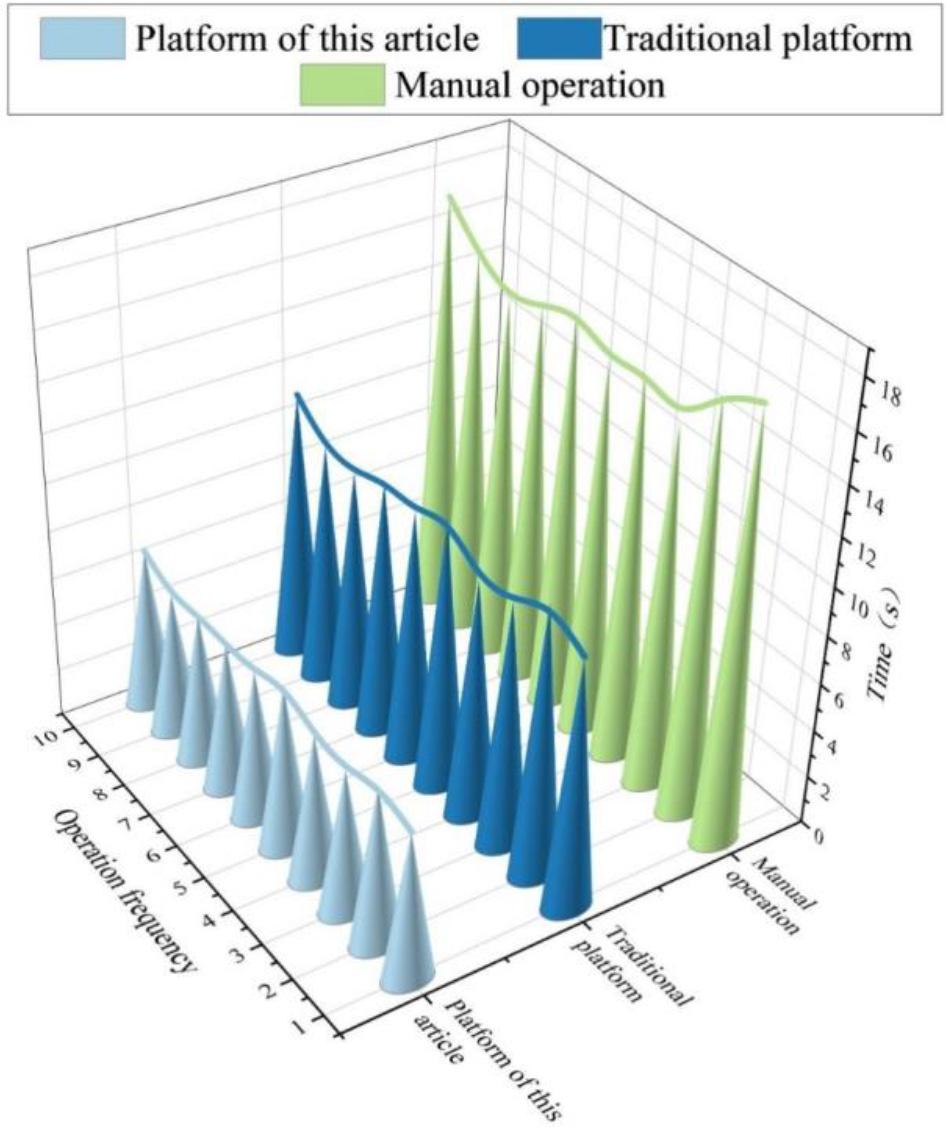
Figure 2.
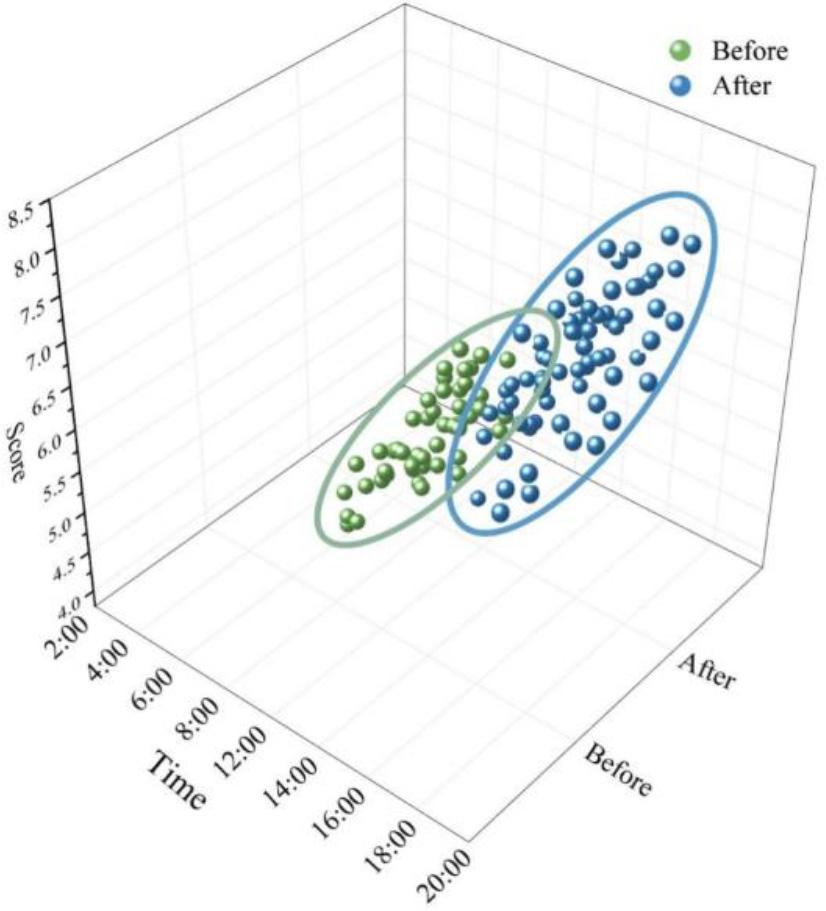
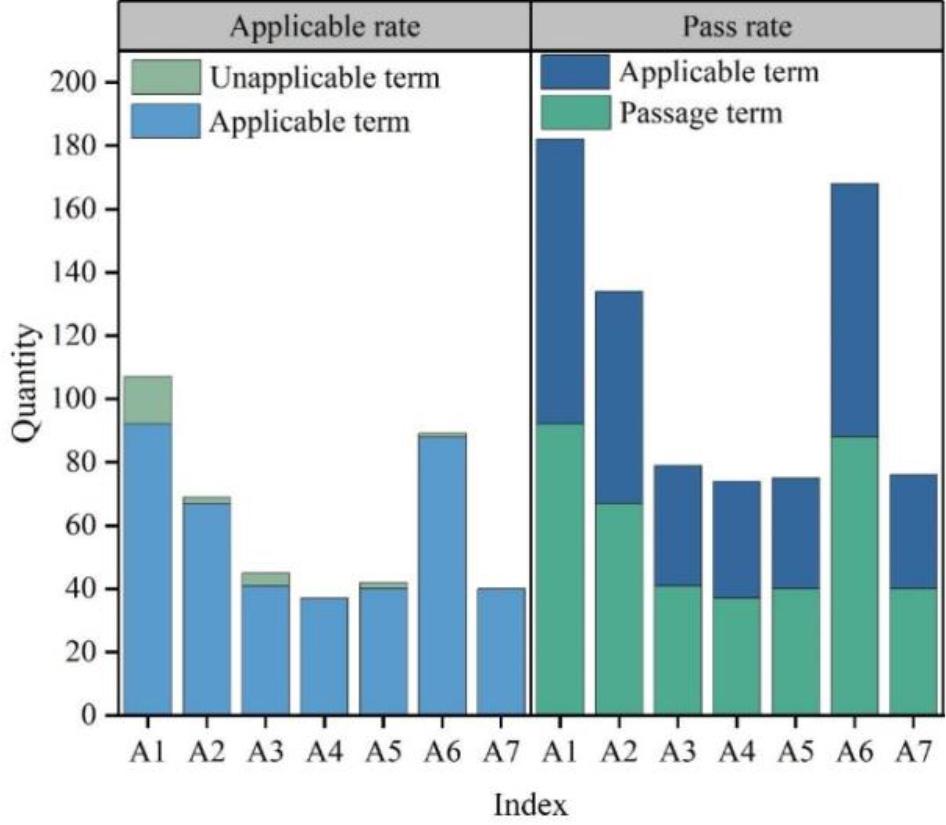
Figure 3.
Evaluation grade
| Evaluation grade | Interval |
|---|---|
| Excellence | (0.875,1] |
| Good | (0.675,0.875] |
| Medium | (0.55,0.675] |
| Qualify | (0.4,0.55] |
| Unqualify | [0,0.4] |
Number of nodes in business flow
| Business flow | Demand processing process | Defect processing process | Total |
|---|---|---|---|
| The amount of nodes before optimization | 20 | 16 | 36 |
| The amount of nodes after optimization | 13 | 10 | 23 |
| Optimized node quantity | 7 | 6 | 13 |
| Optimization ratio | 35% | 37.5% | 36.11% |
| The average task processing quantity before optimization | 27 | 45 | 72 |
| The average task processing quantityafter optimization | 34 | 54 | 88 |
| Efficiency ratio | 125.93% | 120% | 122.22% |
| Pre-optimize business scores | 6/10 | 7/10 | - |
| Optimized business scores | 8/10 | 9/10 | - |
Implementation effect
| Primary indicator | Score | Secondary indicator | Score | Tertiary index | Score |
|---|---|---|---|---|---|
| Overall implementation effect score | 0.804 | Financial index | 0.847 | Operational capacity | 0.919 |
| profitability | 0.767 | ||||
| solvency | 0.791 | ||||
| Development ability | 0.911 | ||||
| Customer index | 0.845 | Customer satisfaction | 0.984 | ||
| Brand market share | 0.864 | ||||
| Customer assurance | 0.556 | ||||
| Customer gain | 0.976 | ||||
| Internal business process indicators | 0.854 | Product quality | 0.858 | ||
| Supplier and purchasing pipe | 0.938 | ||||
| After-sales service | 0.937 | ||||
| New product development | 0.683 | ||||
| Learning and growth indicators | 0.671 | Employee satisfaction | 0.46 | ||
| Staff training rate ratio | 0.882 |